Abstract
Various approaches for evaluating the bioequivalence (BE) of highly variable drugs (CV ≥ 30%) have been debated for many years. More recently, the FDA conducted research to evaluate one such approach: scaled average BE. A main objective of this study was to determine the impact of scaled average BE on study power, and compare it to the method commonly applied currently (average BE). Three-sequence, three period, two treatment partially replicated cross-over BE studies were simulated in S-Plus. Average BE criteria, using 80–125% limits on the 90% confidence intervals for Cmax and AUC geometric mean ratios, as well as scaled average BE were applied to the results. The percent of studies passing BE was determined under different conditions. Variables tested included within subject variability, point estimate constraint, and different values for σw0, which is a constant set by the regulatory agency. The simulation results demonstrated higher study power with scaled average BE, compared to average BE, as within subject variability increased. At 60% CV, study power was more than 90% for scaled average BE, compared with about 22% for average BE. A σw0 value of 0.25 appears to work best. The results of this research project suggest that scaled average BE, using a partial replicate design, is a good approach for the evaluation of BE of highly variable drugs.
Key words: bioequivalence, highly variable drugs, scaled bioequivalence, simulations
INTRODUCTION
Bioequivalence (BE) studies are an integral component of the new drug development process. Additionally, they are required for the approval and marketing of generic drug products. BE studies are generally designed to determine if there is a significant difference in the rate and extent to which the active drug ingredient, or active moiety, becomes available at the site of drug action. According to the criteria developed by the U.S. Food and Drug Administration (FDA) and generally applied by other regulatory agencies, two pharmaceutically equivalent products are judged bioequivalent if the 90% confidence interval of the geometric mean ratio (GMR) of AUC and Cmax fall within 80–125% (1).
Bioequivalence criterion that consider both mean differences and variance components have long been established in the literature. Sheiner (1992) and Schall and Luus (1993) independently derived similar criterion that encompass many of the proposed criteria for approaches to bioequivalence (2,3). Sheiner based a criterion on the ratio of the distance between administration of the test and reference products to repeated administration of the reference product, and defined the individual distance ratio as E(Ti − Ri)2/E(Ri − Ri′)2. Schall and Luus (1993) based a criterion on the difference of the same expected quantities, that is, E(Ti − Ri)2 − E(Ri − Ri′)2.
The various criteria proposed for assessing bioequivalence criteria can be classified as probability-based and moment-based. The criteria are also categorized as aggregate (means and variances in one criteria), disaggregate (separately test component means and variances), scaled and unscaled. The FDA considered several of these approaches (4).
The outcome of a BE study can be impacted by factors other than true differences in Cmax and/or AUC between test and reference. These include sample size and variability (e.g., within-subject variability in a cross-over design). All conditions being equal, the sample size needed to demonstrate bioequivalence increases with greater within-subject variability, often expressed in % coefficient of variation (%CV). For example, in a two-way crossover design, two products with identical bioavailability may require 40 subjects to demonstrate BE with 90% power if the within-subject CV is 30%; under the same conditions, the number of subjects needed jumps to 140 at within-subject CV of 60% (5).
Concerns about the relatively large sample sizes needed for studies testing the BE of highly variable drugs (HVD), generally defined as those with 30% CV or greater in Cmax or AUC, has led several investigators to examine alternative approaches to the use of the 80–125% limits on the 90% confidence interval for the geometric mean ratio for Cmax and AUC (defined as average BE) (6–11). Major regulatory agencies also considered different approaches for evaluating BE of highly variable drugs (12–14). Recently, the FDA presented to the Advisory Committee for Pharmaceutical Science (ACPS Meeting, April 2004) possible alternatives to average BE method for highly variable drugs (15). The committee favored a scaled approach, where the BE limits may be expanded based on the variability of the drug product. Furthermore, the committee recommended that the FDA study different scaling approaches, to determine a preferred method. As a result, the FDA formed a Highly Variable Drugs Working Group to study this issue, and a simulations-based research project was initiated. Preliminary results were presented at the ACPS Meeting in October, 2006 (16,17), and at the “Bioequivalence, Biopharmaceutics Classification System, and Beyond” workshop, May 2007, which was sponsored by the American Association of Pharmaceutical Scientists (AAPS) (18). This paper presents details of the research project, which supports an FDA proposal of a new approach for evaluating bioequivalence of highly variable drugs. The specific objective of this project was to evaluate the impact of scaled average bioequivalence on study power, or percent of studies passing BE, using different within-subject variability and under different conditions.
METHODS
Study Design
Three sequence, three period, two treatment partially replicated crossover bioequivalence studies, with 36 subjects (12 in each sequence) were simulated using S-Plus (Insightful Corp., Seattle, Washington). The reference product was administered twice to obtain within subject variability for the reference product, while the test product was administered once. The three-way cross over design was selected because it appeared to provide a more practical and efficient approach for scaling, compared with a full replicate, four-way cross over study design. Sequences used in the study are provided below:
| Periods | |||
|---|---|---|---|
| 1 | 2 | 3 | |
| Sequence 1 | T | R | R |
| Sequence 2 | R | T | R |
| Sequence 3 | R | R | T |
No subject-by-formulation interaction was assumed. For most tests, the true %CV values considered for the simulations were 30%, 40%, 50% and 60% for the test and reference. Additionally, the impact of a more variable test product was evaluated by keeping the true %CV at 30% for the reference product, while varying the %CV of the test product between 30% and 60%. The parameters were assumed to be log normally distributed and the standard deviations for the test and the reference were calculated from the assumed within subject CV by using the following formula:
 |
1 |
The true GMR values ranged from 1 (true BE) to 1.70. One million BE studies were simulated for each condition. Scaled average bioequivalence, with and without point estimate constrains were applied in addition to average BE criteria. Power was calculated as the percentage of the studies passing each condition and power curves were created by plotting the power against the true value of the GMR. The underlying statistical model is similar to that described in Hyslop, Hsuan, and Holder (2000), which allows for separate estimation of the Test and Reference means, denoted μT and μR, respectively, and the within-subject variance of the reference product, denoted σWR2 (19).
The criterion for scaled average bioequivalence in terms of the model parameters is:
 |
2 |
Similar criteria have been considered in the literature (8–11).
Variables evaluated in the simulations included: Impact of increasing within subject variability (test and reference); effect of constraining the point estimate (GMR) to 80–125%; and applying different values (0.2, 0.25 and 0.294) of the regulatory constant σw0. The regulatory constant values of 0.2, 0.25, and 0.294 reflect within subject variabilities of 20%, 25%, and 30%, respectively. These variables helped define the scaling model, as well as FDA’s proposal for the BE of highly variable drugs.
RESULTS AND DISCUSSION
The impact of scaled average bioequivalence on study power was evaluated under different conditions relative to average BE. Study power was expressed as percent of studies passing BE. Expansion of the limits is specific to highly variable drugs, generally defined as drugs or drug products that show within-subject CV of 30% or greater in AUC or Cmax. This is in contrast to the confidence interval limits of 80–125% used by average BE (20), and generally applied to all drugs regardless of variability.
The studies simulated for this project had a partial replicate, three-way cross-over design, where the reference product is administered twice, and the test product once. A possible sequence would be reference–test–reference (RTR). Such replication allowed for the estimation of within subject variability of the reference, which is needed for the scaling model. A fully replicate, four-way crossover design would also work, i.e., provide an estimate of reference within subject variability; however, the three-way cross-over design appears to be a more efficient method for arriving at the same answer.
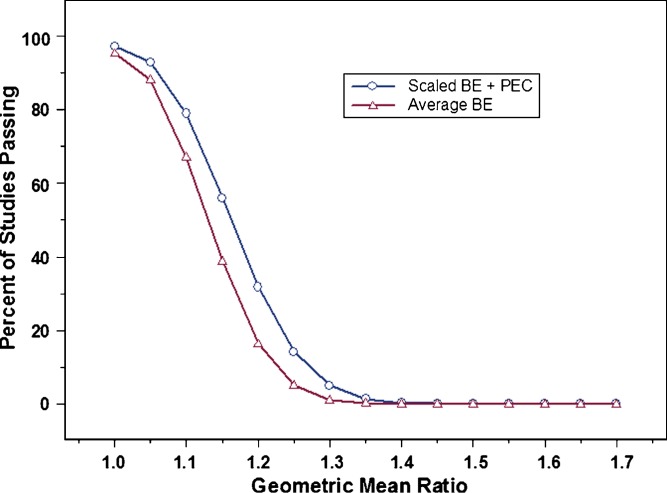
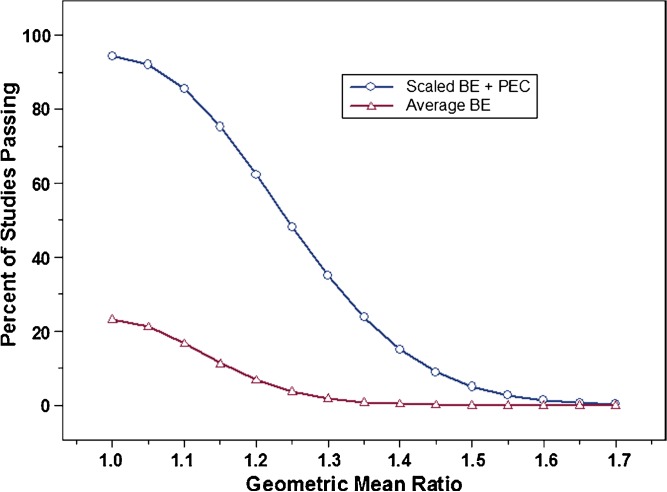
Factors evaluated during this study included within-subject variability, the use of a point estimate constraint in conjunction with the scaling approach, and different values for σw0, a constant in the scaling model which is defined by the regulatory agency. Figure 1 shows that at 30% CV, the proposed scaling method with a point estimate constraint already provides some advantage over average BE method with respect to study power. This advantage is far greater when within-subject variability reaches 60% CV (Fig. 2). For example, at 60% CV and a sample size of 36 subjects, using the average BE method will result in a study power of about 22%, i.e., about one study in five would pass BE. This is true for two products with identical bioavailability (geometric mean ratio of one). Using scaled average BE, however, increases study power to more than 90% under the same conditions. Clearly, the use of scaled average BE can have a significant impact on the evaluation of BE for highly variable drugs, especially as variability reaches 60% or greater.
Fig. 1.
Percent of studies passing bioequivalence (BE) (power curves); average BE (open triangle) vs. scaled average BE (open circle), with a point estimate constraint, at 30% CV (test and reference), N = 36, and σ w0 = 0.25. Results shown represent one million simulations
Fig. 2.
Percent of studies passing for average BE (open triangle) vs. scaled average BE (open circle), with a point estimate constraint, at 60% CV (test and reference), N = 36, and σ w0 = 0.25. Results shown represent one million simulations
Another factor evaluated in this study was the use of a point estimate constraint, as an additional criterion that would be required with scaled average BE. Previously, Hauck et al. demonstrated that widening of the BE limits to 70–143% in the case of Cmax could result in studies with mean ratios of 128% or greater passing BE (21). Since a mean ratio of such a magnitude may pose clinical concerns for some drugs, it was judged that expansion of the BE limits was not adequately justified. Using scaled average BE, the expanded limits may exceed 70–143%, depending on the within-subject variability of the reference. This could lead to drugs with even larger mean ratios (>128%) being declared bioequivalent. To avert this possibility, it was necessary to add a constraint (±20%) on the point estimates for Cmax and AUC. Studies with point estimates exceeding ±20% would fail, even if they pass based on scaling alone.
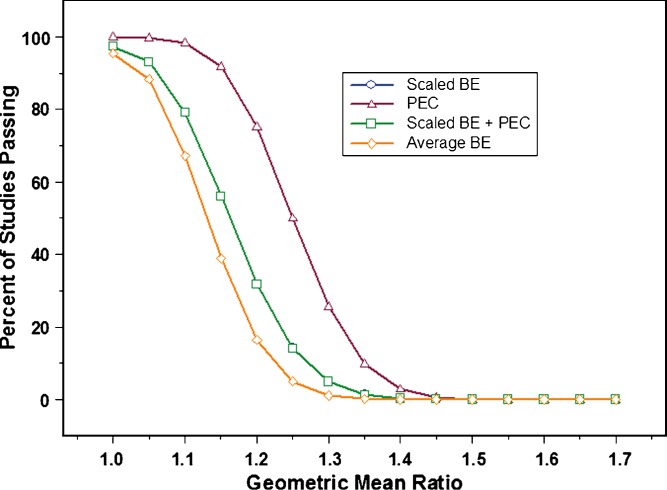
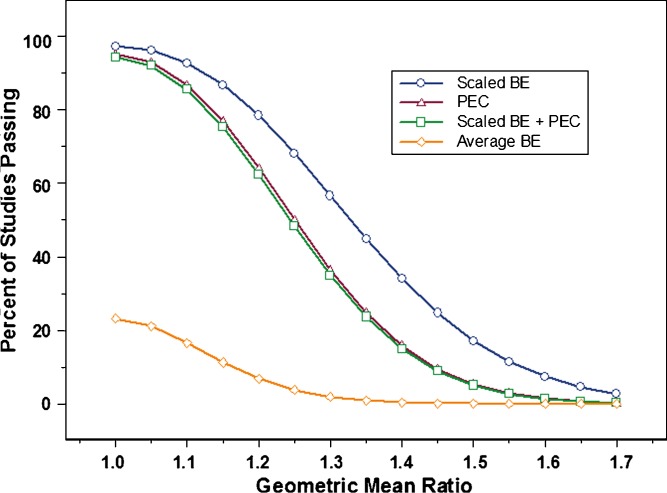
Once it was decided that constraining the point estimate to ±20% was necessary, the impact on study power was evaluated. Figures 3 and 4 show power curves at 30% CV and 60% CV, respectively, for the following conditions: Scaling applied by itself (Scaled ABE); point estimate constraint without scaling; and scaling with point estimate constraint. The graphs also include plots for average BE, for comparison purposes. At 30% CV, it was observed that constraining the point estimate had no impact at all on study power. The plot for scaling plus point estimate constraint completely overlapped with the plot for scaling by itself. For this reason, the two plots show as one. In other words, at 30% CV, applying scaled average BE would provide the same results irrespective of the use of a point estimate constraint. The converse was true when within subject variability reached 60% CV (Fig. 4). It was observed that point estimate constraint had the dominant effect on the percent of studies passing, compared to scaling by itself. This can be seen in the close proximity of the plots for scaling + point estimate constraint and point estimate constraint by itself.
Fig. 3.
Power curves for average BE (open diamond); scaled average BE with point estimate constraint (PEC)(open square); PEC (open triangle); and scaled average BE without PEC (open circle). The experimental conditions were as follows: 30% CV (test and reference), N = 36, and σ w0 = 0.25. Results shown represent one million simulations. Please note that the plot for scaled average BE does not appear on the graph because it completely overlaps with the plot for scaled average BE with point estimate constraint, indicating no impact of constraining the point estimate at this level of within subject variability
Fig. 4.
Power curves for average BE (open diamond); scaled average BE with PEC(open square); PEC (open triangle); and scaled average BE without PEC (open circle). The experimental conditions were as follows: 60% CV (test and reference), N = 36, and σ w0 = 0.25. Results shown represent one million simulations
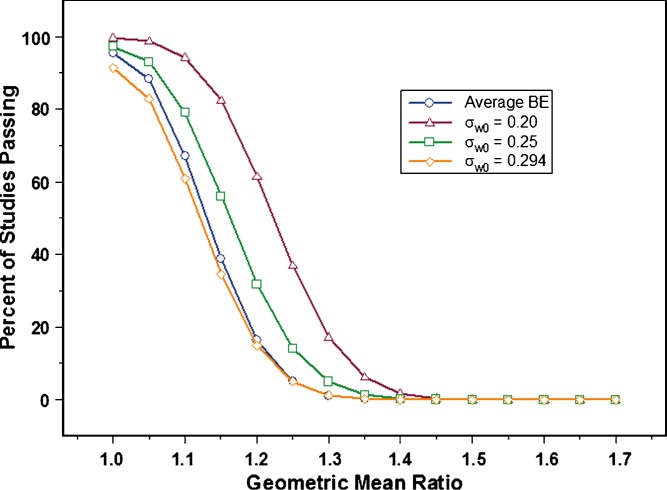
A third factor evaluated was σw0. This constant in the scaling model (4,16,18) is the standard deviation (or degree of variability) at which the confidence interval limits begin to widen. This in turn impacts the number of studies that would pass BE at a given %CV. Since σw0 has to be set by the regulatory agency, three values, 0.2, 0.25, and 0.294, corresponding roughly to 20%, 25%, and 30% CV, respectively, were tested.
Figure 5 illustrates the impact of each value selected for σw0 on study power, when within-subject variability is 30% CV. The results suggest that setting σw0 to 0.2 would allow a large number of studies to pass BE compared to when average BE is applied. At a true GMR of 1.1, it is desirable that a larger number of BE trials pass. However, it is undesirable to have more studies pass when the true GMR is large (e.g., 1.2), as was observed with σw0 set to 0.2. In contrast, σw0 value of 0.294 provided even less power than average BE, when within subject variability was 30% CV. This suggested that it is more restrictive for drugs at or near the cutoff point for defining high variability, an undesired trait.
Fig. 5.
Power curves showing average BE (open circle), and different values for σ w0. The experimental conditions were as follows: 30% CV (test and reference), N = 36, and σ w0 = 0.20 (open triangle), 0.25 (open square), and 0.294 (open diamond). Results shown represent one million simulations
The 0.25 value for σw0 appears to provide the best results. Study power increased compared to average BE, without causing a relatively large number of studies to pass at GMRs of 1.2 and greater (observed with σw0 = 0.2). Furthermore, a σw0 of 0.25 results in a lower inflation of Type I error compared to a σw0 value of 0.294. Type I error, defined as the risk of concluding two products are bioequivalent when in fact they are not, is 0.05 (or 5%) for average BE. It is undesirable for any new method to significantly deviate from this value.
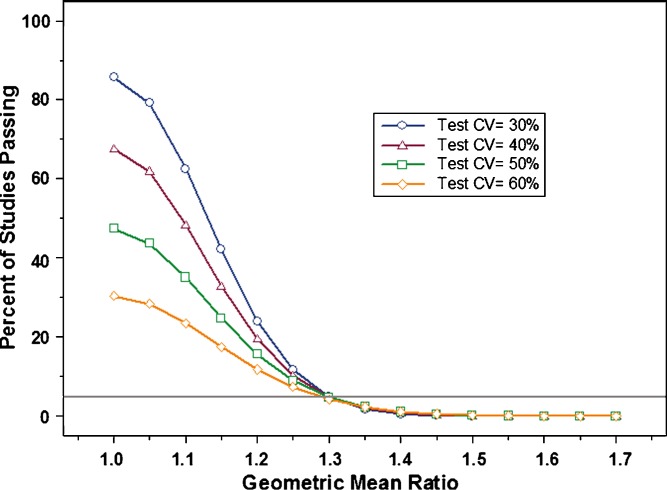
Finally, during the course of this study, a question was raised regarding the impact of greater within subject variability in the test product relative to the reference. The proposed study design estimates within subject variability for the reference, but not for the test product. Therefore, we simulated additional studies where within subject variability in the reference was kept constant (30% CV), while it increased for the test product (range 30% CV to 60% CV). As can be seen in Fig. 6, higher variability in the test product resulted in significantly decreased study power. This suggests that the variability of the test product can impact the conclusion of bioequivalence at a given sample size, although it is not estimated in the proposed study design and does not contribute directly to the scaling model. Practically speaking, this is a desired outcome because it demonstrates a lower probability for a more variable test (generic) product demonstrating BE to a superior, less variable reference listed drug (RLD).
Fig. 6.
This graph illustrates the impact on study power of increasing within subject variability in the test product, while keeping variability of the reference constant (30% CV). Variability (%CV) in the test product evaluated was: 30% (open circle), 40% (open triangle), 50% (open square), 60% (open diamond)
CONCLUSION
Results from this project suggest that scaled average bioequivalence provides a good approach for evaluating the bioequivalence of highly variable drugs and drug products. It would effectively decrease sample size, without increasing patient risk. The use of a point estimate constraint addresses concerns that products with large GMR differences may be judged bioequivalent. A test product which is more variable than the reference is likely to fail BE, despite expansion of the BE limits.
Acknowledgments
The authors would like to acknowledge the following individuals for their contributions to FDA’s Highly Variable Drugs working group: Mei-Ling Chen, Devvrat Patel, Lai Ming Lee, and Robert Lionberger.
Footnotes
The views expressed in this paper are those of the authors’ and do not necessarily represent the policy of the U.S. Food and Drug Administration.
An erratum to this article can be found at http://dx.doi.org/10.1208/s12248-008-9059-y
References
- 1.U.S. Food and Drug Administration. Guidance for Industry: Bioavailability and Bioequivalence Studies for Orally Administered Drug Products—General Considerations, March 2003.
- 2.Sheiner L. B. Bioequivalence Revisited. Stat. Med. 1992;11:1777–1788. doi: 10.1002/sim.4780111311. [DOI] [PubMed] [Google Scholar]
- 3.Schall R., Luus H. G. On Population and Individual Bioequivalence. Stat. Med. 1993;12:1109–1124. doi: 10.1002/sim.4780121202. [DOI] [PubMed] [Google Scholar]
- 4.Haidar S. H., Davit B., Chen M-L., Conner D., Lee L. M., Li Q. H., Lionberger R., Makhlouf F., Patel D., Schuirmann D. J., Yu L. X. Bioequivalence approaches for highly variable drugs and drug products. Pharm. Res. 2008;25:237–241. doi: 10.1007/s11095-007-9434-x. [DOI] [PubMed] [Google Scholar]
- 5.Patterson S. D., Zariffa N. M.-D., Montague T. H., Howland K. Non-traditional study designs to demonstrate average bioequivalence for highly variable drug products. Eur. J. Pharm. Sci. 2001;57:663–670. doi: 10.1007/s002280100371. [DOI] [PubMed] [Google Scholar]
- 6.Midha K. K., Rawson M. J., Hubbard J. W. The bioequivalence of highly variable drugs and drug products. Int. J. Clin. Pharmacol. Therap. 2005;43:485–498. doi: 10.5414/cpp43485. [DOI] [PubMed] [Google Scholar]
- 7.Boddy A. W., Snikeris F. C., Kringle R. O., Wei G. C. G., Opperman J. A., Midha K. K. An approach for widening the bioequivalence acceptance limits in the case of highly variable drugs. Pharm. Res. 1995;12:1865–1868. doi: 10.1023/A:1016219317744. [DOI] [PubMed] [Google Scholar]
- 8.Tothfalusi L., Endrenyi L. Limits for the scaled average bioequivalence of highly variable drugs and drug products. Pharm. Res. 2003;20:382–389. doi: 10.1023/A:1022695819135. [DOI] [PubMed] [Google Scholar]
- 9.Tothfalusi L., Endrenyi L., Midha K. K. Scaling or wider bioequivalence limits for highly variable drugs and for the special case of Cmax. Int. J. Clin. Pharmacol. Ther. 2003;41:217–225. doi: 10.5414/cpp41217. [DOI] [PubMed] [Google Scholar]
- 10.Tothfalusi L., Endrenyi L., Midha K. K., Rawson M. J., Hubbard J. W. Evaluation of the bioequivalence of highly variable drugs and drug products. Pharm. Res. 2001;18:728–733. doi: 10.1023/A:1011015924429. [DOI] [PubMed] [Google Scholar]
- 11.Karalis V., Symillides M., Macheras P. Novel scaled average bioequivalence limits based on GMR and variability considerations. Pharm. Res. 2004;21:1933–1942. doi: 10.1023/B:PHAM.0000045249.83899.ae. [DOI] [PubMed] [Google Scholar]
- 12.Health Canada, Ministry of Health, Guidance for Industry: Conduct and Analysis of Bioavailability and Bioequivalence Studies—Part A: Oral Dosage Formulations Used for Systemic Effects. 1992.
- 13.Committee for Proprietary Medicinal Products (CPMP), the European Agency for the Evaluation of Medicinal Products (EMEA). Note for Guidance on the Investigation of Bioavailability and Bioequivalence. 2001.
- 14.Japan National Institute of Health, Division of Drugs. Guideline for Bioequivalence Studies of Generic Drug Products. 1997.
- 15.S. H. Haidar. Bioequivalence of Highly Variable Drugs: Regulatory Perspectives. Food and Drug Administration Advisory Committee for Pharmaceutical Science Meeting, April 14, 2004. http://www.fda.gov/ohrms/dockets/ac/04/slides/4034S2_07_Haidar_files/frame.htm (Accessed 03/20/08).
- 16.S. H. Haidar. Evaluation of a Scaling Approach for Highly Variable Drugs. Food and Drug Administration Advisory Committee for Pharmaceutical Science Meeting, October 6, 2006. http://www.fda.gov/ohfdrms/dockets/ac/06/slides/2006-4241s2_4_files/frame.htm (Accessed 03/20/08).
- 17.B. M. Davit. Highly variable drugs—bioequivalence issues: FDA proposal under consideration. Meeting of FDA Committee for Pharmaceutical Science, October 6, 2006. http://www.fda.gov/ohrms/dockets/ac/06/slides/2006-4241s2_5.htm (accessed 3/12/2007).
- 18.S. H. Haidar. BE for Highly Variable Drugs—FDA Perspective. AAPS Workshop on BE, BCS and Beyond. May 22, 2007. http://www.aapspharmaceutica.com/meetings/files/90/22Haidar.pdf (Accessed 03/20/08).
- 19.Hyslop T., Hsuan F., Holder D. J. A small sample confidence interval approach to assess individual bioequivalence. Stat. Med. 2000;19:2885–2897. doi: 10.1002/1097-0258(20001030)19:20<2885::AID-SIM553>3.0.CO;2-H. [DOI] [PubMed] [Google Scholar]
- 20.Schuirmann D. J. A comparison of the two one-sided tests procedure and the power approach for assessing the equivalence of average bioavailability. J. Pharmacokinet. Biopharm. 1987;15:657–680. doi: 10.1007/BF01068419. [DOI] [PubMed] [Google Scholar]
- 21.Hauck W. W., Parekh A., Lesko L. J., Chen M.-L., Williams R. L. Limits of 80%–125% for AUC and 70%–143% for Cmax, What is the impact on bioequivalence studies. Int. J. Clin. Pharmacol. Ther. 2001;39:350–355. doi: 10.5414/cpp39350. [DOI] [PubMed] [Google Scholar]


