Abstract
Oxidative damage to 5-methylcytosine in DNA, followed by deamination, yields thymine glycol (Tg), 5,6-dihydroxy-5,6-dihydrothymine, mispaired with deoxyguanosine. The structure of the 5R Tg·G mismatch pair has been refined using a combination of simulated annealing and isothermal molecular dynamics calculations restrained by NMR-derived distance restraints and torsion angle restraints in 5′-d(G1T2G3C4G5Tg6G7T8T9T10G11T12)-3′·5′-d(A13C14A15A16A17C18G19C20G21C22A23C24)-3′; Tg = 5R Tg. In this duplex the cis-5R,6S:trans-5R,6R equilibrium favors the cis-5R,6S epimer [Brown, K. L., Adams, T., Jasti, V. P., Basu, A. K., and Stone, M. P. (2008) J. Am. Chem. Soc. 130, 11701−11710]. The cis-5R,6S Tg lesion is in the wobble orientation such that Tg6O2 is proximate to G19 N1H and Tg6 N3H is proximate to G19O6. Both Tg6 and the mismatched nucleotide G19 remain stacked in the helix. The Tg6 nucleotide shifts toward the major groove and stacks below the 5′-neighbor base G5, while its complement G19 stacks below the 5′-neighbor C20. In the 3′-direction, stacking between Tg6 and the G7·C18 base pair is disrupted. The solvent-accessible surface area of the Tg nucleotide increases as compared to the native Watson−Crick hydrogen-bonded T·A base pair. An increase in T2 relaxation rates for the Tg6 base protons is attributed to puckering of the Tg base, accompanied by increased disorder at the Tg·G mismatch pair. The axial vs equatorial conformation of the Tg6 CH3 group cannot be determined with certainty from the NMR data. The rMD trajectories suggest that in either the axial or equatorial conformations the cis-5R,6S Tg lesion does not form strong intrastrand hydrogen bonds with the imidazole N7 atom of the 3′-neighbor purine G7. The wobble pairing and disorder of the Tg·G mismatch correlate with the reduced thermodynamic stability of the mismatch and likely modulate its recognition by DNA base excision repair systems.
The common thymine oxidation product in DNA, 5,6-dihydroxy-5,6-dihydrothymine, known as thymine glycol (Tg)1, is formed by exposure to ionizing radiation, as well as a variety of chemical oxidizing agents (1,2). Tg is also formed by oxidation of 5-methylcytosine to 5-methylcytosine glycol, followed by hydrolytic deamination (3,4). Once formed, the C5 and C6 atoms in Tg are chiral, and thus Tg exists in DNA as two diastereomeric pairs of epimers, the 5R cis, trans pair (5R,6S;5R,6R) and the 5S cis, trans pair (5S,6R; 5S,6S) (5−7) (Chart 1). The 5R pair is more abundant and more stable (6). Tg has been detected in animal and human urine (8,9). It is estimated that human cells repair hundreds of thymine glycol lesions per day (8,9).
Chart 1. Interconversion of the cis-5R,6S- and trans-5R,6R-Tg Lesions.
For both the 5R and 5S pairs of epimers, the cis isomers predominate at the nucleoside level (6). For the 5R pair of epimers, the rate of epimerization at the nucleoside level is 5.8 × 10⁻³ min−1(6). In duplex DNA, the cis−trans equilibrium of the 5R Tg isomer is modulated by the identity of the complementary base (10). When the 5R Tg isomer is base paired opposite dA in the 5′-GTgG-3′ sequence, a 7:3 cis (5R,6S):trans (5R,6R) mixture exists at equilibrium at 25 °C (10). However, when the 5R Tg lesion is mismatched with dG in the same sequence, only the cis (5R,6S) epimer is observed by NMR (10). The structure of the 5R Tg lesion has been examined in the 5′-ATgA-3′ sequence, paired opposite dA (11). This study concluded that Tg induced a localized structural perturbation and, based upon calculation of solvent-accessible surface area, concluded that Tg was partially extrahelical (11). It was also reported that the structure of the 5R Tg lesion in the 5′-GTgC-3′ sequence was disordered (12). Neither of the earlier studies (11,12) considered the cis−trans epimerization of the Tg lesion.
In the present work, the 5R Tg lesion has been incorporated site-specifically into 5′-d(G1T2G3C4G5Tg6G7T8T9T10G11T12)-3′·5′-d(A13C14A15A16A17C18G19C20G21C22A23C24)-3′, forming the mismatched Tg6·G19 base pair. This corresponds to the situation resulting from oxidative damage to 5-methylcytosine in DNA, followed by deamination to form Tg. In this oligo-deoxynucleotide when the 5R Tg lesion is mismatched with dG, only the cis (5R,6S) epimer is observed (10), thus facilitating structural refinement. The structure of the cis-5R,6S Tg lesion in the Tg·G mismatch pair reveals that both Tg6 and the mismatched G19 remain inserted into the duplex such that the Tg6 base assumes a wobble orientation with G19 and shifts toward the major groove. The solvent-accessible surface area of the Tg6 nucleotide increases as compared to the native T·A base pair. An increase in T2 relaxation rates for the Tg6 base protons suggests puckering of the Tg base, accompanied by increased disorder at the Tg6·G19 mismatch pair. The cis-5R,6S Tg lesion does not form strong hydrogen bonds to the 3′-neighbor purine G5 N7 (13). The wobble orientation and disorder of the Tg6·G19 mismatch likely contribute to its recognition by base excision repair.
Materials and Methods
Sample Preparation
The oligodeoxynucleotides 5′-d(GTGCGTGTTTGT)-3′ and 5′-d(ACAAACGCGCAC)-3′ were purchased from the Midland Certified Reagent Co. (Midland, TX). The oligodeoxynucleotide 5′-d(GTGCGTgGTTTGT)-3′, containing the 5R Tg lesion, was synthesized as reported (14). Oligodeoxynucleotides were purified by reverse-phase HPLC using a Phenomenex Gemini C-18 column (250 mm × 10 mm). The mobile phase was 0.1 M ammonium formate (pH 7.0) with a flow rate of 2 mL/min; elution was performed using a linear gradient from 6% to 30% CH3CN over 25 min. Oligodeoxynucleotide concentrations were measured by UV absorbance at 260 nm. Complementary oligodeoxynucleotides were annealed in 20 mM sodium phosphate buffer, containing 100 mM NaCl, 10 mM NaN3, and 50 μM Na2EDTA (pH 7.0), then heated to 70 °C for 10 min and subsequently allowed to cool slowly to ambient temperature.
Mass Spectrometry
The 5R Tg modified oligodeoxynucleotides were characterized by mass spectrometry using a Voyager-DE MALDI-TOF spectrometer (PerSeptive Biosystems, Inc., Foster City CA). Samples were suspended in a matrix consisting of 0.5 M 3-hydroxypicolinic acid in 1:1 CH3CN:H2O and spotted onto sample plates. Mass spectra were recorded in the reflector mode using a laser attenuation setting of 3030 units. The accelerating voltage was 20 kV, with a grid voltage of 85.0%, guide wire voltage of 0.050%, and a delay of 100 ns. The mass spectra were averaged from 256 scans.
Capillary Gel Electrophoresis
CGE was performed using approximately 1 nmol of desalted sample. The gels and buffers were prepared using Beckman Coulter ssDNA 100-R kits (Beckman-Coulter, Inc., Fullerton, CA). An injection voltage of 10.0 kV was used for 8 s, followed by a separation voltage of 14.1 kV for 35 min, using a 33 cm capillary. The electropherogram was recorded at λ 254 nm. Elution times were referenced to an internal standard (Beckman “Orange G” product number 241524).
NMR Spectroscopy
NMR experiments were performed at a 1H frequency of 800 MHz. The duplex concentration was 1.5 mM, and the samples were suspended in 20 mM sodium phosphate, 100 mM NaCl, and 50 µM Na2EDTA (pH 7.0). To examine nonexchangeable protons, samples were suspended in 99.996% D2O. The nonexchangeable proton experiments were performed at 30 ± 0.5 °C. NOESY spectra were recorded using States−TPPI phase cycling. Typical acquisition parameters were 512 real data points in the d1 dimension with 32 scans per FID, 2K real data points in the d2 dimension, sweep width of 10 ppm, and a relaxation delay of 2.0 s. The residual water resonance was suppressed using presaturation. For observation of exchangeable protons, samples were suspended in 9:1 H2O:D2O. The experiments were performed at 5 ± 0.5 °C. NOESY spectra were obtained using watergate H2O suppression (15) and a sweep width of 20 ppm. The binomial water suppression delay of 188 ms at 800 MHz avoided suppression of amino resonances. The T1 spin−lattice relaxation experiments were collected using the inversion recovery method (16,17). The inversion recovery profile for T1 fitting included delay times of 0.01, 0.05, 0.1, 0.25, 0.5, 1, 2, 3, 4, 5, 7, and 10 s. The T2 transverse relaxation experiments were collected using the Carr−Purcell−Meiboom−Gill (CPMG) method (16,17). The CPMG spin echo time increment profile included values of 4, 6, 8, 10, 12, 14, 16, 18, and 20 s. 1H spectra were referenced to internal 3-(trimethylsilyl)propionic-2,2,3,3-d4 acid sodium salt (3-TMSP). The programs XWINNMR (version 3.5, patch level 6; Bruker Inc., Billerica, MA) and NMRPipe (18) were used for data processing. Skewed sine-bell-squared apodization functions were used.
Distance Restraints
NOE intensities were determined from integration of peak volumes by a Gaussian fit function using the program SPARKY v3.11 (19). Experimentally determined intensities were combined with intensities generated from complete relaxation matrix analysis of a B-form starting structure of DNA to produce a hybrid intensity matrix (20,21). The program MARDIGRAS (22−24), using the RANDMARDI function, was used to iteratively refine the hybrid intensity matrix and to optimize the agreement between the experimental and calculated intensities. Calculations at mixing times of 80, 150, 200, and 250 ms were each run at isotropic correlation times of 2, 3, 4, and 5 ns with a canonical B-form starting structure, producing 16 sets of distances. Each set was a product of 50 RANDMARDI iterations. A refined structure taken from initial rounds of simulated annealing rMD calculations was used as a starting structure for the second round of MARDIGRAS interproton distance calculations. The results were indexed to short- and long-range distances typical for both A- and B-form DNA as a means to assess the accuracy of resultant distance sets. The data that best matched canonical DNA distances were averaged and used in subsequent rMD calculations. The distance restraints were divided into five categories indicative of the restraint confidence level. In addition, empirical distance restraints were used to define hydrogen bonding of complementary bases. Hydrogen-bonding restraints were not used for the Tg 6·G19 or G5·C20 base pairs because wobble or Watson−Crick hydrogen bonding could not be confirmed by NMR experiments (10).
Torsion Angle Restraints
Deoxyribose pseudorotation was determined by fitting 3J1H coupling constants for deoxyribose protons by amplitude-constrained multiplet evaluation (ACME) of fully relaxed COSY data (25). Electronegativity of substituent (EOS) Karplus curves were generated and converted to phase angle space assuming a maximum pucker amplitude (Φ) of 44 (26,27). J1′2′, J1′2′′, and J1′3′ were fit to the curve to determine phase angle ranges (r) for deoxyribose rings. The sugar pseudorotation and amplitude ranges were converted to upper and lower bound restraints for the five dihedral angles ν0 to ν4. Deoxyribose pucker conformations were confirmed to be N or S by an approximate measurement of the mol fraction of sugar pucker in the S configuration (XS) determined from the sum of J1′2′ and J1′2′′(27). Residues that had less than 50% XS or indicated potential for the C3′ endo conformation from EOS Karplus curves were constrained such that they were allowed to explore both N and S conformations during rMD calculations (ρ = 0−210). Residues that had XS greater than 50% were restrained such that ρ = 125−210. Backbone torsion angles were restrained with experimental data where available. The remaining angles were restrained based on canonical A-form/B-form ranges.
Tg Parametrization
Partial charges for the Tg nucleotide were generated using GAUSSIAN 03 (28). Geometry optimization and molecular electrostatic potential refinement were performed using the Hartree−Fock method with the 6-31G* basis set (10). Potential points were calculated with a density of six points per unit area in the electrostatic potential (ESP) fit. Calculations were performed with a fixed net charge of −1. Convergence was verified by frequency analysis. The ESP output from the GAUSSIAN calculation was formatted using the program ANTECHAMBER (29).
Structural Refinement
Thirty starting structures of the oligodeoxynucleotide duplex containing the Tg6·G19 mismatch were generated using NAB (Nucleic Acid Builder) (30). These were energy minimized with the steepest descent algorithm for 100 steps and the conjugate gradient algorithm for 900 steps using the SANDER module of AMBER 9 (29). During energy minimization, heavy atoms of the nucleic acid bases were held fixed. The coordinate and topology files were generated with xLEaP (29) using ff99 parameters (31). The restraint energy function included terms that defined distance and dihedral restraints as square-well potentials (32). The generalized Born solvent model was used for simulated annealing, with a salt concentration of 0.2 mM (33,34). Twenty picosecond simulated annealing rMD simulations were conducted with a nonbonded interaction cutoff at 15 Å. The structure coordinates were recorded every 1 ps. Temperature was maintained using the Berendsen algorithm (35). The protocol utilized a starting temperature of 600 K. From 5 to 18 ps the temperature was decreased to 100 K. The temperature was decreased to 0 K during the final 2 ps of the simulations. A time constant of 0.4 ps was used for heat bath coupling during the first 0.5 ps of the simulation. From 0.5 to 18 ps the heat bath coupling was decreased to 4 ps; from 18 to 19 ps the coupling was increased to 1 ps. During the final 19 to 20 ps the coupling was increased to 0.05 ps. During the first 3 ns the relative weights of the NMR restraint energy terms were increased from 0.1 to 1; this was maintained for the remaining 17 ns.
The average structure from the final round of simulated annealing calculations was neutralized with the addition of 24 sodium ions and placed in a truncated octahedral TIP3P water box with periodic boundaries at a distance of 8 Å from the solute. Twenty-two sodium ions were restrained to the backbone with a lower bound of 3.0 Å and an upper bound of 8.0 Å while the remaining two sodium ions were not restrained. The solvated system was energy minimized using 500 steps of the steepest descent algorithm followed by 500 steps of the conjugate gradient algorithm at constant volume, with the solute held fixed by positional restraints. Next, the system was energy minimized using 2500 steps of the conjugate gradient algorithm with no positional restraints at a constant volume. The system was subsequently heated to 300 K over 100 ps; the weight of the NMR and empirical restraints was slowly increased during the heating period. A 10 ns rMD simulation at 300 K was then performed. Throughout the equilibration and production periods, the temperature was held constant using the Langevin thermostat (36,37) with a collision frequency of 1 ps−1. Electrostatic interactions were treated with the particle mesh Ewald (PME) method (38). A 15 Å cutoff for nonbonded interactions was used. Bond lengths involving hydrogen were held fixed using the SHAKE algorithm (39).
Structural Analysis
The heavy atoms of the output structures from the isothermal rMD calculations were subjected to pairwise rmsd comparisons using SUPPOSE. Trajectories were analyzed with PTRAJ. Complete relaxation matrix analysis (CORMA, v.4) (20,21) was performed on the structural ensembles, assuming equal occupancy, to determine agreement with experimental 1H NOESY data. Helicoidal analysis was performed using the program CURVES (40) on an average of each structural ensemble. Graphic representations of structures were rendered using the program CHIMERA (41). Solvent-excluded and solvent-accessible surface areas of nucleotides were measured using the program Maximal Speed Molecular Surface (MSMS) (42). A series of calculations employing probe radii of 1.5, 2.5, 3.5, and 4.5 Å were used. The percentages of solvent-accessible surfaces were rendered as a function of probe radii.
Results
Characterization of the Tg·G Mismatch Pair
The modified dodecamer 5′-d(GTGCGTgGTTTGT)-3′, Tg = 5R Tg, was subjected to mass spectrometric analysis, which yielded the anticipated molecular ion peak with mass 3732 (m/z). Further capillary gel electrophoretic and HPLC analyses showed that the modified oligodeoxynucleotide consisted of a chromatographically separable species of high purity. NMR data were collected upon sample preparation and were repeated after 4 weeks; changes in the spectrum were not observed, suggesting that the sample had achieved equilibrium with respect to the cis-5R,6S:trans-5R,6R equilibrium. The cis-5R,6S epimer was favored, with the trans-5R,6R epimer remaining below the level of detection (10).
NMR Spectroscopy
(a) Nonexchangeable DNA Protons
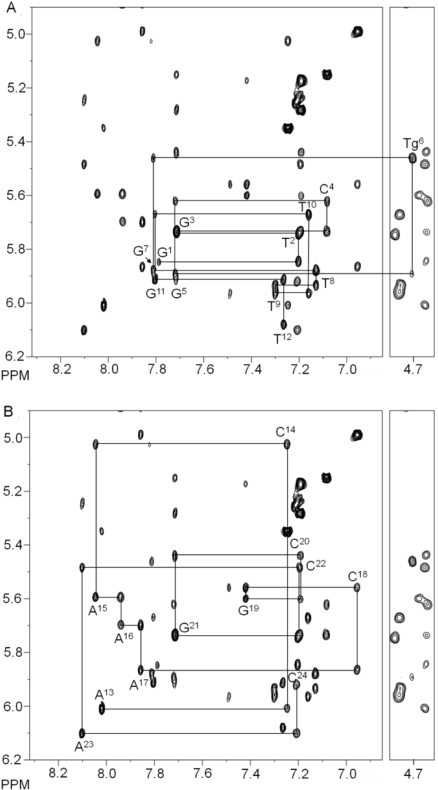
The NMR resonances for the oligodeoxynucleotide duplex containing the Tg·G mismatch pair were assigned using standard strategies (43,44) (Figure 1). The deoxyribose protons were assigned from a combination of COSY and NOESY data. With the exception of several of the H4′ protons, and the stereotopic assignments of the H5′ and H5′′ sugar protons, assignments were made unequivocally.
Figure 1.
Sequential NOESY assignments of purine H8 and pyrimidine H6 protons to deoxyribose H1′ protons for the duplex containing the Tg6·G19 base pair. (A) The modified strand of the duplex containing the Tg6·G19 base pair. (B) The complementary strand of the duplex containing the Tg6·G19 base pair. The intranucleotide aromatic to H1′ cross-peaks are labeled.
(b) Exchangeable DNA Protons
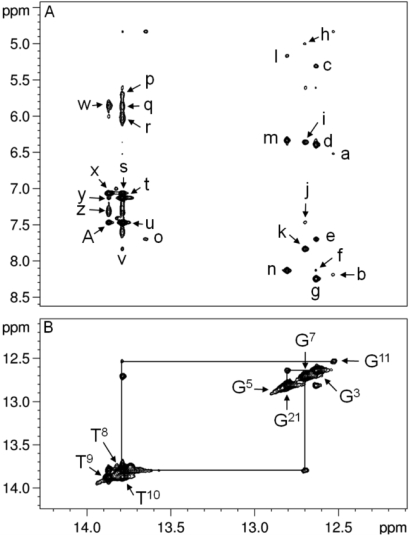
At the mismatched Tg6·G19 base pair, the Tg6 N3H imino resonance was not identified (Figure 2). This was attributed to rapid exchange with solvent. The assignments of the remaining Watson−Crick hydrogen-bonded imino and amino protons were made using standard methods (45). The G5 N1H imino resonance was broad at 5 °C and disappeared when the temperature was increased to 15 °C. In contrast, for the unmodified sample, the G5 N1H imino resonance was sharp and was observed at temperatures as high as 40 °C (10). There was no cross-peak between the broad G5 N1H resonance and G21 N1H, located at base pair C4·G21. This was attributed to its exchange with solvent. The imino resonances for base pairs T2·A23, G3·C22, C4·G21, G7·C18, T8·A17, T9·A16, T10·A15, and G11·C14 were observed. The imino resonances for the terminal base pairs G1·C24 and T12·A13 were not observed, attributed to exchange broadening with water.
Figure 2.
(A) Expanded plot showing NOEs from the imino protons to amino protons for the duplex containing the Tg6·G19 base pair. The cross-peaks are assigned as follows: a, G11N2H2→G11 N1H; b, C14N4H2→G11 N1H; c, C22 H5→G3 N1H; d, G3N2H2→G3 N1H; e, A23 H2→G3 N1H; f, C4N4H2→G3 N1H; g, C22N4H2→G3 N1H; h, C18 H5→G7 N1H; i, G7N2H2→G7 N1H; j, A17 H2→G7 N1H; k, C18N4H2→G7 N1H; l, C4 H5→G21 N1H; m, G21N2H2→G21 N1H; n, C4N4H2→G21 N1H; o, A23 H2→T2 N3H; p, A17N6H2→T8 N3H; q, A16N6H2→T8 N3H; r, A15N6H2→T10 N3H; s, A16 H2→T10 N3H; t, A15 H2→T10 N3H; u, A17 H2→T8 N3H; v, C18N4H2→T8 N3H; w, A16N6H2→T9 N3H; x, A16 H2→T9 N3H; y, A15 H2→T9 N3H; z, A16N6H1→T9 N3H; A, A17 H2→T9 N3H. (B) Expanded plot showing the sequential NOE connectivity for the imino protons of the duplex containing the Tg6·G19 base pair. The data were collected at 800 MHz at a 250 ms mixing time and a temperature of 7 °C.
(c) Tg Protons
Analysis of NOESY data obtained at multiple mixing times did not reveal chemical exchange cross-peaks for either the Tg6 CH3 and Tg6 H6 protons, consistent with the conclusion that only one epimer was significantly populated in the sample (10) (Figure 3). For the cis-5R,6S configuration, Tg6 H6 and Tg6 CH3 are spatially proximate, yielding a strong Tg6 H6→Tg6 CH3 NOE even at the short mixing time of 150 ms. Likewise, the G5 H1′→Tg6 H6 and G5 H8→Tg6 H6 NOEs were diagnostic of the cis-5R,6S configuration. The Tg6 H3′ and Tg6 H6 resonances were observed at 4.53 and 4.70 ppm, respectively. The Tg6 CH3 protons exhibited a chemical shift of 0.91 ppm. A total of 9 NOE cross-peaks were assigned between Tg6 H6 and DNA, and 11 were assigned between Tg6 CH3 and DNA. These restraints used in the rMD calculations are summarized in Table 1.
Figure 3.
NOESY data collected for the duplex containing the Tg6·G19 base pair showing NOEs between Tg6 CH3 and DNA protons. The 800 MHz NMR data were collected at a NOE mixing time of 250 ms. The spectra were collected at 30 °C.
Table 1. NOESY Cross-Peaks between Tg and DNA Protons.
| Tg H6 | G5 H1′, G5 H2′, G5 H2′′, G5 H8, G7 H8 |
| Tg CH3 | G5 H1′, G5 H2′, G5 H2′′, G5 H3′, G5 H4′ |
| Tg H1′ | G5 H1′ |
| Tg H2′ | |
| Tg H2′′ | G7 H8 |
| Tg H3′ | G7 H8 |
| Tg H4′ | G7 H8 |
| Tg H5′ |
Spin−Lattice Relaxation
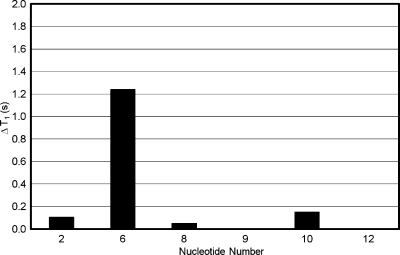
The T1 relaxation times of the T2, T8, T9, T10, and T12 thymine and Tg6 CH3 groups were compared to those of the corresponding unmodified duplex (Figure 4). The T1 relaxation time of Tg6 CH3 was 1.2 s faster than was the corresponding relaxation time in the unmodified T6·G19 context. The Tg6 CH3 relaxed an average of 1.0 s faster than other thymine CH3 groups in the Tg6·G19 duplex.
Figure 4.
Changes in spin−lattice T1 relaxation times of thymine and Tg6 CH3 of Tg·G (◼) relative to unmodified T·A duplex.
Spin−Spin Relaxation
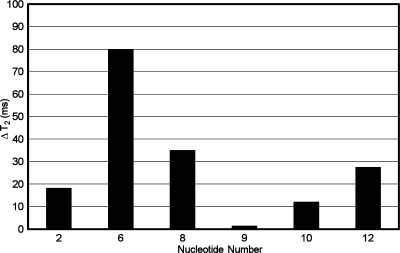
The T2 relaxation times of the T2, T8, T9, T10, and T12 thymine and Tg6 CH3 groups were compared to those of the corresponding unmodified duplex (Figure 5). The Tg6 CH3 of the Tg6·G19 duplex relaxed 80 ms faster than the corresponding CH3 of the unmodified sample. The Tg6 CH3 relaxed an average of 50 ms faster than did other CH3 groups in the Tg6·G19 duplex.
Figure 5.
Changes in T2 relaxation of thymine and Tg6 CH3 of Tg·G (◼) relative to unmodified T·A duplex.
Restrained Molecular Dynamics
The experimental restraints used in the rMD calculations are summarized in Table 2. The potential for interstrand hydrogen bonding between Tg6 and G19 was not enforced with distance restraints during the rMD simulation, consistent with the experimental NMR data showing that the Tg6 N3H and G19 N1H imino resonances were not observed. Thirty starting structures were generated. Fifteen of these had the Tg CH3 group in the axial position relative to the Tg base; in the other half the Tg CH3 group was equatorial. These starting structures exhibited a maximum pairwise rmsd of 4.3 Å. After simulated annealing rMD refinement, all but 2 of the 30 starting trajectories resulted in Tg6 CH3 being in an axial conformation. A representative structure from simulated annealing with an axial Tg6 CH3 was placed in a truncated octahedron TIP3P water box for additional refinement at 300 K.
Table 2. Restraint Summary for Solution Structure Determination.
| resonances | 220 |
| restraints | |
| Watson−Crick | 40 |
| backbone torsion angle | 134 |
| sugar torsion angle | 120 |
| distance | 384 |
| internucleotide | 189 |
| intranucleotide | 195 |
| total restraints | 678 |
| avg restraint per nucleotide | 28 |
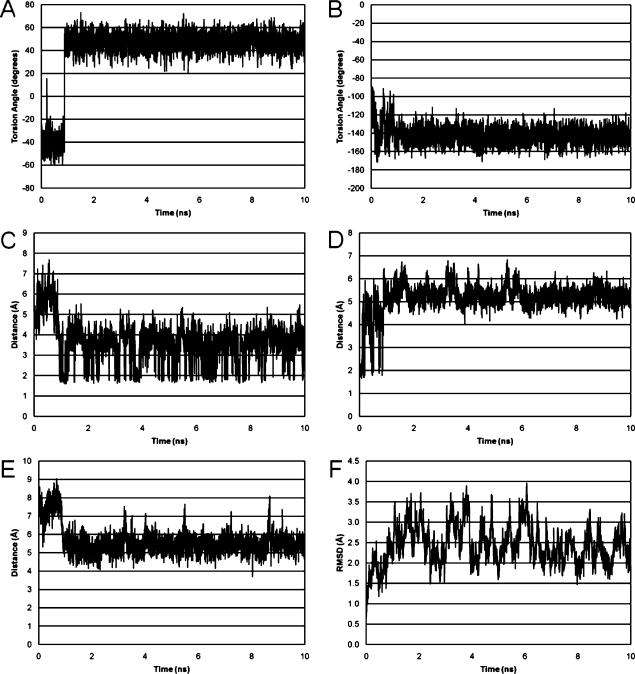
An overall CORMA R1X value of 9.25 × 10⁻² indicated that the input coordinates for explicit solvent rMD calculations were in agreement with NMR distance restraints. At 0.88 ns into the isothermal rMD calculations in explicit solvent, the Tg6 CH3 shifted from the axial orientation to the equatorial conformation and remained in the equatorial conformation for the remainder of the trajectory (Figure 6). The Tg CH3−C5−C6−H6 torsion angle shifted from −40° to 50° (Figure 6, panel A). The glycosyl Tg6 O4′−H1′−N1−C2 torsion angle fluctuated between −100° and −160° during the first 0.88 ns; upon repuckering, the lower limit of fluctuation decreased from −100° and −120° (Figure 6, panel B). To examine the potential for intrastrand hydrogen bonding between the Tg6 hydroxyl groups and G7 N7 (13), the Tg6 HO5→G7 N7 (Figure 6, panel C) and Tg6 HO6→G7 N7 (Figure 6, panel D) distances were tracked during the rMD trajectory; hydrogen bond occupancy was defined as occurring when the hydrogen bond donors and acceptors were within 3.5 Å with an angle cutoff of 120°. During the first 0.88 ns of the rMD trajectory the Tg6 CH3 axial ring pucker resulted in a 6 Å Tg6 HO5→G7 N7 distance and prevented hydrogen bond formation. When Tg6 CH3 reoriented to the equatorial conformation, the Tg6 OH5 became axial and exhibited improved geometry for hydrogen bond formation with G7 N7. The trajectory analysis indicated 16% occupancy for this motif over 10 ns. In contrast, the Tg6 HO6→G7 N7 hydrogen bond was only satisfied during the first 0.88 ns of the simulation when Tg6 CH3 was axial (Figure 6, panel D). Its occupancy was 2.5%. This hydrogen bond induced altered propeller twist at the lesion site. As a measure of base−base opening, the Tg6 N3→G19 N1 distance was monitored during the rMD calculations. During the first 0.88 ns while Tg6 CH3 was in the axial conformation, the distance between Tg6 H3→G19 N1 was approximately 7.5 Å. Upon repuckering the Tg6 H3→G19 H1 distance decreased to approximately 5.5 Å. This indicated that the Tg6·G19 base−base opening decreased upon repuckering to the Tg6 CH3 equatorial conformation and was consistent with helicoidal analysis (Table S1 in the ). The root-mean-square deviation of DNA backbone heavy atoms was approximately 2.5 Å for the simulation (Figure 6, panel F).
Figure 6.
Analysis of selected Tg6 torsion angles and internucleotide distances during the 10 ns rMD trajectories carried out in explicit solvent. (A) The Tg6 CH3−C5−C6−H6 torsion angle. (B) The Tg6 O4′−H1′−N1−C2 torsion angle. (C) The Tg6 HO5→G7 N7 distance. (D) The Tg6 HO6→G7 N7 distance. (E) The Tg6 H3→A19 N1 distance. (F) The rmsd of backbone heavy atoms for the entire duplex.
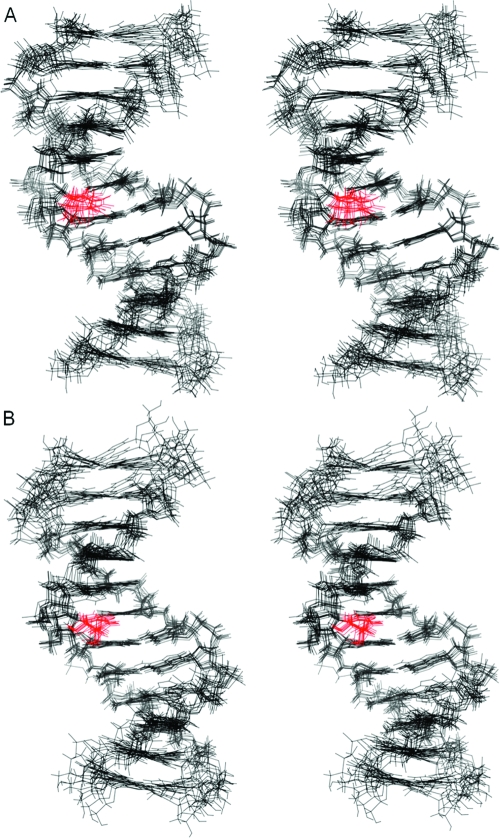
Two ensembles of structures were extracted from the rMD data (Figure 7): one in which the Tg6 CH3 was in the axial conformation was extracted from the trajectory at approximately 120 ps before the axial−equatorial conformational shift; this ensemble had an rmsd value of 0.9 Å for the core six base pairs (PDB ID 2KH7). A second ensemble of structures in which the Tg6 CH3 was in the equatorial conformation was extracted approximately 1 ns after the axial−equatorial conformational shift. The latter ensemble had an rmsd value of 0.8 Å for the core six base pairs (PDB ID 2KH8). Thus, both the axial and equatorial conformations of the Tg6 CH3 group converged to single ensembles of structures.
Figure 7.
Stereoviews of 10 superimposed structures emergent from rMD calculations of the cis-5R,6S-Tg-adducted DNA duplex. (A) An ensemble of structures in which Tg6 CH3 is in the axial conformation (PDB ID 2KH7). (B) An ensemble of structures in which Tg6 CH3 is in the equatorial conformation (PDB ID 2KH8).
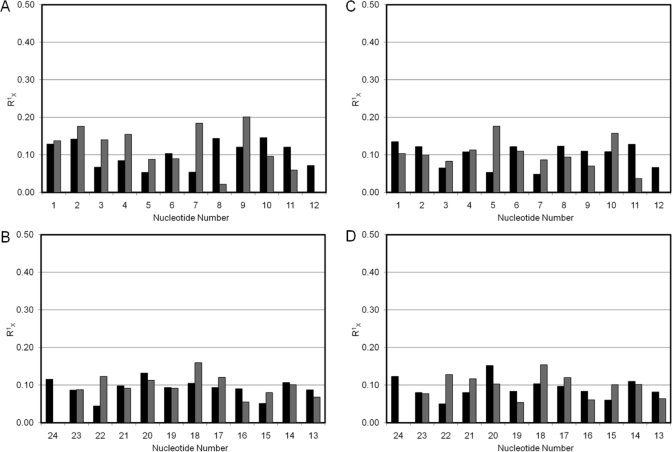
To evaluate the agreement of the two structural ensembles emergent from rMD calculations with the NOESY data, complete relaxation matrix analyses (CORMA, v.4) (20,21) were performed (Figure 8). The calculated sixth root residual R1X values indicated satisfactory agreement between both refined ensembles of structures and the 1H NOESY data. The ensemble with Tg6 CH3 in an axial position had an average R1X value of 1.03 × 10⁻¹ for the entire structure. The Tg6 lesion itself exhibited an R1X value of 8.80 × 10⁻² for interresidue cross-peaks with G5 and 1.04 × 10⁻¹ for intraresidue cross-peaks. The ensemble with Tg6 CH3 in the equatorial position had an average R1X value of 9.96 × 10⁻² for the entire structure. The Tg6 lesion itself exhibited an R1X value of 9.57 × 10⁻² for interresidue cross-peaks with G5 and 1.22 × 10⁻¹ for intraresidue cross-peaks.
Figure 8.
Relaxation matrix analysis of average structures emergent from rMD calculations of the cis-5R,6S-Tg-adducted DNA duplex, calculated using the program CORMA, showing intranucleotide (◼) and internucleotide (◼) values of R1X. (A) The modified strand with Tg6 CH3 in the axial conformation showing (B) the complementary strand with Tg6 CH3 in the axial conformation, (C) the modified strand with Tg6 CH3 in the equatorial conformation, and (D) the complementary strand with Tg6 CH3 in the equatorial conformation.
Refined Structure of the Tg·G Duplex
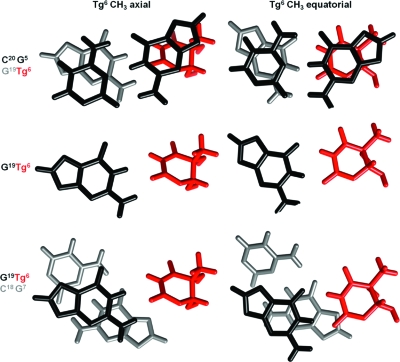
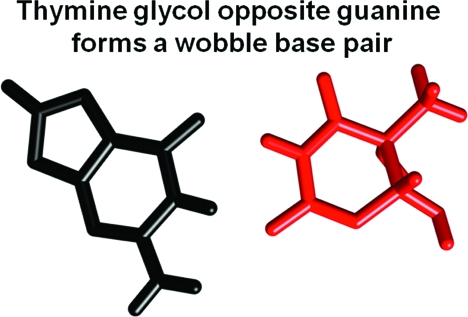
Irrespective of the axial vs equatorial conformation of the Tg6 CH3 group, the cis-5R,6S Tg lesion was positioned in a wobble orientation such that Tg6 O2 was proximate to G19 N1H and Tg6 N3H was proximate to G19 O6 (Figures 9 and 10). The cis-5R,6S Tg lesion shifted toward the major groove. The complementary dG remained in the anti conformation about the glycosyl bond and stacked into the duplex. The cis-5R,6S Tg base stacked below the 5′-neighbor base G5, while its complement G19 stacked below the 5′-neighbor base C20. In the 3′-direction, base stacking between the cis-5R,6S Tg6 and the G7·C18 base pair was disrupted (Figure 10). The base pair roll, stagger, and propeller twist helicoidal parameters were disturbed at the mismatched Tg·G pair. There was also disruption in the base−base stretch, shear, and opening helicoidal parameters. The helicoidal analysis data are provided in Table 2 of the .
Figure 9.
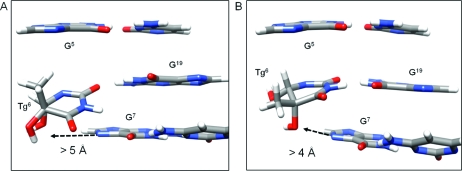
The wobble orientation of Tg6 in the Tg6·G19 mismatch pair does not favor the formation of stabilizing intrastrand hydrogen bonds between the hydroxyl groups of the cis-5R,6S Tg6 lesion and the imidazole ring N7 atom of the 5′-neighbor purine, as determined from analyses of rMD trajectories in explicit solvent. (A) When Tg6 CH3 is in the axial conformation, the distance between the C6 OH group and G7 N7 is >5 Å. (B) When Tg6 CH3 is in the equatorial conformation, the distance between the C6 OH group and G7 N7 is >4 Å.
Figure 10.
Base pair stacking interactions determined from structural refinements using rMD calculations restrained by NMR-derived distance and torsion angles for the cis-5R,6S-Tg-adducted duplex containing the Tg6·G19 mismatch pair. The left panel shows stacking interactions when Tg6 CH3 is in the axial conformation (PDB ID 2KH7). The right panel shows stacking interactions when Tg6 CH3 is in the equatorial conformation (PDB ID 2KH8). In both instances, the Tg6 base shifts toward the major groove, into a wobble orientation with G19 in the complementary strand, but both Tg6 and G19 remain stacked into the duplex.
Solvent-Accessible Surface Area of the Tg Base
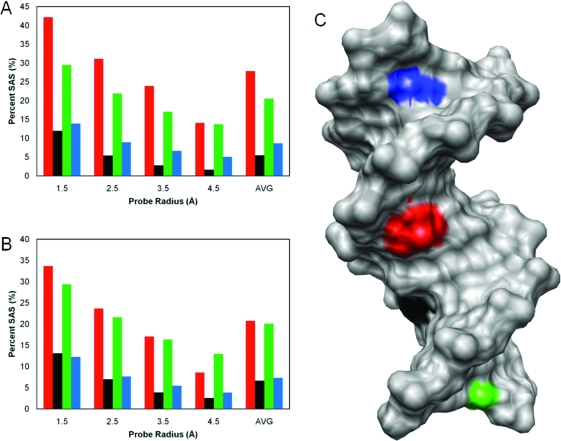
The extent to which the wobble position of cis-5R,6S Tg6 in the Tg6·G19 mismatch pair altered the solvent-accessible surface of the Tg6 lesion was evaluated for both the equatorial and axial conformations of the Tg6 CH3 group (46) (Figure 11). Irrespective of the axial vs equatorial conformation of the Tg6 CH3 group, when the solvent-accessible surface of the Tg6 nucleotide relative to that of a Tg nucleoside was compared with nucleotides A23, T9, and T12, the Tg6 lesion exhibited an increased solvent-accessible surface relative to T9 and A23 but was not as exposed to solvent as the terminal T12 nucleotide. The average accessible surface area of the Tg6 base was 28% when the Tg6 CH3 group was in the axial conformation and 21% when the Tg6 CH3 group was in the CH3 equatorial conformation.
Figure 11.
Measurement of solvent-accessible surface (SAS) areas of the Tg6 nucleotide in the Tg6·G19 mismatch base pair (red) at a series of probe radii using the program MSMS. The SAS was compared to the SAS of the stacked nucleotides T9 (black), T12 (green), and A23 (blue). (A) Results for the structure with Tg6 CH3 in an axial orientation. (B) Results for the structure with Tg6 CH3 in an equatorial orientation. (C) The solvent-excluded (SES) surface rendering of a full duplex indicates the locations of T9 (black), T12 (green), and A23 (blue).
Discussion
Normally in duplex DNA thymine is paired opposite adenine. Consequently, oxidative damage to thymine results in the formation of Tg lesions opposite adenines in genomic DNA. However, when 5-methylcytosine is oxidatively damaged, forming 5-methylcytosine glycol, facile hydrolytic deamination of the latter yields Tg mismatched with G in duplex DNA (3). Since >70% of cytosines in the 5′-CpG-3′ sequence context are believed to be methylated in mammalian cells (3), the formation of Tg arising from oxidative damage to 5-methylcytosine is anticipated to be biologically significant. If not recognized and repaired by the cell, the Tg·G mismatch is anticipated to result in a C5-Me→T mutation. Consequently, the structure of the Tg·G mismatch is of considerable interest, particularly with regard to its recognition by base excision repair enzymes (47). The base excision repair of Tg in mammals is mediated by at least two DNA N-glycosylase/AP lyases that are influenced by the nature of the diastereoisomer of dTg, the rate of cis−trans epimerization of each diastereoisomer, and the identity of the complementary purine base (14).
Structure of the Tg6·G19 Mismatch Pair
The cis-5R,6S Tg base stacks into the duplex and assumes the wobble position opposite G19 (Figure 10), similar to the unmodified T·G mismatch pair (48,49). Tg6 shows poor stacking interactions with 3′-neighbor base pair G7·C20. The structural perturbation is localized to base pairs G5·C20, Tg6·G19, and G7·C18. The observation that there is no disruption of sequential NOE connectivity for either the complementary strand or the modified strand (Figure 1) suggests that wobble pair orientation involving the nonplanar Tg6 base is accommodated with minimal distortion of the helical backbone at the lesion site (10). The wobble orientation is reflected in perturbations in base pair shear, opening, stagger, and stretch (Figures 9 and 10; Table S1 in the ). Despite being oriented in the wobble position, neither the Tg6 N3H imino or the G19 N1H imino resonances are observed in the 1H NMR spectrum (Figure 2) (10), which is attributed to their rapid exchange with solvent. Furthermore, thermodynamic measurements indicated that the Tg6·G19 base pair exhibited a 13 °C decrease in thermal melting temperature and exhibited a 3 kcal/mol ΔΔG value. These effects were attributed to enthalpy-driven reductions in duplex stability (10). The unmodified T·G mispair also exhibits reduced stability (50).
In duplex DNA, the axial conformation of the Tg6 CH3 group in the cis-5R,6S Tg lesion orients it in the 5′ direction in the major groove, facing toward base pair G5·C20, whereas in the equatorial conformation, steric interactions in the 5′-direction between the Tg6 CH3 and G5 are reduced (Figure 9). Quantum mechanical calculations performed on the cis-5R,6S Tg base predict that the axial conformation is favored (10), and this has been observed in the crystal structure of the nucleoside (51). We proposed that in the Tg6·G19 mismatch steric interaction between the axial conformation of the Tg6 CH3 and the 5′-neighboring G5 would be reduced by wobble pairing (10). The present data show that in this mismatch pair the Tg6 nucleotide shifts to the wobble orientation opposite G19 (Figure 10), but the determination of axial vs equatorial conformations of the Tg6 CH3 group remains equivocal: both conformations are observed in the rMD calculations and both show agreement with the NOE data (Figure 8). However, the axial conformation of the Tg6 CH3 group places it proximate to the major groove G5 H8 proton of the G5·C20 base pair (Figures 9 and 10). Significantly, in the crystal structure of the RB69 polymerase involving a template containing the cis-5R,6S Tg lesion and an incoming dATP nucleotide, the Tg CH3 group remained in the axial conformation, consistent with the nucleoside data (51), despite hindering stacking of the adjacent 5′-template guanine (52). In this Tg6·G19 mismatch the cis-5R,6S Tg lesion does perturb the 5′-neighbor base pair G5·C20. The imino resonance attributed to base pair G5·C20 broadens due to solvent exchange (Figure 2) and disappears from the spectrum ∼35 °C lower as compared to the corresponding unmodified duplex (10). The observation that the rMD trajectories yield ensembles of structures in which the Tg6 CH3 was in either the axial or equatorial conformations (Figure 7) suggests that both conformers of the Tg6 ring may be populated in the Tg6G19 mismatch and that while shifting Tg6 to the wobble orientation probably reduces steric interference between the axial conformation of the Tg6 CH3 group with the 5′-neighbor base pair G5·C20, the conformational dynamics of the Tg6 lesion remain disordered at this mismatch site. The modest occupancies of the Tg6 OH6 to G7 N7 hydrogen bond, associated with the axial conformation of the Tg6 CH3 group, and the Tg6 OH5 to G7 N7 hydrogen bond, associated with the equatorial conformation of the Tg6 CH3 group, suggest that intrastrand hydrogen bond formation between the Tg C6 hydroxyl and the N7 position of the 3′ purine (13) does not particularly stabilize either the axial or equatorial conformations of the Tg6 base in this mismatched pair (Figure 9). Calculations of solvent-accessible surfaces (Figure 11) indicate that Tg is more exposed to solvent in the Tg6·G19 mismatch pair, as compared to a Watson−Crick T·A base pair. This is in agreement with the findings of Kung and Bolton (11) on the basis of their solvent-accessible surface area calculations in the 5′-ATgA-3′ sequence when the 5R Tg lesion was placed opposite dA. It is consistent with the wobble orientation of Tg6, which shifts the modified base toward the major groove as compared to a canonical T·A base pair. However, it is important to note that in the wobble orientation the Tg6 lesion does remain stacked into the duplex and it is not flipped out of the helix and into the major groove (Figure 10).
Dynamics of the Tg6·G19 Mismatch Pair
The formation of the wobble base pair results in increased disorder at the Tg6·G19 mismatch. The T2 spin−spin relaxation data are indicative of an increase in transverse relaxation rate for Tg6 CH3 as compared to unmodified thymine CH3 protons (Figure 4). This is attributed to puckering of the Tg6 six-membered ring between axial and equatorial conformations of the Tg6 CH3 group. However, the possibility of increased backbone and deoxyribose dynamics occurring in tandem with the puckering of the Tg ring cannot be excluded (50,53,54). The shift of the Tg6 base further toward the major groove, accompanied by disruptions in hydrogen bonding at the modified base pair and its 5′-neighbor G5·C18 and accompanied by poor stacking interactions with 3′-neighbor base pair G7·C20 (Figure 10), contributes to the reduced thermal stability of the mismatch (10) and probably contributes to increased disorder at the Tg6·G19 mismatch.
Structure−Activity Relationships
If not repaired, the 5R Tg lesion is generally lethal to cells (55−59), although several DNA polymerases lacking 3′→5′ exonuclease activity do bypass the 5R Tg lesion with limited efficiencies (13,60,61). The bypass of Tg by Y-family DNA polymerases is stereospecific, with pol η bypassing the 5R lesion more efficiently (62) and pol κ bypassing the 5S lesion more efficiently (63). While the Tg lesion is a substrate for the UvrABC NER repair system of Escherichia coli(64) and is excised from DNA in vitro by human NER enzymes (65), it is primarily recognized as a substrate for base excision repair, both in E. coli and in mammalian cells (49). In E. coli, BER of this lesion is initiated by endonuclease III (Nth) (66) and endonuclease VIII (Nei) (67). Yeast (68), mammalian (69,70), and human orthologues (71−73) of Nth have been characterized. Likewise, human orthologues of Nei have been characterized (74,75). The human hNTH1 exhibits a 13:1 preference for excising the 5R epimer, whereas hNEIL1 (74,76) shows a 1.5:1 preference for excising the 5R epimer (77). Similar observations have been made for prokaryotic, yeast, and murine glycosylases (78).
Ocampa-Hafalla et al. (14) reported that, in contrast to hNth1, base excision repair of 5R Tg by hNEIL1 depends upon the identity of the opposing base, with Tg·G pairs being excised much more rapidly than Tg·A pairs. This is significant because when 5-methylcytosine is oxidatively damaged, forming 5-methylcytosine glycol, hydrolytic deamination yields Tg mismatched with dG (3). Modeling and dynamics studies suggest that good substrates for hNEIL1 possess in common a pyrimidine-like ring and hydrogen bond donor−acceptor properties, allowing them to be accommodated within the enzyme’s binding pocket (79). The present structural data suggest two reasons why hNEIL1 preferentially excises 5R Tg lesions from the Tg·G pair, both based upon studies with the uracil DNA glycosylase enzyme, which conclude that it detects uracil as it emerges from the helix due to intrinsic thermal breathing motions in DNA, as opposed to active participation by the enzyme (80). In this regard, the wobble orientation of the cis-5R,6S Tg6 base in the Tg·G pair shifts it toward the major groove, which is reflected in an increased solvent-accessible surface (Figure 11). While the 5R Tg lesion remains stacked into the helix and is not flipped out into the major groove, the wobble orientation is accompanied by poorer stacking with the 3′-neighbor base pair G7·C20 (Figure 10). Thus, it seems likely that the wobble orientation reduces the thermal barrier for intrinsic breathing of the lesion, thus facilitating the “flipping out” mechanism associated with the BER process. In support of this notion, the present data are indicative of increased structural disorder at the lesion site, reflected in the T2 spin−spin relaxation data (Figure 4) accompanied by disruptions in hydrogen bonding at the modified base pair and its 5′-neighbor G5·C18. Thus, it seems reasonable that the rate of intrinsic thermal breathing is increased for the cis-5R,6S Tg6 when paired opposite guanine, as has been reported for the unmodified G·T mismatch pair (54). It will now be of interest to compare the structure of the cis-5R,6S Tg6 lesion when paired opposite guanine to that of the same lesion paired opposite adenine.
Summary
Oxidative damage to 5-methylcytosine in DNA, followed by deamination, yields Tg mispaired with guanine. In this duplex containing the cis-5R,6S Tg lesion mismatched with G, the mismatched pair exists in the wobble orientation such that Tg6 O2 is proximate to G19 N1H and Tg6 N3H is proximate to G19 O6. Both Tg6 and the mismatched nucleotide G19 remain stacked in the helix. The Tg6 nucleotide shifts toward the major groove and stacks below the 5′-neighbor base G5, while its complement G19 stacks below the 5′-neighbor C20. In the 3′-direction, stacking between Tg6 and the G7·C18 base pair is disrupted. The solvent-accessible surface area of the Tg nucleotide increases as compared to the native T·A base pair. An increase in T2 relaxation rates for the Tg6 base protons is attributed to puckering of the Tg base, accompanied by increased disorder at the Tg6·G19 mismatch pair. The wobble pairing and disorder of the Tg·G mismatch correlate with the reduced thermodynamic stability of the mismatch and likely modulate its recognition by DNA base excision repair systems.
Acknowledgments
Dr. Markus Voehler and Dr. Don Stec assisted with NMR spectroscopy. We thank Dr. Nicholas Uylanov and Dr. Jarrod A. Smith for guidance on structural refinement. We also thank Drs. Thomas M. and Constance M. Harris for constructive communications.
Supporting Information Available
Table S1, helicoidal analysis of the oligodeoxynucleotide duplex containing the Tg6·G19 mismatch. This material is available free of charge via the Internet at http://pubs.acs.org.
This work was funded by NIH Grants CA-55678 (M.P.S.) and ES-013324 (A.K.B.).
Funding Statement
National Institutes of Health, United States
Footnotes
Abbreviations: BER, base excision repair; COSY, correlation spectroscopy; EDTA, ethylenediaminetetraacetic acid; EOS, electronegativity of substituent; ESP, electrostatic potential; N, northern sugar pucker; HPLC, high-pressure liquid chromatography; NER, nucleotide excision repair; NOE, nuclear Overhauser effect; NOESY, nuclear Overhauser effect spectroscopy; PME, particle mesh Ewald; rMD, restrained molecular dynamics; RESP, restrained electrostatic potential; rmsd, root-mean-square deviation; S, southern sugar pucker; SAS, solvent-accessible surface; Tg, thymine glycol, 5,6-dihydroxy-5,6-dihydrothymine; TPPI, time-proportional phase increment; Tg·G, the underlined Tg·G base pair in the oligodeoxynucleotide 5′-d(G1T2G3C4G5Tg6G7T8T9T10G11T12)-3′·5′-d(A13C14A15A16A17C18G19C20G21C22A23C24)-3′. The oligodeoxynucleotides discussed in this paper do not have terminal phosphate groups; we abbreviate the nomenclature by leaving out the phosphodiester linkage. A, C, G, T, and Tg refer to mononucleotide units. A right superscript refers to numerical position in the oligodeoxynucleotide sequence starting from the 5′-terminus of chain A and proceeding to the 3′-terminus of chain A and then from the 5′-terminus of chain B to the 3′-terminus of chain; C2, C5, C6, C8, C1′, C2′, C2′′, etc. represent specific carbon nuclei. H2, H5, H6, H8, H1′, H2′, H2′′, etc. represent the protons attached to these carbons.
Supplementary Material
References
- Teoule R.; Bonicel A.; Bert C.; Cadet J.; Polverelli M. (1974) Identification of radioproducts resulting from the breakage of thymine moiety by gamma irradiation of E. coli DNA in an aerated aqueous solution. Radiat. Res. 57, 46–58. [PubMed] [Google Scholar]
- Frenkel K.; Goldstein M. S.; Teebor G. W. (1981) Identification of the cis-thymine glycol moiety in chemically oxidized and gamma-irradiated deoxyribonucleic acid by high-pressure liquid chromatography analysis. Biochemistry 20, 7566–7571. [DOI] [PubMed] [Google Scholar]
- Zuo S.; Boorstein R. J.; Teebor G. W. (1995) Oxidative damage to 5-methylcytosine in DNA. Nucleic Acids Res. 23, 3239–3243. [DOI] [PMC free article] [PubMed] [Google Scholar]
- Pfeifer G. P. (2000) p53 mutational spectra and the role of methylated CpG sequences. Mutat. Res. 450, 155–166. [DOI] [PubMed] [Google Scholar]
- Vaishnav Y.; Holwitt E.; Swenberg C.; Lee H. C.; Kan L. S. (1991) Synthesis and characterization of stereoisomers of 5,6-dihydro-5,6-dihydroxy-thymidine. J. Biomol. Struct. Dyn. 8, 935–951. [DOI] [PubMed] [Google Scholar]
- Lustig M. J.; Cadet J.; Boorstein R. J.; Teebor G. W. (1992) Synthesis of the diastereomers of thymidine glycol, determination of concentrations and rates of interconversion of their cis-trans epimers at equilibrium and demonstration of differential alkali lability within DNA. Nucleic Acids Res. 20, 4839–4845. [DOI] [PMC free article] [PubMed] [Google Scholar]
- Wang Y. (2002) HPLC isolation and mass spectrometric characterization of two isomers of thymine glycols in oligodeoxynucleotides. Chem. Res. Toxicol. 15, 671–676. [DOI] [PubMed] [Google Scholar]
- Cathcart R.; Schwiers E.; Saul R. L.; Ames B. N. (1984) Thymine glycol and thymidine glycol in human and rat urine: A possible assay for oxidative DNA damage. Proc. Natl. Acad. Sci. U.S.A. 81, 5633–5637. [DOI] [PMC free article] [PubMed] [Google Scholar]
- Adelman R.; Saul R. L.; Ames B. N. (1988) Oxidative damage to DNA: Relation to species metabolic rate and life span. Proc. Natl. Acad. Sci. U.S.A. 85, 2706–2708. [DOI] [PMC free article] [PubMed] [Google Scholar]
- Brown K. L.; Adams T.; Jasti V. P.; Basu A. K.; Stone M. P. (2008) Interconversion of the cis-5R,6S- and trans-5R,6R-thymine glycol lesions in duplex DNA. J. Am. Chem. Soc. 129, 11701–11710. [DOI] [PMC free article] [PubMed] [Google Scholar]
- Kung H. C.; Bolton P. H. (1997) Structure of a duplex DNA containing a thymine glycol residue in solution. J. Biol. Chem. 272, 9227–9236. [DOI] [PubMed] [Google Scholar]
- Kao J. Y.; Goljer I.; Phan T. A.; Bolton P. H. (1993) Characterization of the effects of a thymine glycol residue on the structure, dynamics, and stability of duplex DNA by NMR. J. Biol. Chem. 268, 17787–17793. [PubMed] [Google Scholar]
- Clark J. M.; Pattabiraman N.; Jarvis W.; Beardsley G. P. (1987) Modeling and molecular mechanical studies of the cis-thymine glycol radiation damage lesion in DNA. Biochemistry 26, 5404–5409. [DOI] [PubMed] [Google Scholar]
- Ocampo-Hafalla M. T.; Altamirano A.; Basu A. K.; Chan M. K.; Ocampo J. E.; Cummings A. Jr.; Boorstein R. J.; Cunningham R. P.; Teebor G. W. (2006) Repair of thymine glycol by hNth1 and hNeil1 is modulated by base pairing and cis-trans epimerization. DNA Repair (Amsterdam) 5, 444–454. [DOI] [PubMed] [Google Scholar]
- Piotto M.; Saudek V.; Sklenar V. (1992) Gradient-tailored excitation for single-quantum NMR spectroscopy of aqueous solutions. J. Biomol. NMR 2, 661–665. [DOI] [PubMed] [Google Scholar]
- Carr H. Y.; Purcell E. M. (1954) Effects of diffusion on free precession in nuclear magnetic resonance experiments. Phys. Rev. 94, 630. [Google Scholar]
- Vold R. L.; Waugh J. S.; Klein M. P.; Phelps D. E. (1968) Measurement of spin relaxation in complex systems. J. Chem. Phys. 48, 3831–3832. [Google Scholar]
- Delaglio F.; Grzesiek S.; Vuister G. W.; Zhu G.; Pfeifer J.; Bax A. (1995) NMRPipe: A multidimensional spectral processing system based on UNIX pipes. J. Biomol. NMR 6, 277–293. [DOI] [PubMed] [Google Scholar]
- Goddard T. D., and Kneller D. G. (2006) SPARKY v.3.113, University of California, San Francisco.
- Keepers J. W.; James T. L. (1984) A theoretical study of distance determinations from NMR—Two-dimensional nuclear Overhauser effect spectra. J. Magn. Reson. 57, 404–426. [Google Scholar]
- James T. L. (1991) Relaxation matrix analysis of two-dimensional nuclear Overhauser effect spectra. Curr. Opin. Struct. Biol. 1, 1042–1053. [Google Scholar]
- Borgias B. A.; James T. L. (1989) Two-dimensional nuclear Overhauser effect: Complete relaxation matrix analysis. Methods Enzymol. 176, 169–183. [DOI] [PubMed] [Google Scholar]
- Borgias B. A.; James T. L. (1990) MARDIGRAS—a procedure for matrix analysis of relaxation for discerning geometry of an aqueous structure. J. Magn. Reson. 87, 475–487. [Google Scholar]
- Liu H.; Spielmann H. P.; Ulyanov N. B.; Wemmer D. E.; James T. L. (1995) Interproton distance bounds from 2D NOE intensities: Effect of experimental noise and peak integration errors. J. Biomol. NMR 6, 390–402. [DOI] [PubMed] [Google Scholar]
- Delaglio F.; Wu Z.; Bax A. (2001) Measurement of homonuclear proton couplings from regular 2D COSY spectra. J. Magn. Reson. 149, 276–281. [DOI] [PubMed] [Google Scholar]
- Van De Ven F. J. M.; Hilbers C. W. (1988) Nucleic acids and nuclear magnetic resonance. Eur. J. Biochem. 178, 1–38. [DOI] [PubMed] [Google Scholar]
- van Wijk J.; Huckriede B. D.; Ippel J. H.; Altona C. (1992) Furanose sugar conformations in DNA from NMR coupling constants. Methods Enzymol. 211, 286–306. [DOI] [PubMed] [Google Scholar]
- Frisch M. J., Trucks G. W., Schlegel H. B., Scuseria G. E., Robb M. A., Cheeseman J. R., Montgomery J. A., Vreven T., Kudin K. N., Burant J. C., Millam J. M., Iyengar S. S., Tomasi J., Barone V., Mennucci B., Cossi M., Scalmani G., Rega N., Petersson G. A., Nakatsuji H., Hada M., Ehara M., Toyota K., Fukuda R., Hasegawa J., Ishida M., Nakajima T., Honda Y., Kitao O., Nakai H., Klene M., Li X., Knox J. E., Hratchian H. P., Cross J. B., Adamo C., Jaramillo J., Gomperts R., Stratmann R. E., Yazyev O., Austin A. J., Cammi R., Pomelli C., Pomelli J., Ochterski W., Ayala P. Y., Morokuma K., Voth G. A., Salvador P., Dannenberg J. J., Zakrzewska V. G., Daniels A. D., Farkas O., Rabuck A. D., Raghavachari K., and Ortiz J. V. (2004) GAUSSIAN 03, Gaussian, Inc., Wallingford, CT.
- Case D. A.; Cheatham T. E. III; Darden T.; Gohlke H.; Luo R.; Merz K. M. Jr.; Onufriev A.; Simmerling C.; Wang B.; Woods R. J. (2005) The AMBER biomolecular simulation programs. J. Comput. Chem. 26, 1668–1688. [DOI] [PMC free article] [PubMed] [Google Scholar]
- Macke T., and Case D. A. (1998) Modeling unusual nucleic acid structures, in Molecular Modeling of Nucleic Acids (Leontes N. B., and SantaLucia J. Jr., Eds.) American Chemical Society, Washington, DC. [Google Scholar]
- Wang J. M.; Cieplak P.; Kollman P. A. (2000) How well does a restrained electrostatic potential (RESP) model perform in calculating conformational energies of organic and biological molecules?. J. Comput. Chem. 21, 1049–1074. [Google Scholar]
- Clore G. M.; Brunger A. T.; Karplus M.; Gronenborn A. M. (1986) Application of molecular dynamics with interproton distance restraints to three-dimensional protein structure determination. J. Mol. Biol. 191, 523–551. [DOI] [PubMed] [Google Scholar]
- Tsui V.; Case D. A. (2000) Theory and applications of the generalized Born solvation model in macromolecular simulations. Biopolymers 56, 275–291. [DOI] [PubMed] [Google Scholar]
- Bashford D.; Case D. A. (2000) Generalized Born models of macromolecular solvation effects. Annu. Rev. Phys. Chem. 51, 129–152. [DOI] [PubMed] [Google Scholar]
- Berendsen H. J. C.; Postma J. P. M.; van Gunsteren W. F.; DiNola A.; Haak J. R. (1984) Molecular dynamics with coupling to an external bath. J. Phys. Chem. 81, 3684–3690. [Google Scholar]
- Loncharich R. J.; Brooks B. R.; Pastor R. W. (1992) Langevin dynamics of peptides: The frictional dependence of isomerization rates of N-acetylalanyl-N′-methylamide. Biopolymers 32, 523–535. [DOI] [PubMed] [Google Scholar]
- Izaguirre J. A.; Catarello D. P.; Wozniak J. M.; Skeel R. D. (2001) Langevin stabilization of molecular dynamics. J. Chem. Phys. 114, 2090–2098. [Google Scholar]
- Essmann U.; Perera L.; Berkowitz M. L.; Darden T.; Lee H.; Pedersen L. G. (1995) A smooth particle mesh Ewald method. J. Chem. Phys. 103, 8577–8593. [Google Scholar]
- Ryckaert J. P.; Ciccotti G.; Berendsen H. J. C. (1977) Numerical integration of cartesian equations of motion of a system with constraints: Molecular dynamics of N-alkanes. J. Comput. Phys. 23, 327–341. [Google Scholar]
- Lavery R., and Sklenar H. (1996) CURVES 5.1. Helical analysis of irregular nucleic acids, Laboratoire de Biochimie Theorique CNRS, Paris, France. [Google Scholar]
- Pettersen E. F.; Goddard T. D.; Huang C. C.; Couch G. S.; Greenblatt D. M.; Meng E. C.; Ferrin T. E. (2004) UCSF chimera: A visualization system for exploratory research and analysis. J. Comput. Chem. 25, 1605–1612. [DOI] [PubMed] [Google Scholar]
- Sanner M. F.; Olson A. J.; Spehner J. C. (1996) Reduced surface: An efficient way to compute molecular surfaces. Biopolymers 38, 305–320. [DOI] [PubMed] [Google Scholar]
- Reid B. R. (1987) Sequence-specific assignments and their use in NMR studies of DNA structure. Q. Rev. Biophys. 20, 2–28. [DOI] [PubMed] [Google Scholar]
- Patel D. J.; Shapiro L.; Hare D. (1987) DNA and RNA: NMR studies of conformations and dynamics in solution. Q. Rev. Biophys. 20, 35–112. [DOI] [PubMed] [Google Scholar]
- Boelens R.; Scheek R. M.; Dijkstra K.; Kaptein R. (1985) Sequential assignment of imino- and amino-proton resonances in 1H NMR spectra of oligonucleotides by two-dimensional NMR spectroscopy. Application to a lac operator fragment. J. Magn. Reson. 62, 378–386. [Google Scholar]
- Connolly A. (1983) Analytical molecular surface calculation. J. Appl. Crystallogr. 16, 548–558. [Google Scholar]
- Hazra T. K.; Das A.; Das S.; Choudhury S.; Kow Y. W.; Roy R. (2007) Oxidative DNA damage repair in mammalian cells: A new perspective. DNA Repair (Amsterdam) 6, 470–480. [DOI] [PMC free article] [PubMed] [Google Scholar]
- Patel D. J.; Kozlowski S. A.; Marky L. A.; Rice J. A.; Broka C.; Dallas J.; Itakura K.; Breslauer K. J. (1982) Structure, dynamics, and energetics of deoxyguanosine·thymidine wobble base pair formation in the self-complementary d(CGTGAATTCGCG) duplex in solution. Biochemistry 21, 437–444. [DOI] [PubMed] [Google Scholar]
- Hare D.; Shapiro L.; Patel D. J. (1986) Wobble dG·dT pairing in right-handed DNA: Solution conformation of the d(C-G-T-G-A-A-T-T-C-G-C-G) duplex deduced from distance geometry analysis of nuclear Overhauser effect spectra. Biochemistry 25, 7445–7456. [DOI] [PubMed] [Google Scholar]
- Allawi H. T.; SantaLucia J. Jr. (1997) Thermodynamics and NMR of internal G·T mismatches in DNA. Biochemistry 36, 10581–10594. [DOI] [PubMed] [Google Scholar]
- Hruska F. E.; Sebastian R.; Grand A.; Voituriez L.; Cadet J. (1987) Characterization of a γ-radiation-induced decomposition product of thymidine. Crystal and molecular structure of the (−)cis(5R,6S) thymidine glycol. Can. J. Chem. 65, 2618–2623. [Google Scholar]
- Aller P.; Rould M. A.; Hogg M.; Wallace S. S.; Doublie S. (2007) A structural rationale for stalling of a replicative DNA polymerase at the most common oxidative thymine lesion, thymine glycol. Proc. Natl. Acad. Sci. U.S.A. 104, 814–818. [DOI] [PMC free article] [PubMed] [Google Scholar]
- Roongta V. A.; Jones C. R.; Gorensteia D. G. (1990) Effect of distortions in the deoxyribosephosphate backbone conformation of duplex oligodeoxyribonucletide dodecamers containing GT, GG, GA, AC, and GU base-pair mismatches on 31P NMR spectra. Biochemistry 29, 5245–5258. [DOI] [PubMed] [Google Scholar]
- Moe J. G.; Russu I. M. (1992) Kinetics and energetics of base-pair opening in 5′-d(CGCGAATTCGCG)-3′ and a substituted dodecamer containing G·T mismatches. Biochemistry 31, 8421–8428. [DOI] [PubMed] [Google Scholar]
- Achey P. M.; Wright C. F. (1983) Inducible repair of thymine ring saturation damage in phi X174 DNA. Radiat. Res. 93, 609–612. [PubMed] [Google Scholar]
- Moran E.; Wallace S. S. (1985) The role of specific DNA base damages in the X-ray-induced inactivation of bacteriophage PM2. Mutat. Res. 146, 229–241. [DOI] [PubMed] [Google Scholar]
- Laspia M. F.; Wallace S. S. (1988) Excision repair of thymine glycols, urea residues, and apurinic sites in Escherichia coli. J. Bacteriol. 170, 3359–3366. [DOI] [PMC free article] [PubMed] [Google Scholar]
- Hayes R. C.; Petrullo L. A.; Huang H. M.; Wallace S. S.; LeClerc J. E. (1988) Oxidative damage in DNA. Lack of mutagenicity by thymine glycol lesions. J. Mol. Biol. 201, 239–246. [DOI] [PubMed] [Google Scholar]
- Kow Y. W.; Faundez G.; Melamede R. J.; Wallace S. S. (1991) Processing of model single-strand breaks in phi X-174 RF transfecting DNA by Escherichia coli. Radiat. Res. 126, 357–366. [PubMed] [Google Scholar]
- Hayes R. C.; LeClerc J. E. (1986) Sequence dependence for bypass of thymine glycols in DNA by DNA polymerase I. Nucleic Acids Res. 14, 1045–1061. [DOI] [PMC free article] [PubMed] [Google Scholar]
- McNulty J. M.; Jerkovic B.; Bolton P. H.; Basu A. K. (1998) Replication inhibition and miscoding properties of DNA templates containing a site-specific cis-thymine glycol or urea residue. Chem. Res. Toxicol. 11, 666–673. [DOI] [PubMed] [Google Scholar]
- Kusumoto R.; Masutani C.; Iwai S.; Hanaoka F. (2002) Translesion synthesis by human DNA polymerase eta across thymine glycol lesions. Biochemistry 41, 6090–6099. [DOI] [PubMed] [Google Scholar]
- Fischhaber P. L.; Gerlach V. L.; Feaver W. J.; Hatahet Z.; Wallace S. S.; Friedberg E. C. (2002) Human DNA polymerase kappa bypasses and extends beyond thymine glycols during translesion synthesis in vitro, preferentially incorporating correct nucleotides. J. Biol. Chem. 277, 37604–37611. [DOI] [PubMed] [Google Scholar]
- Lin J. J.; Sancar A. (1989) A new mechanism for repairing oxidative damage to DNA: (A)BC excinuclease removes AP sites and thymine glycols from DNA. Biochemistry 28, 7979–7984. [DOI] [PubMed] [Google Scholar]
- Reardon J. T.; Bessho T.; Kung H. C.; Bolton P. H.; Sancar A. (1997) In vitro repair of oxidative DNA damage by human nucleotide excision repair system: Possible explanation for neurodegeneration in xeroderma pigmentosum patients. Proc. Natl. Acad. Sci. U.S.A. 94, 9463–9468. [DOI] [PMC free article] [PubMed] [Google Scholar]
- Weiss B.; Cunningham R. P. (1985) Genetic mapping of Nth, a gene affecting endonuclease III (thymine glycol-DNA glycosylase) in Escherichia coli K-12. J. Bacteriol. 162, 607–610. [DOI] [PMC free article] [PubMed] [Google Scholar]
- Jiang D.; Hatahet Z.; Melamede R. J.; Kow Y. W.; Wallace S. S. (1997) Characterization of Escherichia coli endonuclease VIII. J. Biol. Chem. 272, 32230–32239. [DOI] [PubMed] [Google Scholar]
- Roldan-Arjona T.; Anselmino C.; Lindahl T. (1996) Molecular cloning and functional analysis of a Schizosaccharomyces pombe homologue of Escherichia coli endonuclease III. Nucleic Acids Res. 24, 3307–3312. [DOI] [PMC free article] [PubMed] [Google Scholar]
- Hilbert T. P.; Boorstein R. J.; Kung H. C.; Bolton P. H.; Xing D.; Cunningham R. P.; Teebor G. W. (1996) Purification of a mammalian homologue of Escherichia coli endonuclease III: identification of a bovine pyrimidine hydrate-thymine glycol DNAse/AP lyase by irreversible cross linking to a thymine glycol-containing oligoxynucleotide. Biochemistry 35, 2505–2511. [DOI] [PubMed] [Google Scholar]
- Sarker A. H.; Ikeda S.; Nakano H.; Terato H.; Ide H.; Imai K.; Akiyama K.; Tsutsui K.; Bo Z.; Kubo K.; Yamamoto K.; Yasui A.; Yoshida M. C.; Seki S. (1998) Cloning and characterization of a mouse homologue (mNthl1) of Escherichia coli endonuclease III. J. Mol. Biol. 282, 761–774. [DOI] [PubMed] [Google Scholar]
- Hilbert T. P.; Chaung W.; Boorstein R. J.; Cunningham R. P.; Teebor G. W. (1997) Cloning and expression of the cDNA encoding the human homologue of the DNA repair enzyme, Escherichia coli endonuclease III. J. Biol. Chem. 272, 6733–6740. [DOI] [PubMed] [Google Scholar]
- Aspinwall R.; Rothwell D. G.; Roldan-Arjona T.; Anselmino C.; Ward C. J.; Cheadle J. P.; Sampson J. R.; Lindahl T.; Harris P. C.; Hickson I. D. (1997) Cloning and characterization of a functional human homolog of Escherichia coli endonuclease III. Proc. Natl. Acad. Sci. U.S.A. 94, 109–114. [DOI] [PMC free article] [PubMed] [Google Scholar]
- Ikeda S.; Biswas T.; Roy R.; Izumi T.; Boldogh I.; Kurosky A.; Sarker A. H.; Seki S.; Mitra S. (1998) Purification and characterization of human NTH1, a homolog of Escherichia coli endonuclease III. Direct identification of Lys-212 as the active nucleophilic residue. J. Biol. Chem. 273, 21585–21593. [DOI] [PubMed] [Google Scholar]
- Hazra T. K.; Izumi T.; Boldogh I.; Imhoff B.; Kow Y. W.; Jaruga P.; Dizdaroglu M.; Mitra S. (2002) Identification and characterization of a human DNA glycosylase for repair of modified bases in oxidatively damaged DNA. Proc. Natl. Acad. Sci. U.S.A. 99, 3523–3528. [DOI] [PMC free article] [PubMed] [Google Scholar]
- Hazra T. K.; Kow Y. W.; Hatahet Z.; Imhoff B.; Boldogh I.; Mokkapati S. K.; Mitra S.; Izumi T. (2002) Identification and characterization of a novel human DNA glycosylase for repair of cytosine-derived lesions. J. Biol. Chem. 277, 30417–30420. [DOI] [PubMed] [Google Scholar]
- Bandaru V.; Sunkara S.; Wallace S. S.; Bond J. P. (2002) A novel human DNA glycosylase that removes oxidative DNA damage and is homologous to Escherichia coli endonuclease VIII. DNA Repair (Amsterdam) 1, 517–529. [DOI] [PubMed] [Google Scholar]
- Katafuchi A.; Nakano T.; Masaoka A.; Terato H.; Iwai S.; Hanaoka F.; Ide H. (2004) Differential specificity of human and Escherichia coli endonuclease III and VIII homologues for oxidative base lesions. J. Biol. Chem. 279, 14464–14471. [DOI] [PubMed] [Google Scholar]
- Miller H.; Fernandes A. S.; Zaika E.; McTigue M. M.; Torres M. C.; Wente M.; Iden C. R.; Grollman A. P. (2004) Stereoselective excision of thymine glycol from oxidatively damaged DNA. Nucleic Acids Res. 32, 338–345. [DOI] [PMC free article] [PubMed] [Google Scholar]
- Jia L.; Shafirovich V.; Geacintov N. E.; Broyde S. (2007) Lesion specificity in the base excision repair enzyme hNeil1: Modeling and dynamics studies. Biochemistry 46, 5305–5314. [DOI] [PMC free article] [PubMed] [Google Scholar]
- Parker J. B.; Bianchet M. A.; Krosky D. J.; Friedman J. I.; Amzel L. M.; Stivers J. T. (2007) Enzymatic capture of an extrahelical thymine in the search for uracil in DNA. Nature 449, 433–437. [DOI] [PMC free article] [PubMed] [Google Scholar]
Associated Data
This section collects any data citations, data availability statements, or supplementary materials included in this article.


