

Abstract
Objective
To characterize a model of atypical antipsychotic drug-induced obesity and evaluate its mechanism.
Research Methods and Procedures
Chronically, olanzapine or clozapine was self-administered via cookie dough to rodents (Sprague-Dawley or Wistar rats; C57Bl/6J or A/J mice). Chronic studies measured food intake, body weight, adiponectin, active ghrelin, leptin, insulin, tissue wet weights, glucose, clinical chemistry endpoints, and brain dopaminergic D2 receptor density. Acute studies examined food intake, ghrelin, leptin, and glucose tolerance.
Results
Olanzapine (1 to 8 mg/kg), but not clozapine, increased body weight in female rats only. Weight changes were detectable within 2 to 3 days and were associated with hyperphagia starting ~24 hours after the first dose. Chronic administration (12 to 29 days) led to adiposity, hyperleptinemia, and mild insulin resistance; no lipid abnormalities or changes in D2 receptor density were observed. Topiramate, which has reversed weight gain from atypical anti-psychotics in humans, attenuated weight gain in rats. Acutely, olanzapine, but not clozapine, lowered plasma glucose and leptin. Increases in glucose, insulin, and leptin following a glucose challenge were also blunted.
Discussion
A model of olanzapine-induced obesity was characterized which shares characteristics of patients with atypical antipsychotic drug-induced obesity; these characteristics include hyperphagia, hyperleptinemia, insulin resistance, and weight gain attenuation by topiramate. This model may be a useful and inexpensive model of uncomplicated obesity amenable to rapid screening of weight loss drugs. Olanzapine-induced weight gain may be secondary to hyperphagia associated with acute lowering of plasma glucose and leptin, as well as the inability to increase plasma glucose and leptin following a glucose challenge.
Keywords: atypical antipsychotics, olanzapine, topiramate, leptin, dopamine type 2 receptor
Introduction
A number of drugs exhibit unexpected side effects related to body weight changes in humans. Determining the mechanism of these side effects might lead to new targets for the treatment of obesity and overweight. In addition, such research may reveal ways to design new drugs with fewer side effects. Well-known examples of drug side effects on body weight include the changes observed in patients taking the antiseizure drug topiramate (weight loss) and the atypical antipsychotics olanzapine and clozapine (weight gain).
Antipsychotic drugs are principally used to treat schizophrenia and other psychoses (1,2). There are two classes of antipsychotic medications referred to as either typical or atypical. Typical antipsychotic drugs, like haloperidol, act as high-affinity antagonists for type 2 dopamine (D2)-like receptors (D2, D3, and D4 receptors) with a consequence of extrapyramidal side effects. Atypical compounds, like olanzapine and clozapine, have lower incidences of extrapyramidal side effects than typical antipsychotics because they are potent antagonists of serotonin type 2A and type 2 dopamine (D2)1 receptors, with a higher affinity for the former (3). These drugs also inhibit the G-protein-coupled receptors for several other biogenic amines including cholinergic, adrenergic, histaminergic, and other dopaminergic receptors (for review, see 4–6). Even though the atypical compounds have fewer extrapyramidal side effects, they possess the negative side effect of weight gain in some, but not all, individuals, suggesting a genetic predisposition (for review, see 7–9). Even those patients who do not become obese frequently report increases in appetite and meal size (10,11). Not surprisingly, hyperphagia is associated with this side effect in humans. Accordingly, it has been demonstrated that olanzapine-induced weight gain is caused by increased caloric intake, rather than alterations in basal energy expenditure (12). It has been suggested that olanzapine stimulates appetite through serotonergic or histaminergic mechanisms in the lateral hypothalamus (13); however, the exact mechanism of olanzapine-induced appetite stimulation is unknown. Olanzapine increases plasma concentrations of the adipokine and satiety hormone leptin in humans (e.g., 14,15). The increase in leptin observed with chronic drug administration is probably secondary to increased adipose tissue mass. On the other hand, effects of the appetite-stimulating hormone ghrelin in humans have been inconsistent (11,16).
The popular antiseizure agent topiramate exhibits a weight loss side effect that has been reported to be highly effective in the forms of obesity caused by olanzapine and clozapine (e.g., 17–22). Thus, animal models reproducing these effects are potentially valuable in the development of topiramate-like weight loss agents. Therefore, examining the effects of topiramate on olanzapine-induced obesity in rats is of interest.
In the following report, we describe an animal model of atypical antipsychotic-induced obesity where the drug is self-administered to help reduce handling stress and other potential adverse events associated with chronic drug administration. To address the mechanism of the weight gain, we examined the acute metabolic effects of olanzapine in addition to the chronic effects. We posited that changes in endocrine or metabolic factors might precede the onset of hyperphagia and, thereby, help explain it. Our results show that olanzapine brings about early changes in the plasma concentrations of the satiety hormone leptin and other factors recognized to impact appetite, including plasma glucose and insulin concentrations and the response to a glucose challenge. The potential role of these acute changes in the observed hyperphagia is discussed.
Research Methods and Procedures
Drugs
Olanzapine was obtained as a generous gift from both Neuland Laboratories Ltd. (Hyderabad, India) and Dr. Reddy’s Laboratories Ltd. (Hyderabad, India). Clozapine was purchased from Novartis Pharmaceuticals (East Hanover, NJ). Topiramate was purchased from Johnson and Johnson (Raritan, NJ) or obtained as a gift from Solvay Pharmaceuticals (Brussels, Belgium).
Animals
The animal facilities and protocol were reviewed and approved by the Institutional Animal Care and Use Committee of The Pennsylvania State University College of Medicine. Narrow weight range male and female Sprague-Dawley and Wistar rats (~220 to 225 grams) were purchased from Charles River Laboratories (Cambridge, MA). Female C57Bl/6J and A/J mice (~6 weeks old) were purchased from The Jackson Laboratory (Bar Harbor, ME). All animals were maintained on a 12-/12-hour light/dark cycle with food (Harlan Teklad Rodent Chow; Harlan Teklad, Madison, WI) and water provided ad libitum. Animals were housed singly unless indicated otherwise. Control and experimental groups were matched for body weight in all experiments.
Drug Preparation for Chronic Studies
To reduce animal stress and the likelihood of adverse events associated with chronic drug administration through intraperitoneal (IP) injection or oral gavage, drugs were chronically self-administered in a small quantity of cookie dough to animals trained to eat drug-free dough. Individual batches of dough were prepared separately from a pre-prepared dry mix. To prepare control dough, approximately 496 grams of Betty Crocker Chocolate Chip Cookie Mix (General Mills, Inc., Minneapolis, MN) was mixed with 113 grams of Imperial Margarine (Unilever, Toronto, Ontario, Canada) and 61 grams of Egg Beaters egg substitute (Con-Agra Foods Inc., Omaha, NE) per the manufacturer’s directions. A 325-W KitchenAid mixer (KitchenAid, St. Joseph, MI) was used to complete all mixing. After the addition of wet ingredients, all batches of dough were prepared to a similar consistency by mixing batter on setting 2 until the chips broke up into 2- to 3-mm pieces (~15 to 20 minutes). For drug-containing dough, drugs were added to the dry mix before the addition of wet ingredients and mixed thoroughly to ensure equal distribution. For rat studies, the initial drug concentration for olanzapine or clozapine was 0.2 mg/g dough; dough was provided at the quantity of 2 grams of dough per 100 grams of the previous day’s body weight. For mice, initial drug concentration was 0.1 mg/g dough; dough was provided at the quantity of 4 grams per 100 grams of the previous day’s body weight. Control animals received an equal quantity of drug-free dough. The drug-free (control) and drug-containing dough were stored in air-tight containers at 4 °C for the duration of the experiment.
Drug Administration in Chronic Studies
For chronic studies, cookie dough portions were provided in 1- or 0.75-ounce American portion-control cups (waxed paper) from Hoffmaster (Oshkosh, WI; stock nos. 67–100 and 67–075). Dough was administered between 4 PM and 6 PM daily, at which time body weight and 24-hour food intake were also measured. Rats and mice were first trained to eat the drug-free dough from the wax paper cups for 3 to 6 days before the introduction of the drug. During this time, all of the cookie dough was generally consumed within 30 minutes. After this training period, the drug could be added to the dough without affecting its extent of consumption. Parts of the waxed paper cups were frequently destroyed by chewing or were partially consumed.
Based on preliminary studies (data not shown), a dosing regimen was designed to insure continued weight gain. Thus, olanzapine was self-administered at 4 mg/kg during Days 0 through 6. On the 7th day of treatment, the dose was increased to 8 mg/kg. In longer experiments, the dosage was again increased on Day 21 to 12 mg/kg and then to 20 mg/kg on Day 29 through the end of the study.
In chronic clozapine studies, the drug was provided at 4 mg/kg for the first 8 days of treatment. On the 9th day of administration, the dose was increased to 8 mg/kg. Beginning on Day 13, animals received clozapine-containing dough (8 mg/kg) supplemented with olanzapine (4 mg/kg). In experiments where animals received olanzapine and topiramate concurrently, the dough contained both drugs. The dosage of topiramate used was 100 mg/kg body weight.
Drug Preparation and Administration in Acute Studies
For acute experiments, clozapine or olanzapine solution was prepared for IP injection or oral administration by gavage. Both drugs were first solubilized in 0.1 N HCl. After adjusting pH to 5.5 with 0.01 N NaOH, saline was added to reach the desired concentration. For control animals, a comparable pH-adjusted saline was prepared. In experiments with topiramate, which had to be prepared as an oral suspension, olanzapine (solution) and topiramate (suspension) were administered in a vehicle solution (2% polyethylene glycol in 1% carboxymethylcellulose, pH 5.5).
In acute studies, animals received four doses of drug over a 28-hour period (IP or gavage), with food and water provided ad libitum for the first 24 hours. The total daily doses were: olanzapine, 4 mg/kg per day; clozapine, 4 mg/kg per day; and olanzapine plus topiramate, 4 and 100 mg/kg per day. One-third of the total daily dose was administered on the 1st day between 8 AM and 9 AM. The other two-thirds dose was provided between 4 PM and 5 PM (food and water still provided ad libitum). The following day, one-third of the total daily dose was administered between 8 AM and 9 AM. At this point, animals were food deprived. Four hours later, the remaining two-thirds of total daily dose was administered. An oral glucose tolerance test (OGTT) was performed 1 hour after this final dosing (details provided below).
Clinical Chemistry Measurements
Plasma glucose concentrations from whole blood were measured using One Touch Ultra glucometers (Lifescan Technologies, Milpitas, CA). Insulin concentrations were calculated using a commercial ELISA kit for rat insulin (American Laboratory Products Co., Windham, NH). Alanine aminotransferase (ALT), aspartate aminotransferase (AST), albumin, very low-density lipoprotein cholesterol, and triglycerides were determined using the DT60 II and DTSc II modules of the Vitros Chemistry System (Ortho-Clinical Diagnostics, Rochester, NY). Plasma concentrations of leptin and active ghrelin were determined by radio-immunoassay (Linco Research, St. Charles, MO). Free fatty acid (FFA) concentrations were measured by colorimetry (Wako Diagnostics, Richmond, VA).
Assessment of Central Dopamine Receptors and Liver Histology
At the conclusion of most chronic studies, peripheral tissues were removed for morphometry and histology, whereas brains were saved for radioligand binding studies. After decapitation, truncal blood was collected, peripheral tissues were weighed and, in some cases, was formalin fixed for subsequent histological analysis by standard hematoxylin and eosin staining. Also at this time, brains were immediately removed and immersed in −40 °C isopentane (2-methylbutane) and stored at −80 °C. Brains were sectioned on a cryostat in the coronal plane at 20 μm and thaw-mounted on poly-lysine-coated slides. In this particular experiment, the brain regions examined were from the dorsal and ventral striatum [1.7 to 1.1 mm from bregma; inclusive of the nucleus accumbens (NAcc) and dorsal striatum] and midbrain region [−5.6 to −6.1 mm from bregma; inclusive of the ventral tegmental area (VTA) and the substantia nigra pars compacta (SNpc)]. Four sections from each brain region were serially mounted on a slide. Approximately eight slides were taken from each brain region (representing an approximate distance of 160 μm between sections). One slide from each brain region was subject to cresyl violet staining to accurately determine anterior-posterior anatomical coordinates for proper analytical comparisons.
Autoradiography of D2 Receptors
Slide-mounted matched sections were removed from −80 °C freezer storage, and brain sections were allowed to thaw for at least 3 minutes at room temperature (RT). After thawing, sections were air dried for 3 minutes, preincubated for 15 minutes in 50 mM Tris HCl (pH 7.4) and 120 mM NaCl at RT followed by an incubation for 30 minutes at RT in 50 mM Tris HCl (pH 7.4), 120 mM NaCl, 5 mM KCl, 2 mM CaCl, 1 mM MgCl2, and a 0.6 nM concentration of [125I]-iodosulpride (Amersham Biosciences/GE Healthcare, Piscataway, NJ; 2000 Ci/mmol). This radioligand has a Kd of 0.6 and 1.2 nM for rat D2 and D3 receptors, respectively (23). The concentration of iodosulpride was determined previously by running a series of test sections at stepped concentrations bracketing a suggested concentration of 0.3 nM. Slides were rinsed two times for 5 minutes, each time in ice-cold 50 mM Tris-HCl (pH 7.4) buffer, and placed before a stream of air at RT to dry for several hours. Non-specific binding was determined on a set of test sections incubated as described above with the addition of a 50 μM concentration of (+)-apomorphine to the [125I]-iodosulpride incubation solution. Subsequently, the slides were placed in a cassette with [125I] microscale standards (Amersham, Arlington Heights, IL) to expose Kodak X-OMAT AR film (Eastman Kodak, Rochester, NY) for 18 hours (24). Using the developed film, receptor density was determined semiquantitatively by a densitometry procedure using the microscales to generate a standard curve using computer software provided with an Analytical Imaging Station (Imaging Research Inc., St. Catherines, Ontario, Canada). Binding was assessed for each target region unilaterally in all tissue. Both background density (as sampled from the corpus callosum) and non-specific binding density were subtracted from all assayed tissue.
OGTTs
Animals were food-deprived for 16 or 5 hours, as indicated, before the start of the OGTT. An initial blood sample and basal glucose measurement was obtained from each rat. Immediately afterwards, a glucose solution (1 mL/100 grams body weight, 1.25 g/kg) was administered by oral gavage. Blood samples were collected in Microvette 500 potassium-EDTA-coated sample tubes (Sarstedt Inc., Newton, NC) after a tail snip using a sterile scalpel. A bandage covered the snipped tail between blood samplings (30-minute intervals through 120-minute post-glucose gavage); thus, only one cut was necessary. Samples were centrifuged at 1800g for 10 minutes at 4 °C; plasma was collected and frozen at −80 °C for further analysis.
Statistical Analysis
Absolute [125I]-iodosulpride binding was expressed as femtomoles per milligram of tissue equivalent ± SE. Binding for the olanzapine group was also expressed as percentage of the binding of the saline group ± SE. The assessed brain regions were the following: the NAcc core and the NAcc shell, representing the terminal regions of the mesoaccumbens dopamine projections, the dorsolateral aspect of the striatum [dorsolateral striatum (DLS)] that receives exclusive projections from the nigrostriatal dopaminergic neurons, and the somatodendritic regions of both systems, respectively: the rostral and caudal VTA of the brain stem and the SNpc. Results for absolute specific binding and percentage specific binding were analyzed by separate two-way ANOVA (treatment vs. structure), and post hoc Least Significant Difference tests were made where applicable. Statistical significance was regarded as p < 0.05.
For all other results, data are expressed as the mean ± SE. To calculate statistical significance (p < 0.05), a two-tailed Student’s t test or one-way ANOVA with, or without, repeated measures and appropriate post-tests were used. All statistical analyses and data manipulations were made using GraphPad Prism (GraphPad Software, San Diego, CA) or Statistica 6.0 software (Statistica, Tulsa, OK).
Results
Effect of Chronic Olanzapine or Clozapine Treatment on Body Weight and Food Intake
We sought to develop and characterize an animal model of the obesity side effect of atypical antipsychotic drugs frequently observed in humans. Different strains of rats and mice were initially tested with olanzapine. C57Bl/6J and A/J mice were chosen because they exhibit different susceptibilities to diet-induced obesity, and consomic strains of these animals are available that can be used to address the underlying genetics. Surprisingly, olanzapine did not increase body weight in either strain (Figure 1). Indeed, A/J mice displayed a non-significant trend of weight loss (Figure 1), along with a non-significant trend for decreased food intake (data not shown).
Figure 1.

Chronic self-administration of olanzapine in mice. A/J (upper panel) and C57Bl/6J (lower panel) mice were provided olanzapine (4 mg/kg) daily in a small amount of cookie dough (Olanzapine) or cookie dough alone (Control), as indicated. On Day 10, the dosage was increased to 8 mg/kg. Body weight was monitored daily for the duration of the experiment. Data are represented as mean body weight ± SE (n = 10).
Similarly, no effects on body weight were observed after chronic administration of either clozapine or olanzapine to male rats for 2 weeks (data not shown). In contrast, self-administered olanzapine increased body weight gain in female Wistar (data not shown) and Sprague-Dawley (Figure 2, upper panel) rats. These findings are in agreement with several previous studies showing effects of olanzapine in female, but not male, rats (25–28).
Figure 2.

Effect of chronic olanzapine exposure on body weight and food intake in rats. Sprague-Dawley rats were matched for body weight and then trained to eat cookie dough as indicated in “Research Methods and Procedures” (Day 0 body weights not significantly different: control, 246.00 ± 2.8; olanzapine, 245.9 ± 3.0). Cookie dough ± olanzapine (4 mg/kg body weight) was then self-administered daily starting at Day 0. Dose of olanzapine was increased at days 7, 21, and 29 to 8, 12, or 20 mg/kg body weight, respectively. Body weight (upper panel) and food intake (lower panel) were monitored daily. Data are mean ± SE (n = 12). Change in body weight differed significantly (p < 0.05) between Days 3 to 29. * p < 0.05.
After a number of experiments using a single dose, a stepped dosing protocol was devised that allowed an extended period of weight gain. Alternatively, at a single dose, the drug effects would plateau within 7 to 10 days (data not shown). The increase in body weight was coupled with an increase in average daily food intake (Figure 2, lower panel). This increase in food intake became significant only after the first 24 hours. In the experiment shown in Figure 2, there was an apparent trend for an increase in food intake in the first 24 hours, but this was not always observed and was not statistically significant in any experiment.
A sedating effect was evident after the dosage was increased to 20 mg/kg on Day 29; this sedation may explain the decreased daily food intake in the olanzapine group observed after that dose was administered (Figure 2). Accordingly, animals receiving this amount of olanzapine were noticeably less active and unresponsive, which is presumed to have led to the decreases in daily food intake at this dosage. Because the weight gain effect of olanzapine did eventually plateau, even with our ramped dosing protocol (for details, see “Research Methods and Procedures”), other experiments were terminated earlier than 20 days, as indicated.
In contrast to olanzapine, animals provided with clozapine-containing dough had no statistically significant change in body weight (Figure 3, Days 0 to 12). However, when clozapine-containing dough was replaced with dough containing both olanzapine and clozapine, weight gain was observed (Figure 3, Days 13 to 27).
Figure 3.

Clozapine lacks the body weight gain side effect in rats. Sprague-Dawley rats were matched for body weight and then trained to eat cookie dough as indicated in “Research Methods and Procedures” (Day 0 body weights not significantly different: control, 256.8 ± 3.5; clozapine →clozapine plus olanzapine, 259.3 ± 3.6). Animals began self-administration of clozapine-containing dough (4 mg/kg) or cookie dough alone, as indicated. The dose of clozapine was increased to 8 mg/kg on Day 8. Starting with Day 13 (indicated by arrow), animals receiving clozapine-containing dough were given dough supplemented with olanzapine (4 mg/kg). Body weights were monitored daily, and the change in weight from day zero is expressed as mean ± SE (n = 12). Change in body weight differed significantly between groups from Day 17 through the end of the study (p < 0.05).
Effect of Chronic Olanzapine on OGTT
Several OGTTs were performed after chronic olanzapine administration (e.g., 13 days). These animals had significant weight gain (control group, 252 ± 4.3 grams, n = 12 vs. olanzapine group, 272.3 ± 7.2 grams, n = 12). In view of this weight gain, it was surprising, though, that olanzapine-treated animals displayed a trend for lower, rather than higher, blood glucose values compared with control animals at all time-points (Figure 4, upper panel) because elevated glucoses were expected. Interestingly, the plasma insulin concentrations in the olanzapine group were significantly higher at several time-points, consistent with insulin resistance (Figure 4, lower panel). Accordingly, the olanzapine group displayed a significantly lower quantitative insulin sensitivity check index (29) (control group, 0.312 ± 0.009, n = 21 vs. olanzapine group, 0.290 ± 0.005, n = 23; p < 0.05), indicative of mild insulin resistance.
Figure 4.

Glucose tolerance after chronic olanzapine exposure. Rats were fasted overnight after chronic olanzapine administration and then challenged with an OGTT. A fasting blood glucose was taken at time zero, and glucose was administered by oral gavage immediately afterward. (Upper panel) Blood glucose measurements were taken at 30-minute intervals until 2 hours post-glucose gavage. Data are mean ± SE (n = 24). (Lower panel) Corresponding insulin concentrations were calculated for each time-point. Data are mean ± SE (n = 24). * Value significantly different from control (p < 0.05).
Other Peripheral Effects of Chronic Olanzapine
After receiving olanzapine for 19 days through oral gavage, animals were deprived of food overnight and then euthanized to obtain tissue and blood samples on Day 20. Figure 5 shows that gastrocnemius muscle weights were not significantly different between the control and drug groups (p = 0.85); however, weights of the parametrial fat pads were greater in the olanzapine-treated group (p < 0.01). Increased fat pad weight was also observed in studies terminated at 13 or 14 days using either female Sprague-Dawley or Wistar rats; the weight gain side effect was equally severe in both rat strains (data not shown).
Figure 5.

Effect of chronic olanzapine exposure on tissue weights in rats. Animals received olanzapine (4 mg/kg) through oral gavage (Olz) or saline (Con) for 20 days. Tissues were collected and weighed after an overnight fast on Day 20. Data represent mean weight ± SE (n = 8). Gastroc, gastrocnemius. * Results significantly different from control (p < 0.05).
The increase in adipose tissue mass with chronic administration of olanzapine was associated with an increase in plasma leptin (Table 1). Chronic olanzapine had no significant effect on two other obesity-related hormones; neither adiponectin nor the active form of ghrelin was affected (Table 1), nor were any significant changes observed in plasma triglycerides, very low-density lipoprotein cholesterol, or FFAs. The lack of changes in the lipid profiles (Table 1) suggests that even though these animals are obese, they have not developed the metabolic syndrome.
Table 1.
Plasma chemistries after chronic olanzapine treatment
| Parameter (units) | Strain (treatment day) | Condition | Values |
|---|---|---|---|
| Leptin (ng/mL) | Sprague-Dawley (20) | Control | 0.7 ± 0.1 |
| Olanzapine | 1.6 ± 0.4* | ||
| Ghrelin (active) (pg/mL) | Wistar (14) | Control | 198.1 ± 38.7 |
| Olanzapine | 223.3 ± 26.6 | ||
| Olanzapine + topiramate | 209.8 ± 23.0 | ||
| ALT (U/L) | Wistar (14) | Control | 56 ± 3 |
| Olanzapine | 58 ± 5 | ||
| AST (U/L) | Wistar (14) | Control | 245 ± 19 |
| Olanzapine | 244 ± 34 | ||
| Albumin (g/dL) | Wistar (14) | Control | 3.7 ± 0.1 |
| Olanzapine | 3.9 ± 0.2 | ||
| Adiponectin (μg/mL) | Sprague-Dawley (20) | Control | 5.4 ± 0.4 |
| Olanzapine | 6.0 ± 0.4 | ||
| Triglycerides (mg/dL) | Sprague-Dawley (13) | Control | 50 ± 2 |
| Olanzapine | 52 ± 2 | ||
| Very low-density lipoprotein cholesterol (mg/dL) | Sprague-Dawley (13) | Control | 10.0 ± 0.5 |
| Olanzapine | 10.5 ± 0.5 | ||
| FFAs (mEq/L) | Sprague-Dawley (13) | Control | 0.9 ± 0.1 |
| Olanzapine | 0.8 ± 0.1 |
ALT, alanine aminotransferase; AST, aspartate aminotransferase; FFA, free fatty acid.
Statistical significance (p < 0.05).
A small, but statistically significant, increase in liver wet weight was routinely observed (p = 0.02), irrespective of strain or route of drug administration (e.g., Figure 5). Although no gross morphological abnormalities were noted in the livers, there was concern that the drug might be eliciting some hepatic toxicity or steatosis. This possibility was investigated, in part, by measuring liver enzymes and albumin (a measure of visceral protein synthesis from liver). As shown in Table 1, we observed no significant changes in albumin, ALT (also known as serum glutamic pyruvate transaminase), or AST (also known as serum glutamic oxaloacetic transaminase). Microscopic analysis of fixed and hematoxylin and eosin- and oil red O-stained liver slices indicated no microscopic pathology or hepatic steatosis that could readily explain the increase in liver wet weight with olanzapine. Because olanzapine is metabolized through the hepatic P450 system, the small increase in liver wet weight with chronic drug administration may reflect induction of P450 enzymes and concurrent elevation of the mass of the microsomal fraction.
Effect of Chronic Olanzapine Treatment on Central Dopamine Pathways
In addition to characterizing peripheral changes in the model, we also investigated central dopaminergic pathways. Dopamine has been considered as a critical neural substrate for reward-guided behaviors (30–32). To determine the involvement of central dopamine in olanzapine-induced weight gain, autoradiography binding of the D2 receptor (D2/D3 subtype) was performed in dopaminergic areas involved in feeding behavior. In particular, D2 receptor density was quantified in the ventral striatum, representative of the terminal fields of the motor and motivational systems. Alterations of dopamine, specifically decreases in D2 receptor function (i.e., binding and sensitivity), in these areas have been associated with the self-administration of natural and drug rewards (e.g., cocaine, alcohol) and have been implicated in obesity (31).
Because olanzapine blocks dopamine receptors, it is conceivable that modulating those pathways may result in hyperphagia. To test this possibility, central nervous system dopamine receptors were quantified by autoradiography. [125I]-iodosulpride D2-labeled binding was analyzed in the dorsal and ventral striatum and in the ventral medial and ventral lateral midbrain. Binding was performed at Bmax concentrations of the ligand so that any changes observed would be more likely to reflect changes in receptor number rather than affinity. Absolute D2 receptor binding for each brain region and group is shown in Table 2; the detailed method of statistical analysis is described by Bello et al. (24). Absolute binding was significant for treatment, brain region, and their interaction (p < 0.05). Post hoc tests revealed that absolute binding in the DLS of the olanzapine group (30.77 ± 1.56 fmol/mg tissue equivalent) was significantly higher than that of the control group (25.67 ± 1.26 fmol/mg tissue equivalent; p < 0.001). Not surprisingly, D2 receptor binding in the DLS (olanzapine group) was higher than in any other brain region (p < 0.05). When this binding was taken as a percentage of the saline controls, the percentage binding was still higher in the olanzapine group compared with the control group (p < 0.05). The olanzapine group’s percentage binding was higher in all brain regions, except in the SNpc (97.90 ± 4.57%). Post hoc tests again revealed a significant difference in the percentage binding in the DLS for the olanzapine group (119.88 ± 6.01%) compared with saline control (p < 0.05). No significant difference was observed in percentage binding between brain regions or their interaction. In summary, findings from the dopamine D2 receptor binding assays suggest that in this model, the effects of olanzapine treatment on the dopamine system were rather limited to an overall compensatory response, with the dominant effect being on the dorsal striatum, and caused no significant changes within the reward-related circuitry (i.e., NAcc, VTA). On this basis, one may conclude that the observed hyperphagia in this model was not the direct consequence of the dopaminergic side effect of olanzapine resulting in altered motivational control of intake.
Table 2.
Absolute binding of [125I]-iodosulpride in the striatum and midbrain regions of chronic olanzapine- and control-treated rats
| Treatment |
||
|---|---|---|
| Brain regions | Olanzapine (n = 12) | Saline (n = 12) |
| NAcc shell | 15.00 ± 0.58 | 13.65 ± 0.87 |
| NAcc core | 15.90 ± 0.74 | 14.10 ± 0.66 |
| VTA (r) | 5.08 ± 0.26 | 4.87 ± 0.46 |
| VTA (c) | 7.66 ± 0.24 | 7.04 ± 0.26 |
| DLS | 30.77 ± 1.56* | 25.67 ± 1.26 |
| SNpc | 7.56 ± 0.35 | 7.72 ± 0.36 |
Binding is expressed in femtomoles per milligram of tissue equivalent ± SE. NAcc shell, nucleus accumbens shell region; NAcc core, nucleus accumbens core region; VTA (r), ventral tegmental area, rostral expanse; VTA (c), ventral tegmental, caudal expanse; DLS, dorsolateral striatum; SNpc, substania nigra pars compacta.
p < 0.001 significantly different from saline group.
Effect of Topiramate on Olanzapine-Induced Weight Gain
A characteristic of atypical antipsychotic drug-induced obesity in humans is that it can be reversed by topiramate co-administration (17,18,21,33). Therefore, the effect of topiramate on the olanzapine-induced weight gain was investigated in the rats. Animals were provided with cookie dough containing olanzapine (4 mg/kg per day) with or without topiramate (100 mg/kg per day) or cookie dough alone (control). Each form of the dough was completely consumed (data not shown). As can be seen in Figure 6 (upper panel), olanzapine and topiramate co-administration resulted in less weight gain than olanzapine alone. Figure 6 (lower panel) shows that olanzapine caused a significant increase in adipose tissue content relative to control, in agreement with the results shown in Figure 5. Animals receiving olanzapine and topiramate had a significantly lower amount of fat tissue compared with animals receiving olanzapine alone (Figure 6, lower panel). Thus, topiramate was effective at reducing adiposity caused by olanzapine in the rat.
Figure 6.
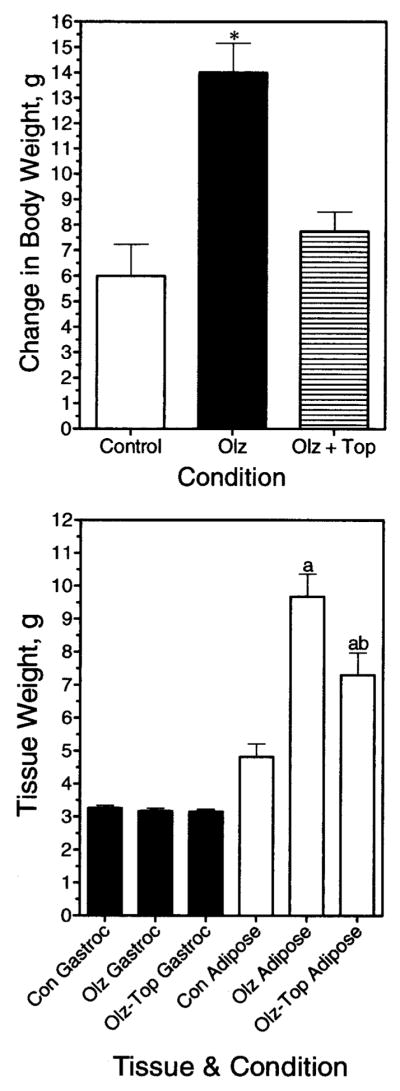
Topiramate blunts the olanzapine-induced weight gain in rats. Animals received olanzapine (Olz), olanzapine + topiramate (Olz + Top), or cookie dough alone (Control), as indicated. (Upper panel) Change in body weight after 5 days of treatment was determined for each condition. Data represent mean weight ± SE. * Result significantly different from control (p < 0.05). (Lower panel) Effects of drugs on tissue weights. Data represent mean weight ± SE (n = 8 per group). (a) Significantly different from the control condition. (b) Significantly different from animals receiving only olanzapine. Gastroc, gastrocnemius.
Effects of Acute Olanzapine Administration
Olanzapine did not elicit a statistically significant increase in food intake during the first 24 hours of drug administration in any of our studies. An increase was usually detectable on the 2nd day, and generally reached a maximum by the 3rd day. We posited that metabolic changes might be detectable in the animals that preceded the hyperphagia and would be uncomplicated by different food intake. To examine this possibility, animals were treated acutely with drug or vehicle and food deprived according to the dosing schedule described in “Research Methods and Procedures.” In the first 24 hours, food was provided to both groups of animals. During that first 24 hours, the amount of food eaten was not significantly different (control group, 16.13 ± 0.903 grams of food, n = 23 vs. olanzapine group, 18.22 ± 0.703 grams of food, n = 23; p > 0.05). On the 2nd day of treatment, animals continued on the drug but were food deprived for 5 hours before an OGTT was performed (Figure 7). The basal and peak glucose concentrations were significantly lower in the olanzapine group compared with the control group (Figure 7, upper panel). The increase in plasma insulin in response to a glucose challenge was also blunted. The quantitative insulin sensitivity check index indicated that groups did not differ in insulin sensitivity (control group, 0.294 ± 0.006, n = 22 vs. olanzapine group, 0.307 ± 0.005, n = 19; p > 0.05). The areas under the glucose tolerance test curves were also not significantly different between the olanzapine and control groups (data not shown).
Figure 7.

Glucose tolerance after acute olanzapine exposure. Rats received four doses of olanzapine divided over a 29-hour period. An OGTT was performed after a 5-hour fast. Blood glucose (upper panel) and insulin (lower panel) measurements are shown. Data are mean ± SE (n = 19 or 22). * Values statistically different from control (p < 0.05).
Plasma from the OGTT was used to measure other endpoints, namely plasma leptin and active ghrelin. In the olanzapine group, the mean concentration of the satiety hormone leptin was significantly depressed compared with the control animals (Figure 8). In regards to ghrelin, increases in active ghrelin have been reported to stimulate appetite; however, ghrelin was actually decreased in animals receiving olanzapine. Active ghrelin in plasma from control animals (n = 23) contained 51.9 ± 3.0 pg/mL, whereas plasma from olanzapine-treated animals (n = 23) contained 43.2 ± 2.2 pg/mL (p < 0.05). In contrast, plasma albumin concentrations did not differ significantly (p = 0.755) between control (3.50 ± 0.07 g/dL, n = 23) and olanzapine-treated (3.46 ± 0.10 g/dL, n = 23) animals. Leptin was also measured at the 90-minute time-point of the OGTT (Figure 8). Plasma leptin in the olanzapine group increased at the 90-minute time-point; however, this elevated leptin was still significantly lower than the basal leptin measurement in the control animals.
Figure 8.

Plasma leptin before and 90 minutes after an IP glucose injection. Rats received olanzapine (4 mg/kg IP) acutely. Plasma leptin was measured before and at 90 minutes post-glucose injection in animals receiving either olanzapine or saline (Control) through oral gavage, as indicated. Data are represented as mean ± SE (n = 21 to 23). (a) Significantly different compared with control animals at time zero. (b) Significantly different compared with olanzapine-receiving animals at time zero.
To address the specificity of the acute lowering of leptin and glucose, we acutely treated animals with either olanzapine (which did increase body weight) or the same dose of the chemically and pharmacologically related compound, clozapine (which did not increase body weight gain in the rat). Clozapine failed to lower the plasma glucose (data not shown) or lower leptin, whereas olanzapine did (Figure 9). Topiramate added together with olanzapine did not affect the glucose (data not shown) or leptin significantly (Figure 9). Thus, topiramate’s attenuation of food intake and body weight gain is unrelated to this early effect of olanzapine.
Figure 9.
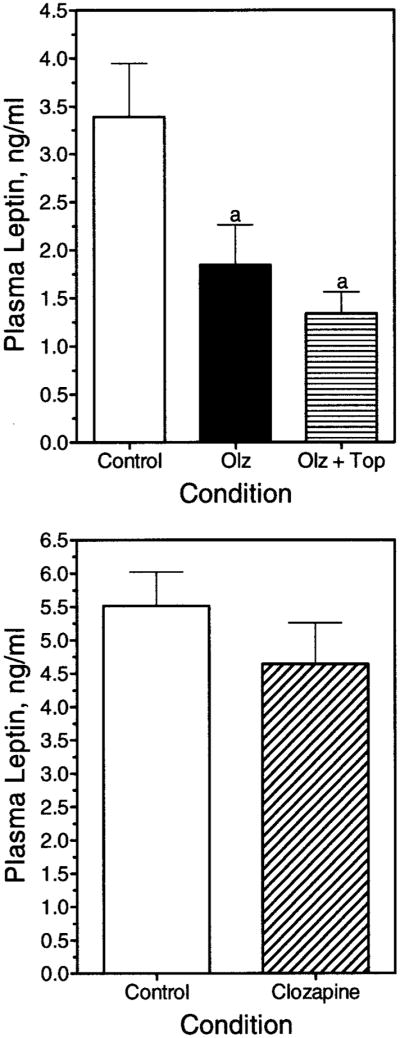
Plasma leptin concentrations after acute olanzapine, olanzapine and topiramate, or clozapine exposure. Rats received vehicle (Control), olanzapine (Olz), or olanzapine and topiramate (Olz + Top) through oral gavage (upper panel) or clozapine through oral gavage (lower panel), and plasma leptin concentration was determined after a 5-hour fast. Data are represented as mean ± SE. (a) Significantly different from the control group (p < 0.05).
Discussion
In this paper, we have characterized an animal model of atypical antipsychotic drug-induced obesity in which the drug is provided by self-administration in a food treat. The obesity was verified by increased adipose tissue mass, and several features we observed in animals are similar to the human side effect. These are hyperphagia (10,11,34), hyperleptinemia (e.g., 14,15), hyperinsulinemia/insulin resistance (35), and antagonism by topiramate (17–21). The olanzapine-induced hyperphagia that we observed is also in agreement with other reports where the drug was injected (e.g., 26,27) and from many studies in humans. Thus, this self-administration model appears to be relevant in several respects to the obesity observed in humans taking olanzapine. Interestingly, 2 to 3 weeks of drug treatment did not lead to diabetes or plasma lipid abnormalities associated with the metabolic syndrome; therefore, this model represents a less complicated form of obesity compared with other animal models. We not only characterized potential changes in the animals after weight gain, changes that have not, to our knowledge, been reported previously, but also determined acute changes. Thus, another new finding is that olanzapine has three, possibly related, acute metabolic effects preceding hyperphagia; these include hypoleptinemia with food deprivation, blunted response of insulin and leptin during a glucose challenge, and acute hypoglycemia with food deprivation. It is posited that these observations, although correlative, could be related to the drug-induced overeating and consequent weight gain observed in the rats. However, additional acute studies are now needed to probe the mechanism and relevance of these changes to the proceeding hyperphagia. Because olanzapine-induced obesity ultimately results in apparent hyperleptinemia and insulin resistance similar to humans, a model in which low leptin, insulin, and glucose are responsible for the hyperphagia could potentially explain the mechanism by which the drug effects seem to become saturable with time. That is, eventually, the excessive fat accumulation caused by overeating compensates for the decreases in leptin, insulin, and glucose by contributing to an eventual increase in their respective plasma concentrations.
To our knowledge, this is the first report of olanzapine-induced acute hypoleptinemia, despite several laboratories reporting weight gain effects of olanzapine in animals (26,28,36) and humans (e.g., 14,15). Acute hypoleptinemia could potentially contribute to the hyperphagia because increases in plasma leptin inhibit feeding in rats (e.g., 37,38). Further studies are needed, however, to determine whether that reduction in leptin is sufficient to stimulate food intake. Clinical reports have previously proposed a causal relationship between leptin and atypical antipsychotic-induced weight gain; however, in contrast to our findings, these suggest that olanzapine increases plasma leptin, which precedes weight gain (39,40). Other literature does not support this claim (for review, see 9), and clearly our findings demonstrate that, in the rat, olanzapine causes acute decreases, not increases, in plasma leptin that precede the hyperphagia and subsequent weight gain. Thus, it would be of interest to see whether olanzapine acutely lowers leptin in humans, or, for that matter, if humans taking olanzapine have appropriate plasma leptin concentrations for their given fat mass. In at least one study where the latter was addressed, leptin concentrations were determined to be lower in patients receiving olanzapine than was expected based on BMI (15).
Active ghrelin was not increased in this model, as might have been expected if it were involved in the hyperphagic mechanism. Accordingly, active ghrelin measured in chronic studies showed no significant differences. Although olanzapine effects on ghrelin have been reported in humans, the results have been inconsistent (11,16).
We observed that animals administered olanzapine for brief periods had blunted responses of insulin and leptin to a glucose challenge. Again, insulin and leptin are satiety factors, and these observations merit further experimental investigation to determine their potential role in the increased food intake observed in this model. The generalized decrease in leptin and the sustained decrease after a glucose overload may be secondary to a generalized lowering of the basal glucose and insulin concentrations, which are known regulators of leptin secretion. However, other factors might also be responsible; thus, further studies are needed.
Lastly, the apparent metabolic partitioning of glucose in the olanzapine-treated animals needs to be investigated as a potential third factor impacting the drug-induced hyperphagia. Olanzapine caused a greater reduction of plasma glucose after food deprivation, which led to an attenuated rise of glucose in response to a challenge, consistent with at least one clinical report where olanzapine administration correlated with hypoglycemia (41). No acute changes in insulin-mediated glucose disposal were observed, as evidenced by equal areas under the OGTT curves. Because plasma glucose concentration is a known direct and indirect regulator of satiety (e.g., 42,43), it is tempting to speculate that the changes in plasma glucose contribute to the decreased satiety and increased food intake we observed. Interestingly, this acute effect of olanzapine to lower plasma glucose after food deprivation (Figure 7) also appears as a non-statistically significant trend in the chronic setting (Figure 4), a time during drug exposure where we would have expected marked elevation of plasma glucose given the increased fat mass of the olanzapine-treated animals. It should be noted that a similar effect on plasma glucose also has been reported in rats with the atypical antipsychotic sulpiride (44), supporting one possible mechanistic commonality between the weight gain effects of these two different antipsychotic drugs.
Olanzapine-Induced Obesity in Rats as a Model for the Human Side Effect
Currently, the relevance of this model to the human side effect is unclear. Several findings have been supportive of the idea (26,45,46); however, the ability of haloperidol to also cause obesity in rats, but not in humans, is non-supporting (27). The sexual dimorphism of the obesity in rats also argues against human relevance. Our data, and those from other groups, indicate that olanzapine stimulates weight gain only in female rats. In contrast to our model, olanzapine causes weight gain in both human sexes. The reason for this sexual dimorphism in rats is presently unclear and could be related to several factors. A sex-specific response to hyperprolactinemia appears to have a profound impact on food intake in the female rat (47); however, reports investigating the involvement of olanzapine-induced hyperprolactinemia on weight gain conclude that it is likely not involved (25,48). A second factor may be that weight changes are harder to detect in male rats, whereas humans and female rats are more weight stable; therefore, weight changes are easier to discern. Thirdly, there is an apparent sexual dimorphism in plasma leptin, which may differ in humans and rats depending on age or stage in the estrous cycle, although reports of this dimorphism have been conflicting (49–51). Female rats seem to be more sensitive to centrally administered leptin (52) and may be more sensitive to fluctuations in circulating concentrations. Nevertheless, only one report has examined the sexual dimorphism of atypical antipsychotic-induced weight gain in rats. The effects of sulpiride in male rats suggested that chronic sulpiride induced insulin resistance, unlike its effect in female rats (53). These findings, though, may not be applicable to other antipsychotics because it is not known if all antipsychotics share a common weight gain mechanism. To date, such effects have not been reported in male rats receiving olanzapine.
In contrast to olanzapine treatment, we did not observe an effect of clozapine on weight gain in rats. This was surprising because clozapine is a congener of olanzapine and has a reported weight gain side effect in humans. Although our findings are in agreement with another group (54), this is admittedly in contrast to the human situation. It should be noted that the therapeutic dose of clozapine in humans is typically 10 times higher than that of olanzapine. This would translate into a 40 to 50 mg/kg daily dose of clozapine in rats. However, even doses one-half as much produce a severe sedation. At these doses, the animals were too sedated to eat and subsequently lost weight (preliminary studies). Consequently, it may not be the obesity side effect that is different, but rather the sedation side effect. In this regard, it should be recognized that clozapine and olanzapine are unselective and bind with high affinity to several G-protein-coupled receptors, albeit with different potencies, and both antagonize receptors for several biogenic amines in mammals (55). The potency at these receptors varies for each compound and differs between human and rat depending on the receptor involved. For example, although clozapine and olanzapine are approximately equipotent at D1 and D4 dopamine receptors, differences have been noted for the α2-adrenergic, muscarinic, and serotonin2 receptors (7).
Several observations were consistent with the atypical antipsychotic-induced obesity in humans. Thus, hyperphagia (34), chronic hyperleptinemia, and hyperinsulinemia have all been observed in humans taking olanzapine (e.g., 14,15). Another interesting characteristic of the side effect in humans that we observed in our model is attenuation by topiramate (17,18,21,33). The effects of topiramate, together with other aspects of the obesity (e.g., hyperphagia), have parallels to the human side effect. These findings suggest that this model may not only be relevant for study of the human side effect, but the model may also be a valuable, rapid, and inexpensive approach for screening potential antiobesity drugs. Further studies are required to elucidate the reasons for the observed differences between humans and rats. We speculate that acute studies may be the key to understanding these differences.
Other Potential Effects of Olanzapine Investigated
In this study, olanzapine caused weight gain and increased D2 receptor binding in DLS but not in the ventral striatum (i.e., shell and core of the NAcc) or in the somatodendritic domains of both nigrostriatal and mesoaccumbens dopamine projections (i.e., in the substania nigra or the VTA, respectively). This increase in D2 receptor binding most likely resulted from the direct pharmacological effect of olanzapine but does not exclude the involvement of other neurotransmitters and neuromodulators (11,32). For example, in patients treated with olanzapine (>14 days), it has been demonstrated using single photon emission computerized tomography and positron emission tomography that olanzapine causes a significant amount of striatal D2 receptor occupancy, e.g., 46% to 82%; (56,57). In addition, chronic (28 days) subcutaneous delivery of olanzapine through an osmotic pump in rats resulted in an increase in D2 but not D3 receptor binding in the DLS and the NAcc. Although they account for a small percentage of total D2 receptor binding in the striatum (~15%), D4 receptor bindings were also increased in the DLS and NAcc in another study (58). Together, these studies suggest that chronic treatment with olanzapine results in an increase in occupancy and up-regulation of D2 receptors. It is conceivable that this increased D2 receptor binding and subsequent activity may lead to an increase also in food intake with consequent weight gain.
In contrast, using positron emission tomography, Wang et al. (31) reported that striatal D2 receptor availability is lower in morbidly obese individuals compared with normal-weight controls, whereas body mass is negatively correlated with D2 receptor availability. This finding does not necessarily contradict our observation that olanzapine treatment caused increased D2 receptor binding. First, in individuals with a long history of obesity and potential inherited factors (see the second point below), an adaptation to the dopamine system may occur. In fact, decreased D2 receptor availability could result from dietary constraints and feeding patterns, rather than directly from weight gain. In a study by the Hoebel laboratory (59), it was shown that restrictive feeding in rats with a 12-hour daily access to glucose and chow for 30 days resulted in a decrease in D2 receptor binding in the ventral and dorsal striatum. We also demonstrated that rats with daily limited access (i.e., 20 minutes) to sucrose over a 7-day feeding regimen showed decreased D2 dopamine receptor binding in the NAcc shell and DLS compared with rats that had limited access to just food (24). The second potential difference between development of chronic and acute (e.g., drug or diet-induced) obesity is that although the latter does not assume preexisting genetic conditions, inheriting variants of dopamine may be causally related to some forms of obesity. For example, it has been suggested that the Taq IA and Ser311Cys polymorphisms in the D2 receptor gene are associated with obesity (60,61). Future studies should focus on the early affects of olanzapine preceding the hyperphagia. Overall, except for the increase in the DLS, which was not studied previously, these findings are essentially in agreement with Wurtman’s group (26) and suggest that the observed overeating may not be a direct consequence of changes in the motivational dopamine system (i.e., mesoaccumbens dopamine system) but could be an indirect consequence of changes in the motoric dopamine system (i.e., nigrostriatal dopamine system).
Other results from the present studies indicate that the obesity in the olanzapine-treated animals is uncomplicated, at least in the first few weeks of treatment, by significant metabolic syndrome or diabetes. In support of this, we did not see any changes in adiponectin or the lipid profiles. Thus, over the time course we studied, this model appears to be an uncomplicated form of obesity. It must be noted, though, that Sprague-Dawley and Wistar rats are resistant to atherosclerosis and other lipid complications (62), making this model unsuitable for studies of the lipid abnormalities associated with atypical antipsychotics.
Conclusion
Our results indicate that an acute lowering of plasma leptin and glucose/insulin concentrations occurs before olanzapine-induced overeating and obesity in rats. These changes, revealed by brief food deprivation, require further investigation to define their potential relevance to increased hunger and decreased satiety in the rat. A blunted increase in glucose, insulin, and leptin on glucose challenge was also observed, which could also potentially contribute to the hyperphagia in this model. These effects were not observed with the same dose of the structurally related compound clozapine, which had no effect on body weight. Several aspects of the obesity seen in rats are similar to the obesity observed in humans taking olanzapine. Future studies should focus on the acute effects of the drug in humans and rats, the mechanism of leptin regulation (e.g., transcriptional or translational), the central or peripheral nature of the drug effects, and whether or not these effects on leptin represent a direct effect on adipose tissue or are secondary to a leptin regulator.
Acknowledgments
We thank Jochen Antel (Hannover, Germany), Ralph Norgen (Hershey, PA), and Johannes Hebebrand (Marburg, Germany) for their advice on this project. We also thank Aaron Moyer and Brandon Tabbutt for technical assistance in animal monitoring and dosing in some of the early animal studies. This project was funded, in part, by a grant from the Pennsylvania Department of Health using Tobacco Settlement Funds. The Department of Health specifically disclaims responsibility for any analyses, interpretations, or conclusions. This work was also supported by NIH Grants DK053843 and DK062880 (C.J.L.), and DK 065709 (A.H.).
Footnotes
Nonstandard abbreviations: D2, type 2 dopamine; IP, intraperitoneal(ly); OGTT, oral glucose tolerance test; ALT, alanine aminotransferase; AST, aspartate aminotransferase; FFA, free fatty acid; NAcc, nucleus accumbens; VTA, ventral tegmental area; SNpc, substantia nigra pars compacta; RT, room temperature; DLS, dorsolateral striatum.
References
- 1.Kapur S, Remington G. Atypical antipsychotics: new directions and new challenges in the treatment of schizophrenia. Annu Rev Med. 2001;52:503–17. doi: 10.1146/annurev.med.52.1.503. [DOI] [PubMed] [Google Scholar]
- 2.Fulton B, Goa KL. Olanzapine: a review of its pharmacological properties and therapeutic efficacy in the management of schizophrenia and related psychoses. Drugs. 1997;53:281–98. doi: 10.2165/00003495-199753020-00007. [DOI] [PubMed] [Google Scholar]
- 3.Schotte A, Janssen PF, Gommeren W, et al. Risperidone compared with new and reference antipsychotic drugs: in vitro and in vivo receptor binding. Psychopharmacology (Berl) 1996;124:57–73. doi: 10.1007/BF02245606. [DOI] [PubMed] [Google Scholar]
- 4.Green B. Focus on olanzapine. Curr Med Res Opin. 1999;15:79–85. doi: 10.1185/03007999909113367. [DOI] [PubMed] [Google Scholar]
- 5.Hale AS. Olanzapine. Br J Hosp Med. 1997;58:442–5. [PubMed] [Google Scholar]
- 6.Casey DE. The relationship of pharmacology to side effects. J Clin Psychiatry. 1997;58(Suppl 10):55–62. [PubMed] [Google Scholar]
- 7.Baldessarini RJ, Tarazi FI. Goodman & Gilman’s The Pharmacological Basis of Therapeutics. 10. New York: McGraw-Hill Medical Publishing Division; 2001. Drugs and the treatment of psychiatric disorders; pp. 485–520. [Google Scholar]
- 8.Toren P, Ratner S, Laor N, Weizman A. Benefit-risk assessment of atypical antipsychotics in the treatment of schizophrenia and comorbid disorders in children and adolescents. Drug Saf. 2004;27:1135–56. doi: 10.2165/00002018-200427140-00005. [DOI] [PubMed] [Google Scholar]
- 9.Baptista T, Beaulieu S. Are leptin and cytokines involved in body weight gain during treatment with antipsychotic drugs? Can J Psychiatry. 2002;47:742–9. doi: 10.1177/070674370204700805. [DOI] [PubMed] [Google Scholar]
- 10.Kinon BJ, Basson BR, Gilmore JA, Tollefson GD. Long-term olanzapine treatment: weight change and weight-related health factors in schizophrenia. J Clin Psychiatry. 2001;62:92–100. [PubMed] [Google Scholar]
- 11.Murashita M, Kusumi I, Inoue T, et al. Olanzapine increases plasma ghrelin level in patients with schizophrenia. Psychoneuroendocrinology. 2005;30:106–10. doi: 10.1016/j.psyneuen.2004.05.008. [DOI] [PubMed] [Google Scholar]
- 12.Gothelf D, Falk B, Singer P, et al. Weight gain associated with increased food intake and low habitual activity levels in male adolescent schizophrenic inpatients treated with olanzapine. Am J Psychiatry. 2002;159:1055–7. doi: 10.1176/appi.ajp.159.6.1055. [DOI] [PubMed] [Google Scholar]
- 13.Baptista T, Zarate J, Joober R, et al. Drug induced weight gain, an impediment to successful pharmacotherapy: focus on antipsychotics. Curr Drug Targets. 2004;5:279–99. doi: 10.2174/1389450043490514. [DOI] [PubMed] [Google Scholar]
- 14.Graham KA, Perkins DO, Edwards LJ, et al. Effect of olanzapine on body composition and energy expenditure in adults with first-episode psychosis. Am J Psychiatry. 2005;162:118–23. doi: 10.1176/appi.ajp.162.1.118. [DOI] [PubMed] [Google Scholar]
- 15.Haupt DW, Luber A, Maeda J, et al. Plasma leptin and adiposity during antipsychotic treatment of schizophrenia. Neuropsychopharmacology. 2005;30:184–91. doi: 10.1038/sj.npp.1300563. [DOI] [PubMed] [Google Scholar]
- 16.Togo T, Hasegawa K, Miura S, et al. Serum ghrelin concentrations in patients receiving olanzapine or risperidone. Psychopharmacology (Berl) 2004;172:230–2. doi: 10.1007/s00213-003-1642-4. [DOI] [PubMed] [Google Scholar]
- 17.Vieta E, Sanchez-Moreno J, Goikolea JM, et al. Effects on weight and outcome of long-term olanzapine-topiramate combination treatment in bipolar disorder. J Clin Psychopharmacol. 2004;24:374–8. doi: 10.1097/01.jcp.0000130556.01373.45. [DOI] [PubMed] [Google Scholar]
- 18.Baptista T, Kin NM, Beaulieu S, de Baptista EA. Obesity and related metabolic abnormalities during antipsychotic drug administration: mechanisms, management and research perspectives. Pharmacopsychiatry. 2002;35:205–19. doi: 10.1055/s-2002-36391. [DOI] [PubMed] [Google Scholar]
- 19.Levy E, Margolese HC, Chouinard G. Topiramate produced weight loss following olanzapine-induced weight gain in schizophrenia. J Clin Psychiatry. 2002;63:1045. doi: 10.4088/jcp.v63n1116a. [DOI] [PubMed] [Google Scholar]
- 20.Dursun SM, Devarajan S. Clozapine weight gain, plus topiramate weight loss. Can J Psychiatry. 2000;45:198. [PubMed] [Google Scholar]
- 21.Navarro V, Pons A, Romero A, Bernardo M. Topiramate for clozapine-induced seizures. Am J Psychiatry. 2001;158:968–9. doi: 10.1176/appi.ajp.158.6.968-a. [DOI] [PubMed] [Google Scholar]
- 22.Appolinario JC, Fontenelle LF, Papelbaum M, Bueno JR, Coutinho W. Topiramate use in obese patients with binge eating disorder: an open study. Can J Psychiatry. 2002;47:271–3. doi: 10.1177/070674370204700309. [DOI] [PubMed] [Google Scholar]
- 23.Sokoloff P, Giros B, Martres MP, et al. Localization and function of the D3 dopamine receptor. Arzneimittelforschung. 1992;42:224–30. [PubMed] [Google Scholar]
- 24.Bello NT, Lucas LR, Hajnal A. Repeated sucrose access influences dopamine D2 receptor density in the striatum. Neuroreport. 2002;13:1575–8. doi: 10.1097/00001756-200208270-00017. [DOI] [PMC free article] [PubMed] [Google Scholar]
- 25.Fell MJ, Marshall KM, Williams J, Neill JC. Effects of the atypical antipsychotic olanzapine on reproductive function and weight gain in female rats. J Psychopharmacol. 2004;18:149–55. doi: 10.1177/0269881104042613. [DOI] [PubMed] [Google Scholar]
- 26.Arjona AA, Zhang SX, Adamson B, Wurtman RJ. An animal model of antipsychotic-induced weight gain. Behav Brain Res. 2004;152:121–7. doi: 10.1016/j.bbr.2003.09.040. [DOI] [PubMed] [Google Scholar]
- 27.Pouzet B, Mow T, Kreilgaard M, Velschow S. Chronic treatment with antipsychotics in rats as a model for antipsychotic-induced weight gain in human. Pharmacol Biochem Behav. 2003;75:133–40. doi: 10.1016/s0091-3057(03)00042-x. [DOI] [PubMed] [Google Scholar]
- 28.Goudie AJ, Smith JA, Halford JC. Characterization of olanzapine-induced weight gain in rats. J Psychopharmacol. 2002;16:291–6. doi: 10.1177/026988110201600402. [DOI] [PubMed] [Google Scholar]
- 29.Katz A, Nambi SS, Mather K, et al. Quantitative insulin sensitivity check index: a simple, accurate method for assessing insulin sensitivity in humans. J Clin Endocrinol Metab. 2000;85:2402–10. doi: 10.1210/jcem.85.7.6661. [DOI] [PubMed] [Google Scholar]
- 30.Hajnal A, Norgren R. Accumbens dopamine mechanisms in sucrose intake. Brain Res. 2001;904:76–84. doi: 10.1016/s0006-8993(01)02451-9. [DOI] [PubMed] [Google Scholar]
- 31.Wang GJ, Volkow ND, Logan J, et al. Brain dopamine and obesity. Lancet. 2001;357:354–7. doi: 10.1016/s0140-6736(00)03643-6. [DOI] [PubMed] [Google Scholar]
- 32.Wang GJ, Volkow ND, Thanos PK, Fowler JS. Similarity between obesity and drug addiction as assessed by neurofunctional imaging: a concept review. J Addict Dis. 2004;23:39–53. doi: 10.1300/J069v23n03_04. [DOI] [PubMed] [Google Scholar]
- 33.Garnett WR. Clinical pharmacology of topiramate: a review. Epilepsia. 2000;41(Suppl 1):S61–5. doi: 10.1111/j.1528-1157.2000.tb02174.x. [DOI] [PubMed] [Google Scholar]
- 34.Theisen FM, Linden A, Konig IR, et al. Spectrum of binge eating symptomatology in patients treated with clozapine and olanzapine. J Neural Transm. 2003;110:111–21. doi: 10.1007/s00702-002-0792-6. [DOI] [PubMed] [Google Scholar]
- 35.Ebenbichler CF, Laimer M, Eder U, et al. Olanzapine induces insulin resistance: results from a prospective study. J Clin Psychiatry. 2003;64:1436–9. doi: 10.4088/jcp.v64n1206. [DOI] [PubMed] [Google Scholar]
- 36.Thornton-Jones Z, Neill JC, Reynolds GP. The atypical antipsychotic olanzapine enhances ingestive behaviour in the rat: a preliminary study. J Psychopharmacol. 2002;16:35–7. doi: 10.1177/026988110201600111. [DOI] [PubMed] [Google Scholar]
- 37.Bodosi B, Gardi J, Hajdu I, et al. Rhythms of ghrelin, leptin, and sleep in rats: effects of the normal diurnal cycle, restricted feeding, and sleep deprivation. Am J Physiol Regul Integr Comp Physiol. 2004;287:R1071–9. doi: 10.1152/ajpregu.00294.2004. [DOI] [PubMed] [Google Scholar]
- 38.Polson DA, Thompson MP. Macronutrient composition of the diet differentially affects leptin and adiponutrin mRNA expression in response to meal feeding. J Nutr Biochem. 2004;15:242–6. doi: 10.1016/j.jnutbio.2003.11.009. [DOI] [PubMed] [Google Scholar]
- 39.Melkersson KI, Hulting AL. Insulin and leptin levels in patients with schizophrenia or related psychoses: a comparison between different antipsychotic agents. Psychopharmacology (Berl) 2001;154:205–12. doi: 10.1007/s002130000639. [DOI] [PubMed] [Google Scholar]
- 40.Melkersson KI, Hulting AL, Brismar KE. Elevated levels of insulin, leptin, and blood lipids in olanzapine-treated patients with schizophrenia or related psychoses. J Clin Psychiatry. 2000;61:742–9. doi: 10.4088/jcp.v61n1006. [DOI] [PubMed] [Google Scholar]
- 41.Budman CL, Gayer AI. Low blood glucose and olanzapine. Am J Psychiatry. 2001;158:500–1. doi: 10.1176/appi.ajp.158.3.500-a. [DOI] [PubMed] [Google Scholar]
- 42.Mook DG, Dreifuss S, Keats PH. Satiety for glucose solution in rat: the specificity is postingestive. Physiol Behav. 1986;36:897–901. doi: 10.1016/0031-9384(86)90449-x. [DOI] [PubMed] [Google Scholar]
- 43.Moskowitz HR, Kumraiah V, Sharma KN, Jacobs HL, Sharma SD. Effects of hunger, satiety and glucose load upon taste intensity and taste hedonics. Physiol Behav. 1976;16:471–5. doi: 10.1016/0031-9384(76)90326-7. [DOI] [PubMed] [Google Scholar]
- 44.Baptista T, Contreras Q, Teneud L, et al. Mechanism of the neuroleptic-induced obesity in female rats. Prog Neuropsychopharmacol Biol Psychiatry. 1998;22:187–98. doi: 10.1016/s0278-5846(97)00101-2. [DOI] [PubMed] [Google Scholar]
- 45.Perrone JA, Chabla JM, Hallas BH, Horowitz JM, Torres G. Weight loss dynamics during combined fluoxetine and olanzapine treatment. BMC Pharmacol. 2004;4:27. doi: 10.1186/1471-2210-4-27. [DOI] [PMC free article] [PubMed] [Google Scholar]
- 46.Hartfield AW, Moore NA, Clifton PG. Effects of clozapine, olanzapine and haloperidol on the microstructure of ingestive behaviour in the rat. Psychopharmacology (Berl) 2003;167:115–22. doi: 10.1007/s00213-002-1368-8. [DOI] [PubMed] [Google Scholar]
- 47.Heil SH. Sex-specific effects of prolactin on food intake by rats. Horm Behav. 1999;35:47–54. doi: 10.1006/hbeh.1998.1495. [DOI] [PubMed] [Google Scholar]
- 48.Cooper GD, Pickavance LC, Wilding JP, Halford JC, Goudie AJ. A parametric analysis of olanzapine-induced weight gain in female rats. Psychopharmacology (Berl) 2005;181:80–9. doi: 10.1007/s00213-005-2224-4. [DOI] [PubMed] [Google Scholar]
- 49.Bagnasco M, Kalra PS, Kalra SP. Plasma leptin levels are pulsatile in adult rats: effects of gonadectomy. Neuroendocrinology. 2002;75:257–63. doi: 10.1159/000054717. [DOI] [PubMed] [Google Scholar]
- 50.Landt M, Gingerich RL, Havel PJ, et al. Radioimmunoassay of rat leptin: sexual dimorphism reversed from humans. Clin Chem. 1998;44:565–70. [PubMed] [Google Scholar]
- 51.Mulet T, Pico C, Oliver P, Palou A. Blood leptin homeostasis: sex-associated differences in circulating leptin levels in rats are independent of tissue leptin expression. Int J Biochem Cell Biol. 2003;35:104–10. doi: 10.1016/s1357-2725(02)00092-4. [DOI] [PubMed] [Google Scholar]
- 52.Clegg DJ, Riedy CA, Smith KA, Benoit SC, Woods SC. Differential sensitivity to central leptin and insulin in male and female rats. Diabetes. 2003;52:682–7. doi: 10.2337/diabetes.52.3.682. [DOI] [PubMed] [Google Scholar]
- 53.Baptista T, Lacruz A, Paez X, Hernandez L, Beaulieu S. The antipsychotic drug sulpiride does not affect bodyweight in male rats: is insulin resistance involved? Eur J Pharmacol. 2002;447:91–8. doi: 10.1016/s0014-2999(02)01816-2. [DOI] [PubMed] [Google Scholar]
- 54.Baptista T, Mata A, Teneud L, et al. Effects of long-term administration of clozapine on body weight and food intake in rats. Pharmacol Biochem Behav. 1993;45:51–4. doi: 10.1016/0091-3057(93)90084-7. [DOI] [PubMed] [Google Scholar]
- 55.Casey DE, Zorn SH. The pharmacology of weight gain with antipsychotics. J Clin Psychiatry. 2001;62(Suppl 7):4–10. [PubMed] [Google Scholar]
- 56.Frankle WG, Gil R, Hackett E, et al. Occupancy of dopamine D2 receptors by the atypical antipsychotic drugs risperidone and olanzapine: theoretical implications. Psychopharmacology (Berl) 2004;175:473–80. doi: 10.1007/s00213-004-1852-4. [DOI] [PubMed] [Google Scholar]
- 57.Tauscher J, Hussain T, Agid O, et al. Equivalent occupancy of dopamine D1 and D2 receptors with clozapine: differentiation from other atypical antipsychotics. Am J Psychiatry. 2004;161:1620–5. doi: 10.1176/appi.ajp.161.9.1620. [DOI] [PubMed] [Google Scholar]
- 58.Tarazi FI, Zhang K, Baldessarini RJ. Long-term effects of olanzapine, risperidone, and quetiapine on dopamine receptor types in regions of rat brain: implications for antipsychotic drug treatment. J Pharmacol Exp Ther. 2001;297:711–7. [PubMed] [Google Scholar]
- 59.Colantuoni C, Schwenker J, McCarthy J, et al. Excessive sugar intake alters binding to dopamine and mu-opioid receptors in the brain. Neuroreport. 2001;12:3549–52. doi: 10.1097/00001756-200111160-00035. [DOI] [PubMed] [Google Scholar]
- 60.Blum K, Braverman ER, Wood RC, et al. Increased prevalence of the Taq I A1 allele of the dopamine receptor gene (DRD2) in obesity with comorbid substance use disorder: a preliminary report. Pharmacogenetics. 1996;6:297–305. doi: 10.1097/00008571-199608000-00003. [DOI] [PubMed] [Google Scholar]
- 61.Jenkinson CP, Hanson R, Cray K, et al. Association of dopamine D2 receptor polymorphisms Ser311Cys and TaqIA with obesity or type 2 diabetes mellitus in Pima Indians. Int J Obes Relat Metab Disord. 2000;24:1233–8. doi: 10.1038/sj.ijo.0801381. [DOI] [PubMed] [Google Scholar]
- 62.Jokinen MP, Clarkson TB, Prichard RW. Animal models in atherosclerosis research. Exp Mol Pathol. 1985;42:1–28. doi: 10.1016/0014-4800(85)90015-2. [DOI] [PubMed] [Google Scholar]