

Abstract
T cell neoplasias are common in pediatric oncology, and include acute lymphoblastic leukemia (T-ALL) and lymphoblastic lymphoma (T-LBL). These cancers have worse prognoses than their B cell counterparts, and their treatments carry significant morbidity. While many pediatric malignancies have characteristic translocations, most T lymphocyte-derived diseases lack cytogenetic hallmarks. Lacking these informative lesions, insight into their molecular pathogenesis is less complete. Although dysregulation of the NOTCH1 pathway occurs in a substantial fraction of cases, many other genetic lesions of T cell malignancy have not yet been determined. To address this deficiency, we pioneered a phenotype-driven forward-genetic screen in zebrafish (Danio rerio). Using transgenic fish with T lymphocyte-specific expression of enhanced green fluorescent protein (EGFP), we performed chemical mutagenesis, screened animals for GFP+ tumors, and identified multiple lines with a heritable predisposition to T cell malignancy. In each line, patterns of infiltration and morphologic appearance resembled human T-ALL and T-LBL. T cell receptor analyses confirmed their clonality. Malignancies were transplantable and contained leukemia-initiating cells (LIC), like their human correlates. In summary, we have identified multiple zebrafish mutants that recapitulate human T cell neoplasia and show heritable transmission. These vertebrate models provide new genetic platforms for the study of these important human cancers.
Keywords: leukemia, lymphoma, zebrafish, T lymphocyte, genetic screen
Introduction
Over the past 50 years, acute lymphoblastic leukemia (ALL) treatment has improved dramatically. With the advent of current multi-agent chemotherapy, survival of pediatric patients with many forms of ALL has improved from single digits to over 80% (1, 2), but challenges remain. Though T cell ALL (T-ALL) comprises only 15% and 25% of pediatric and adult cases (3, 4), it carries a significantly worse prognosis, with pediatric cure rates of only 70% (5) and adult survival less than 40% (6, 7).
Lymphoblastic malignancies represent uncontrolled clonal proliferations of immature lymphocytes. In general, at least two mutational events must occur in the same pre-malignant cell: one arresting differentiation, and a second conferring a survival and/or proliferative advantage. In some cancers, both requirements are met by bi-allelic mutation of the same gene, termed “tumor suppressors.” In others, transformation is mediated by mutations to different genes, impacting multiple pathways. For hematologic neoplasia, cooperating genetic lesions of transcription factors, tyrosine kinases, and transcriptional co-activators often coincide (8).
T cell malignancies are molecularly heterogeneous, driven by a complex combination of genetic changes (9). To date, the identification of specific molecular alterations that underlie lymphocyte transformation has principally come from the discovery of aberrant chromosomal translocations and pathway activations in blast cells of ALL patients (10, 11). Although several informative translocations have been described (12), most cases lack pathognomonic cytogenetic changes (13, 14). Recent studies have clearly established roles for dysregulated transcription factors in T-ALL (9), but the genetic lesions underlying this dysregulation are unknown. However, one common perturbation in T-ALL has been found, as aberrant NOTCH1 activation is reported to occur in over 50% of human T-ALL patient samples and cell lines (15). Further studies in both murine and human T-ALL have identified the c-MYC proto-oncogene as a direct target of NOTCH1 (16). While these reports provide important insights into one subset of T-ALL, undoubtedly, other lesions underpinning T-ALL origin and progression have not yet been determined.
While considerable evidence supports the role of genetic modifiers as risk factors for leukemia, few heritable mutations conferring this risk are actually known (17, 18), with most associated with bone marrow failure syndromes. Outside of these examples, “pure familial leukemias” are quite rare, with few pedigrees transmitting disease as a Mendelian trait (19–21). Identification of the loci responsible for these familial cases would likely provide insight into oncogenic mechanisms at work in sporadic malignancies of the same type. However, with their small sample sizes, identifying genetic risk factors in human pedigrees has been challenging. Therefore, animal models of heritable leukemic-predisposition are both valuable and necessary.
Zebrafish are useful to study vertebrate development through mutational forward genetic approaches. They have also become popular models of human cancer, including hematologic neoplasia (22–24). Two important studies have used cell-specific over-expression of mammalian oncogenes to induce zebrafish T-ALL (25, 26). Both transgenic models bear striking resemblance to human disease. Their cancers are clonal, and originate in the thymus before spreading to peripheral blood. T-ALL cells from these fish efface the kidney-marrow, and can engraft in irradiated hosts. But while innovative models, these transgenic lines are restricted in scope to the known cancer pathways used to create them.
To date, zebrafish have not been used to pursue unknown genetic lesions underlying T cell malignancy. Here, we describe a phenotypic mutagenesis screen in a D. rerio line where the native p56lck promoter directs T cell-specific expression of enhanced green fluorescent protein (lck::EGFP). We report three different zebrafish mutants that develop heritable T cell malignancy. Each faithfully recapitulates human T-ALL and T-LBL in onset, invasion pattern, and morphology, and their neoplastic cells are clonal and transplantable. Moreover, cells can also be transplanted serially, suggesting the presence of leukemia-initiating cells (LIC). As the genetic factors that collaborate to cause these diseases are revealed, these new vertebrate models of TALL promise to provide exciting insights into this important class of human cancers.
Materials and Methods
Zebrafish Care and Maintenance
Fish were housed in a colony at 28.5°C on a 14/10 hour (hr) circadian cycle. For all procedures, fish were anesthetized with 0.02% tricaine methanesulfonate (MS222). Fish were handled per NIH guidelines, under a protocol approved by the University of Utah Animal Care and Use Committee (IACUC # 08-08005).
ENU Mutagenesis Screen
Male WIK strain lck::EGFP+/+ zebrafish were mutagenized with N-ethyl-N-nitrosourea (ENU) as described (27). Mutagenesis efficiency was assessed by non-complementation of the golden (gol) locus. Eggs from pigment-deficient gol/gol females were fertilized with sperm of mutagenized males. 0.1% of sperm genomes (n=4 400) had gol-inactivating lesions, a rate of 30 mutations per haploid genome. Mutagenized males were then bred to non-mutagenized WIK lck::EGFP+/+ females to create F1 generations for phenotypic screening by fluorescence microscopy.
Generation of Gynogenetic Diploids by Early Pressure (EP)
In vitro fertilization and pressure treatment were performed as described (28). Sperm was UV-treated with 7 × 10⁴ μ Joules using a Stratalinker (Stratagene, Cedar Creek, TX). Pressures and hydraulic press equipment were as reported (29).
Microscopy and Imaging
Fish were screened for abnormal GFP patterns at 6 days (d), 1 month (mo), 3 mo, 4.5 mo, and 6 mo with an Olympus szx12 fluorescent microscope and camera (Center Valley, PA) and Optronics Pictureframe software (Goleta, CA). Slides were imaged with a Nikon Eclipse e600 microscope (Tokyo, Japan), using a Diagnostic Instruments 14.2 color camera and Spot Imaging software (Sterling Heights, MI).
Histology and Immunohistochemistry (IHC)
Fish were fixed in 4% paraformaldehyde, paraffin-embedded, sectioned, and stained with hematoxylin and eosin (H&E) by standard techniques. For IHC, staining was performed at 37°C using a BenchMark XT immunostainer (Ventana Medical Systems, Tucson, AZ). Anti-GFP monoclonal antibody (mAb) was applied for 1 hr at 1:400 dilution, with resolution of GFP+ tissues using an IView DAB detection kit (Ventana). Hematoxylin was used as a counter-stain.
Flow Cytometry and Cytology
Fish thymi, marrow, and GFP+ tissues were dissected and placed in Zebrafish Kidney Stromal (ZKS) media (30). Cells were dissociated by pipetting, filtered with SmallParts 35μm filters (Miramar, FL), and again passed through 35μm Filcon filters (Becton Dickinson, San Jose, CA) before analysis. Flow cytometry and fluorescence-activated cell sorting (FACS) were as described (31), using a BD FACSVantage instrument (Becton Dickinson). GFP intensity, forward- and side-scatter were used for gating. Slides were made by centrifugation (800 rpm × 5 min) with a Shandon Cytospin 4 (Thermo Fischer Scientific, Waltham, MA) and Wright staining 2 min.
RT-PCR
RNA was extracted from twice FAC-sorted GFP+ cells with Trizol (Invitrogen, Carlsbad, CA), and TURBO DNase-treated (Ambion, Austin, TX). cDNA was made with Fermentas 1st strand cDNA kit (Glen Burnie, MD). Primers and PCR conditions are listed in Supplemental Material.
TCR Repertoire Analyses
Tumor tissue was dissected from mutant fish, and thymus and gut from a single WT lck::EGFP fish were used as a control. GFP+ cells were FACS-purified as described. Total RNA was extracted with Trizol, and 5′-RACE performed using a Clontech SMART RACE kit (Mountain View, CA). Primers for tcrβ1 constant region exon 3 were used, and are listed in Supplemental Material. PCR products were excised from ethidium bromide-stained agarose gels, and bands purified using a Qiagen QIAquick Gel Extraction kit (Valencia, CA). DNA was cloned using the TOPO TA Cloning kit (Invitrogen) and sequenced by conventional methodologies.
Statistical Analysis of tcrβ1 Sequences
Assuming random sampling, clones were distributed as a multinomial random variable, where the number of total clones was unknown but ≥12 (observed number of clones from the WT control fish). A goodness-of-fit test for the following hypothesis was tested: “Clones have a multinomial distribution with ≥12 types of clones of equal probability.” P-values were then obtained from 20 000 Monte Carlo simulations.
Cell Transplantation
Tumors were dissected and cells prepared as above. GFP+ cells were FACS-purified, diluted in ZKS media, and concentrations confirmed by hemocytometer counts. Using a 137Cesium source, hosts were irradiated with 25 gray (Gy), and intra-peritoneally (IP) injected 2 d later with 2.5 × 10³ to 1 × 10⁶ of FAC-sorted GFP+ cells in injection volumes of 5–10μl. Recipients were monitored by serial fluorescence microscopy to follow engraftment and disease progression.
Results and Discussion
Identification of Zebrafish Mutants with T Cell Malignancy Predisposition
To identify genetic lesions conferring a heritable risk to T cell malignancy, we performed a forward-genetic ENU mutagenesis screen in zebrafish (Figure 1). To detect abnormal T cell collections, we used transgenic WIK strain fish with stably-integrated lck::EGFP, which labels all T cells (32). Homozygous lck::EGFP males were mutagenized and bred to wild-type (WT) lck::EGFP females, creating over 500 F1 progeny, each with multiple unknown heterozygous mutations (33, 34).
Figure 1. Heritable T cell cancer phenotypes from an ENU mutagenesis screen.
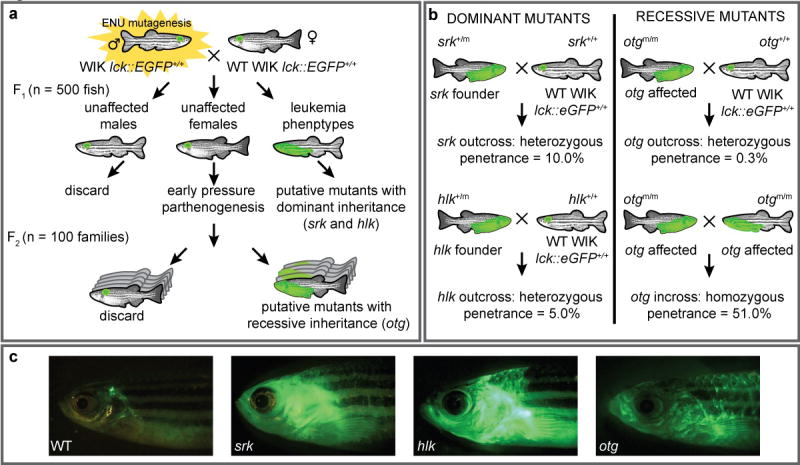
(a) Male homozygous lck::EGFP zebrafish were ENU-treated and bred to WT female lck::EGFP fish. F1 offspring with heterozygous germline mutations were screened microscopically until 6 mo. Mutants with abnormal GFP patterns were designated putatively dominant; two reported here are shrek (srk) and hulk (hlk). Also, eggs from normal female F1 fish were subjected to early pressure parthenogenesis, creating F2 families. One family with several abnormal siblings was deemed putatively recessive, dubbed oscar the grouch (otg). (b) Srk and hlk were confirmed by out-breeding F1 founders to WT fish, with observation of disease in offspring. Otg was verified by outbreeding (only 0.3% of heterozygotes acquired disease), and in-breeding (51% of homozygotes were abnormal). (c) WT lck::EGFP and diseased srk, hlk, and otg fish.
Fish were screened by fluorescence microscopy for enlarged or extra-thymic GFP until 6 mo. Atypical GFP patterns could represent T cell malignancies, benign lymphoproliferation, autoimmune T cell infiltrations, or non-T cell GFP expression. Regardless, F1 animals harbor dominant-acting mutations that confer an abnormal phenotype. Ten F1 mutants were found and nine studied further; two are reported here: shrek (srk) and hulk (hlk) (Figure 1a), named for green animated characters.
To determine if the srk and hlk phenotypes were heritable, these 2 individuals were out-bred to WT lck::EGFP fish, creating cohorts for confirmatory testing (Figure 1b). In both, multiple F2 progeny also developed abnormal GFP+ cell collections (examples shown in Figure 1c), verifying dominant inheritance, albeit with incomplete penetrance. This likely reflects a need for other acquired somatic mutations for full phenotypic penetrance, but alternate explanations such as stochastic variation in these phenotypes or additional modifier loci have not been formally excluded.
In addition, we approximated penetrance in srk and hlk. Because only 50% of fish in each F2 family should inherit the mutation, our calculations presumed that half of progeny were “carriers.” By this assumption, we estimated penetrance at 10% and 5%, respectively (Figure 1b and data not shown). We note that abnormal GFP+ cell expansion is seen in WT lck::EGFP fish in <0.1% of animals, and heritability has not been established in these instances (our unpublished observations).
To detect recessive mutations, eggs from normal F1 females underwent early pressure (EP), an induced parthenogenesis technique producing gynogenetic diploid progeny (35). EP offspring are homozygous for maternal haplotypes where meiotic cross-over did not occur. Thus, at these loci, recessive phenotypes can manifest in the F2 generation, eliminating the need for large F3 screens. We performed EP on over 100 F1 females, creating F2 families of >25 fish that were also screened until 6 mo. One additional mutant, oscar the grouch (otg), was detected by EP (Figure 1a), where several siblings from the same F2 family exhibited abnormal GFP patterns.
To confirm recessive inheritance in otg, affected EP-derived fish were bred to WT lck::EGFP animals. Here, all progeny carry one otg lesion. In over 300 out-bred fish, only 1 acquired a GFP+ tumor, for a heterozygous penetrance of 0.3% (Figure 1b). In contrast, when diseased otg fish were in-bred to create homozygous mutants, over half of progeny showed abnormal GFP patterns (example in Figure 1c). This equated to a homozygous penetrance of 51%, and verified that otg acts recessively.
hlk, srk, and otg Mutants Each Develop Bona Fide Malignancies
Affected fish of each mutant line were strikingly similar to T-ALL induced by oncogene over-expression (25, 26). GFP+ areas were solid, intensely bright masses resembling tumors, frequently arising from the thymic region (Figure 1c). Neoplasms typically spread locally to gills and adjacent structures, and generally in a cephalo-caudal pattern through the entire fish over weeks-to-months until generalized edema and circulatory collapse caused death (Supplemental Figure 1).
Though affected srk, hlk, and otg fish often appeared similar, variations did occur. GFP+ infiltrations of the eyes, fins, skin, and tail were seen, with occasional discontinuous ‘skip lesions’ (Supplemental Figure 2). These patterns could reflect either multiple synchronous T cell cancers in an individual fish, or non-contiguous spreading of a single malignancy. In particular, the skin tropism seen is reminiscent of non-Hodgkin peripheral T cell cutaneous lymphomas, such as mycosis fungoides and Sezary syndrome (36). In agreement with their pervasive cancer susceptibility, non-lymphocytic, GFP− tumors were also infrequently detected in srk, hlk, and otg (Supplemental Figure 3), perhaps alluding to a general cancer predisposition.
To confirm that GFP+ tumors were in fact cancerous, we performed histology and immunohistochemistry (IHC) on affected animals (Figure 2). Sections from srk, hlk, and otg fish were H&E stained, revealing infiltrating lymphocytes in tissues that coincided exactly to GFP+ body areas. Notably, gills, fins, skin, muscle, and fat were all distorted by a monomorphic invasive cell population with lymphocytic appearance. These cells were GFP+, as shown by IHC with α-GFP mAb (Figures 2a–2c). Fish kidney-marrow (zebrafish bone marrow equivalent) was frequently effaced by these same cells, demonstrating spread to marrow as seen in leukemia. In addition, intra-abdominal tumors of malignant lymphocytes were also seen. Tumor cells exhibited classic “small round blue cell” morphology consistent with lymphoblasts (37). Collectively, these phenotypes closely emulate human T-LBL and T-ALL.
Figure 2. Histologic and immunohistochemical analysis of GFP+ tumors.
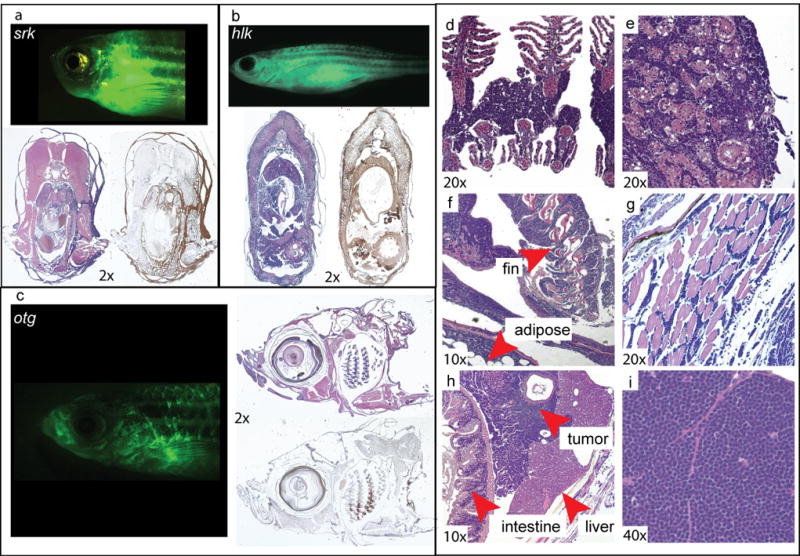
Diseased srk (a), hlk (b), and otg (c) fish, H&E-stained sections of same fish, and sections labeled brown by α-GFP IHC. Most basophilic cells by H&E are reactive with α-GFP mAb. H&E stains show neoplastic infiltration of (d) gills, (e) kidney-marrow, (f) fin and adipose, (g) muscle, and (h) forming intra-abdominal tumors. Tumor tissue (i) has small round blue cell morphology typical of T-LBL and T-ALL. [Images graphically enhanced to improve color balance and brightness.]
Malignancies of hlk, srk, and otg Have T Cell Origin
Despite topographic and morphologic evidence that GFP+ tumors were T cell malignancies, we also examined their gene expression. To limit our analysis to only tumor cells, we isolated GFP+ cells by fluorescence-activated cell sorting (FACS) of tumors from individual srk, hlk, and otg fish. FACS-purification was performed twice to eliminate rare mis-sorted cells. Total RNA was then interrogated for cell-specific transcripts by reverse transcriptase-polymerase chain reactions (RT-PCR; Figure 3).
Figure 3. GFP+ tumor cells have T cell gene expression patterns.
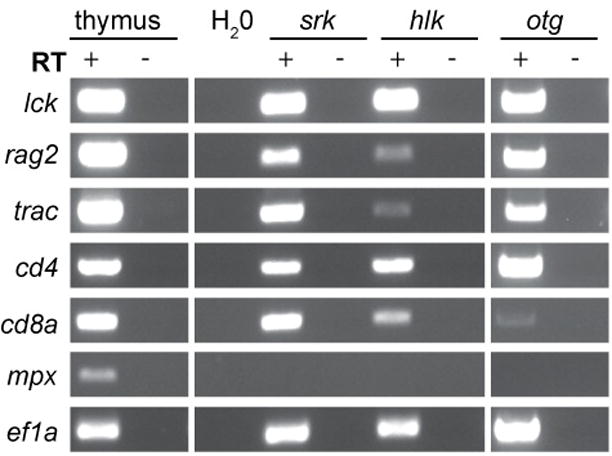
Total RNA from FACS-purified GFP+ cells of srk, hlk, and otg tumors was analyzed by RT-PCR. D. rerio nomenclature is listed at left (lck=LCK, rag2=RAG2, trac=TCRA, cd4=CD4, cd8a=CD8A, mpx=MPO, ef1a=EEF1A1). RNA from WT thymus and ef1a PCR are positive controls. H2O-only, reactions without RT, and mpx are negative controls.
All 3 tumors expressed lck and trac (TCRα), confirming T cell identity. Cells also contained cd4, cd8a, and rag2 messages, further substantiating their T lineage origins. It is not known whether single tumor cells co-expressed these genes, or if tumors contained different clones corresponding to multiple stages of T cell differentiation. Of note, human T-ALL and T-LBL cells frequently co-express these same transcripts, consistent with a double-positive stage of thymocyte differentiation. However, other tumors from each of these mutants have shown gene expression profiles indicative of mature T cells (Supplemental Figure 4 and data not shown). In all malignant samples, expression of the myeloid-specific transcript myeloperoxidase (mpx; human MPO) was not detected, attesting to high tumor cell purities.
Malignant Cells Are Abundant in Marrow and Peripheral Blood
Histology often exhibited lymphocytic infiltrations in marrows of diseased srk, hlk, and otg fish (Figure 2). To examine these cells, we performed flow cytometry on marrow and blood of affected fish. In tumor-bearing fish, we could readily identify GFP+ lymphoblasts that were infrequent in WT lck::EGFP fish (Figure 4a). Malignant blasts were distinct from normal circulating T cells based on their larger average size and greater GFP intensity, but had similar granularity to T lymphocytes (Figure 4a and data not shown). Abundant GFP+ cells were found in the marrow and blood of many diseased fish, and when present, were dramatically increased relative to the fraction of T cells normally seen in these two anatomic sites (Figure 4a and Supplemental Table 1) (32). Overall, several marrow and blood samples from all 3 mutants contained GFP+ cells greater than 3 standard deviations above their corresponding WT mean values. This marrow infiltration and dissemination to peripheral blood is consistent with that seen in human T cell lymphomas progressing to frank leukemias as T-ALL (38).
Figure 4. Neoplastic cells in marrow and blood have lymphoblast morphology.
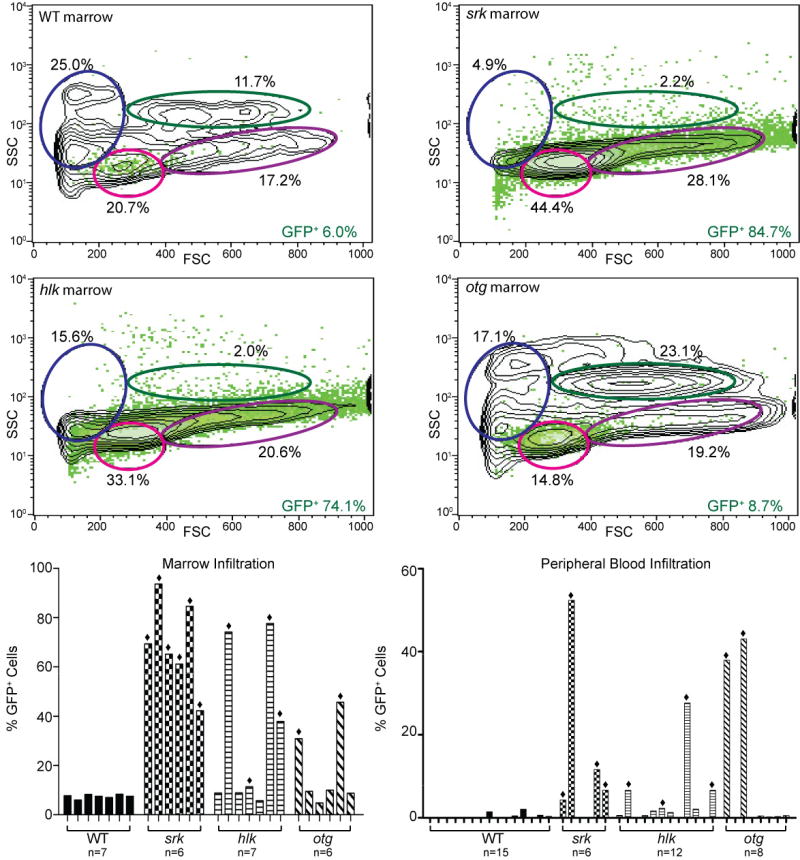
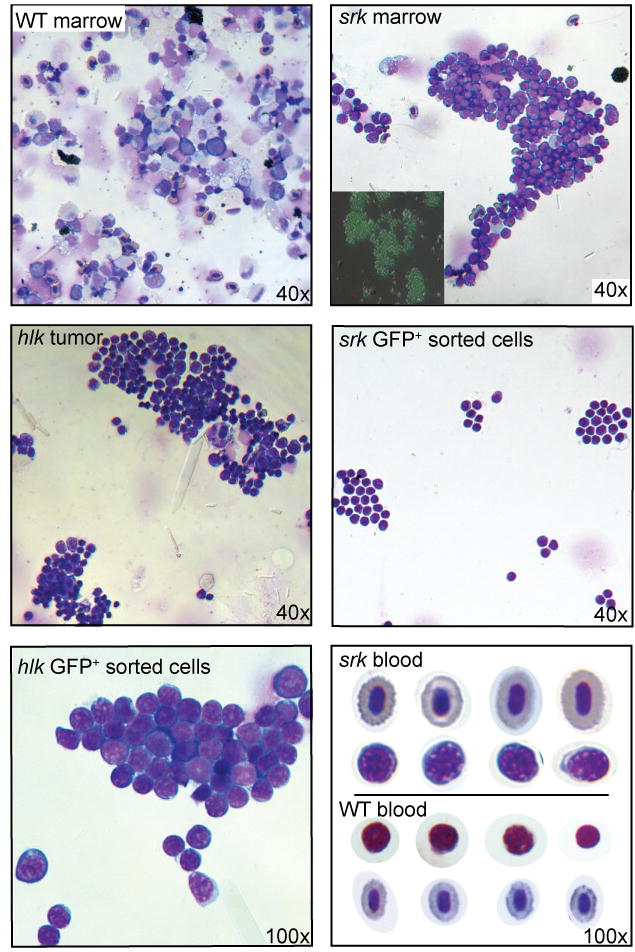
(a) Flow cytometry of marrow from a WT lck::EGFP fish (upper left plot) shows most GFP+ cells in lymphoid (pink oval) or progenitor (purple) windows, with all T lineage cells comprising 6.0% of total cells. Diseased srk (upper right plot) and hlk (lower left plot) fish show dramatically increased GFP+ percentages (84.7% and 74.1%), with diminished erythroid (blue) and myeloid (green) fractions. Otg fish shows early GFP+ cellular infiltration (8.7% of total), with normal erythroid and myeloid values. X-axes: forward scatter (FSC), Y-axes: side scatter (SSC), with GFP+ cells overlaid in green. Histograms at lower left show GFP+ cell fraction for WT marrows (mean 7.5 +/− 0.9%; n=7), and multiple affected srk, hlk, and otg fish. Defining abnormal as >3 SD above the WT mean, 6/6 srk, 4/7 hlk, and 2/6 otg marrows showed pathologic infiltrations (bars marked with diamonds). In these samples, mean GFP+ fractions were 69.4% (srk), 50.3% (hlk), and 38.2% (otg). Histograms at right depict flow cytometry results for peripheral blood in identical format. WT fish have only rare GFP+ cells (0.35 +/− 0.6%, n=15). Blood from affected fish had high GFP+ fractions in 4/6 srk, 4/12 hlk, and 2/8 otg samples, with mean values of 18.8%, 10.8%, and 40.5%, respectively. (b) Wright stains of malignant lymphoblasts from different tissues. Upper panels: WT (left) and srk (right) marrow. Srk sample is overrun by T-ALL neoplastic cells, and fluorescent micrograph (inset) confirms that most srk marrow cells are GFP+. Middle panels: unsorted cells from hlk tumor (left) have lymphoblastic morphology; FACS-purified cells from srk tumor (right) are identical. High power image of GFP+-sorted hlk tumor cells (lower left panel) shows morphologic features of lymphoblasts. Blood from a diseased srk fish (lower right panel) shows erythrocytes (top row) and frequent malignant lymphoblasts (2nd row). Lymphocytes (3rd row) and erythrocytes (4th row) from a WT fish are shown for comparison (D. rerio has nucleated RBCs). [Images graphically enhanced to improve brightness.]
To study these cells further, we made cytospin preparations from marrow, tumors, FAC-sorted GFP+ cells, and blood, and performed Wright stains (Figure 4b, Supplemental Figure 5, and data not shown). Marrow from affected, but not WT, fish often was effaced by lymphoblasts. Unsorted tumors had identical cells to those in the marrow, further verified by stains of FACS-purified cells from tumors, marrow, and blood. Prior to staining, fluorescence microscopy revealed that tissues consisted primarily of GFP+ cells, even without FACS enrichment (Figure 4b and data not shown). Even unsorted blood smears from diseased fish had copious lymphoblasts, typical of human T-ALL. Blasts had hyperchromatic nuclei with prominent nucleoli, high nuclear:cytoplasmic ratios, and intensely blue-staining cytoplasms (Figure 4b).
Malignancies Show Clonal TCR Rearrangements
To test whether lymphoblasts were malignant clones, and not polyclonal accumulations as might be seen in benign lymphoproliferation, we performed T cell receptor (TCR) repertoire studies to investigate their diversity. We isolated total RNA from GFP+ cells of a single WT lck::EGFP fish, as well as individual srk, hlk, and otg tumors. To minimize normal T cell contamination, non-thymic tumors were utilized. Using 5′ rapid amplification of cDNA ends (5′ RACE), tcrβ1 transcripts from eachsample were cloned, and variable-diversity-joining (VDJ) gene segment usage analyzed (Figure 5; sequence alignments shown in Supplemental Table 2).
Figure 5. Tumors are clonal with shared TCRβ1 VDJ rearrangements.
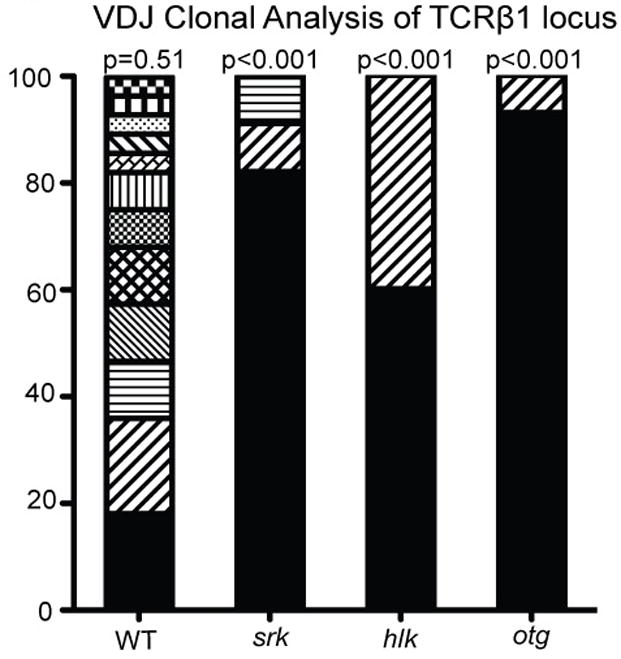
Total RNA from GFP+ cells of a WT thymus or tumors of single srk, hlk, and otg fish was used for 5′ RACE with tcrβ1-specific primers. RACE products were sequenced for VDJ analysis. From 28 WT thymus clones, 12 unique sequences were obtained, each isolated 1–5 times. From srk and otg, 9/11 (81.8%), and 14/15 (93.3%) clones were identical, suggesting oligoclonality. From hlk, 2 unrelated VDJ recombinations were detected 9/15 and 6/15 times, again showing oligoclonality. Distributions were analyzed by a goodness-of-fit test, and p-values calculated in 20 000 Monte Carlo simulations. Y-axis indicates percentage of clones obtained from each individual fish.
The WT fish yielded 28 independently-isolated sequences, comprising 12 unique clones, each captured 1–5 times in a bell-shaped distribution. This diversity was consistent with a polyclonal repertoire, surveyed incompletely in random fashion (p=0.51). In contrast, srk and otg tumors each had highly-skewed, non-random VDJ usage with a single clone representing nearly the entire tcrβ1 cDNA pool (9/11 srk sequences, 14/15 for otg; each p<0.001). This bias is consistent with an oligoclonal T cell population, as occurs in malignancy. Rarely-isolated VDJ sequences from srk (2 different clones, each obtained once) and otg (1 clone, isolated once) may represent either less-prevalent malignant clones, or contamination by normal T cells infiltrating these tumors, as our GFP-based FACS purifications could not exclude these cells. In either case, the distribution of sequences from each tumor was highly constricted relative to WT, with sequence alignments demonstrating that rarely-detected TCR rearrangements were not related to the dominant VDJ gene segment utilized by the principal population (Supplemental Table 2).
GFP+ cells from the hlk tumor also showed limited tcrβ1 diversity, showing two unrelated clones (9/15 and 6/15 of sequences). This non-random repertoire was also statistically significant (p<0.001), suggesting the hlk tumor was oligoclonal. As the two TCR rearrangements from hlk were unrelated (Supplemental Table 2), this could reflect two distinct malignant clones originating independently in the same animal.
Genetic Characteristics of srk and hlk
Having shown cancers in srk and hlk to be T cell-derived and oligoclonal, we sought to further characterize the genetics of these mutants. Extended pedigrees were created by in-breeding each line, and out-crossing to other backgrounds. As our prior penetrance estimates (Figure 1b) were deduced from small numbers, we created large families to definitively track penetrance and incidence. Animals known to carry mutations (i.e., fish with GFP+ tumors) were used to create these pedigrees.
We hypothesized that if srk and hlk heterozygotes could develop disease at low penetrance, then perhaps acquired mutations of the second allele could facilitate transformation. If so, germline srk or hlk homozygotes might show disease at higher penetrance or with shorter latency (39). As the srk and hlk mutations are unknown (obviating genotyping), we created homozygous mutants by in-breeding affected fish for several generations to enrich the allelic frequency of mutant loci. Validating this strategy, by the third consanguineous generation, a dramatic increase in penetrance was seen in both srk and hlk cohorts (43.0 and 40.3%, Figure 6). While fish could not be confirmed to be uniformly homozygous at the srk and hlk loci, this finding clearly indicates that adding homozygotes to the cohort amplifies overall penetrance. The parsimonious explanation for this result is that homozygotes have higher disease rates than heterozygotes, though the possible contribution of modifier loci has not been excluded. Of interest, in-bred srk and hlk fish had normal embryonic and adult viability (data not shown), establishing that homozygous mutants are non-lethal.
Figure 6. Disease incidence curves for srk, hlk, and otg mutants.
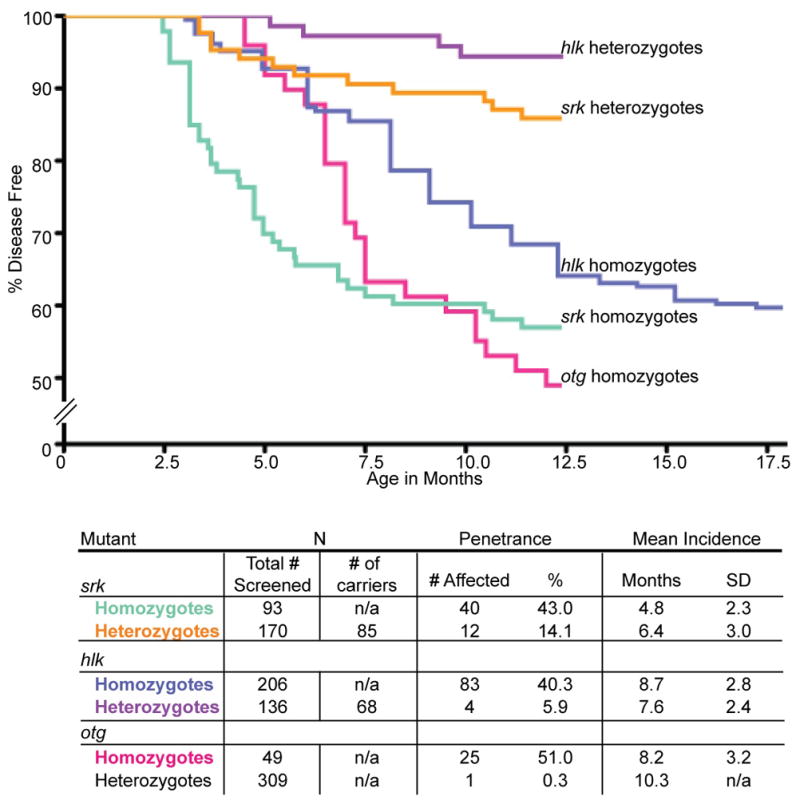
Pools of fish were screened by fluorescence microscopy for T cell malignancy. Srk homozygotes (green) and heterozygotes (orange) have disease penetrance of 43.0% and 14.1%, respectively. Srk homozygotes have shorter latency, with mean incidence of 4.8 vs. 6.4 mo for heterozygotes (SD, standard deviation). Hlk homozygotes (blue) have 40.3% disease penetrance by 18 mo (35.9% by 12 mo), compared to heterozygous penetrance of 5.9% (purple). Homozygous and heterozygous hlk fish have similar latency (mean incidences of 8.7 and 7.6 mo, respectively). Otg homozygotes (pink) show 51.0% penetrance by 12 mo, with mean incidence of 8.2 mo. Heterozygotes rarely acquire disease (0.3%), and are not depicted as a Kaplan-Meier curve.
To verify our prior heterozygous penetrance figures, we used mono-allelic srk and hlk fish (affected fish with one WT parent, making them obligate heterozygotes) and bred them with WT genetic backgrounds. Because 50% of gametes from mutant heterozygotes will lack the mutation, only half of these progeny were estimated to be heterozygous mutants (Figure 6: # screened vs. # of carriers). In these families, srk and hlk heterozygotes had penetrance similar to original estimates (14.1 and 5.9%, Figure 6; compare to 10 and 5% in Figure 1b). While modest, these rates are far higher than the rare T cell neoplasias observed in WT lck::EGFP fish (<0.1%, our unpublished data). In fact, this is much higher than rates reported in transgenic zebrafish models of AML induced by MOZ-TIF2 (40) or B-ALL caused by TEL-AML1 (41). More importantly, this degree of penetrance is similar to disease rates seen in rare human pedigrees of leukemia and lymphoma (19, 21, 42), suggesting that srk and hlk may accurately model human familial predisposition to these diseases.
These heterozygous phenotypes verify the dominant cancer predisposition of srk and hlk. Of note, we also created hlk fish with transgenic rag2::bcl2-EGFP, using the native rag2 promoter to drive lymphocyte-specific over-expression of bcl2 (43). Unlike NOTCH1-induced D. rerio T-ALL, we saw no accentuated penetrance or shortened latency in hlk + rag2::bcl2 fish (data not shown). While NOTCH1 activation showed a cooperative relationship with bcl2 in this transgenic context (26), a similar synergy was not seen between hlk and bcl2. One possible explanation for this result is that the hlk mutation may perturb normal apoptosis, subverting any added effect of bcl2 over-expression. However, thus far, apoptosis assays with hlk fish have failed to demonstrate any difference between hlk and WT animals (data not shown).
In contrast, fish with germline bi-allelic srk and hlk mutations had significantly higher penetrance. Explaining this finding, if srk and hlk are inactivating lesions, somatic mutation of the second allele may normally be required for transformation in heterozygotes. Alternatively, if the srk or hlk lesions are activating, increased homozygous penetrance may derive from gene dosage effects. Also of note, while the increased homozygous penetrance is striking, it is equally evident that neither srk nor hlk homozygotes show full penetrance. Over half of homozygotes did not acquire disease by 1 yr, implying other mutations are needed for full malignant penetrance.
Genetic Characteristics of otg
Otg, identified by virtue of EP (Figure 1), was presumptively recessive, as its F1 founder was phenotypically normal. As noted above, when otg EP fish were out-bred, almost no T cell neoplasia occurred (1/309 fish, 0.3%; Figure 6). One possible interpretation of this result is that somatic mutation of the 2nd otg allele is infrequent relative to srk and hlk. Alternatively, a greater number of cooperating mutations may be able to potentiate srk or hlk oncogenesis. In either case, the near-absence of disease in heterozygotes confirms that otg behaves as a recessive trait.
While otg heterozygotes were normal, progeny of in-bred otg EP fish showed high disease rates, even greater than srk or hlk (51.0%; Figure 6). However, despite this high penetrance, still only about half of otg homozygotes developed disease. As with srk and hlk, this incomplete penetrance suggests that other somatically acquired mutations are necessary for transformation.
srk, hlk, and otg have Differing Incidence Patterns
We also determined typical latencies for srk, hlk, and otg (Figure 6). In all 3 mutants, tumors first developed coincident with sexual maturity (3–4 mo) and peaked at 5–8 mo (young adult). Srk homozygotes had shorter latencies than heterozygotes (4.8 vs. 6.4 mo), whereas hlk mono- and bi-allelic mutants showed similar incidence (7.6 vs. 8.7 mo). In otg, heterozygous disease was rare, preventing comparison.
Because srk and hlk homozygotes show differing incidence, we infer that they have distinct genetic lesions, though the possibility of different mutations in the same gene still exists. In addition, the abbreviated latency of srk homozygotes implies that mutation to the 2nd srk allele may be key to tumorigenesis. Still, even homozygous srk mutants are incompletely penetrant, proving that other somatic events are needed. Conversely, the similar incidence of hlk single and double mutants suggests the 2nd hlk lesion impacts penetrance, but not latency. Thus, other mutations besides hlk are transformative. Together, these disparities in inheritance, penetrance, and incidence may suggest different cadres of cooperating mutations for all 3 models.
Malignancies Can Engraft and Be Serially Passaged in Allogeneic Hosts
Many cancers––including zebrafish T-ALL––can engraft in allogeneic immuno-compromised hosts, and this attribute may distinguish lymphoproliferative conditions from neoplasia (25, 26). Transplantation can also determine the minimal cell number able to transmit disease, a property of leukemia-initiating cells (LIC) (44). To test these features, we examined our models’ ability to be propagated in irradiated hosts.
Zebrafish strains have limited polymorphism, but D. rerio are not routinely available as isogenic lines. Accordingly, immunosuppression is used to facilitate engraftment (45). Using this approach, WT recipients were given sub-lethal doses of 25 gray (Gy) γ-irradiation (IR) prior to transplant. FAC-sorted, GFP+ tumor cells were then injected into hosts, with monitoring of engraftment by fluorescence microscopy.
Using multiple tumors from each line and a range of donor cell doses for each tumor, GFP+ malignant cells from srk, hlk, and otg each demonstrated engraftment (Supplemental Figure 6). In most hosts, neoplastic cells were first seen at the site of injection, and grew to completely infiltrate the intra-abdominal and thoracic cavities, ultimately causing host demise. Many fish showed extensive dissemination prior to death, mimicking their donors. These features did not occur in controls injected with GFP+ thymocytes from WT WIK lck::EGFP donors (data not shown).
We also tested whether malignancies could be serially passaged in vivo, and if iterative transplantation selected for more aggressive tumors––either in ability to engraft or to kill hosts. From a single srk tumor, FACS-purified GFP+ cells were propagated through three transplant cycles (using 1 × 10⁵ cells in each transplant), while monitoring host engraftment and survival. Recipients began to engraft by day 6, with the percent engrafted at 6 d increasing in each round (38.5% in cohort #1, 50.0% in cohort #2, and 58.3% in cohort # 3; data not shown).
We also tracked survival, including all fish engrafted by 21 d (Figure 7). In all three transplant rounds, engrafted hosts first began to die at 11–13 d. However, net survival decreased with each transplant iteration, with mean survival 18.2 d for primary hosts, 16 d in secondary recipients, and 13.5 d in tertiary hosts. Comparing Kaplan-Meier curves by the Logrank test-for-trend showed significant differences (p=0.0423). These results demonstrate that cancers can serially engraft into newly-irradiated fish, and that progressive transplantation selects for leukemias with increasingly malignant phenotypes. These changes may occur by the accrual of new mutations and/or alterations in gene expression that enhance tumor lethality. Alternatively, sequential transplants may select for tumors with progressively higher fractions of LIC, thereby effecting accelerated engraftment and tumor expansion.
Figure 7. Serially-transplanted cancers are increasingly malignant.
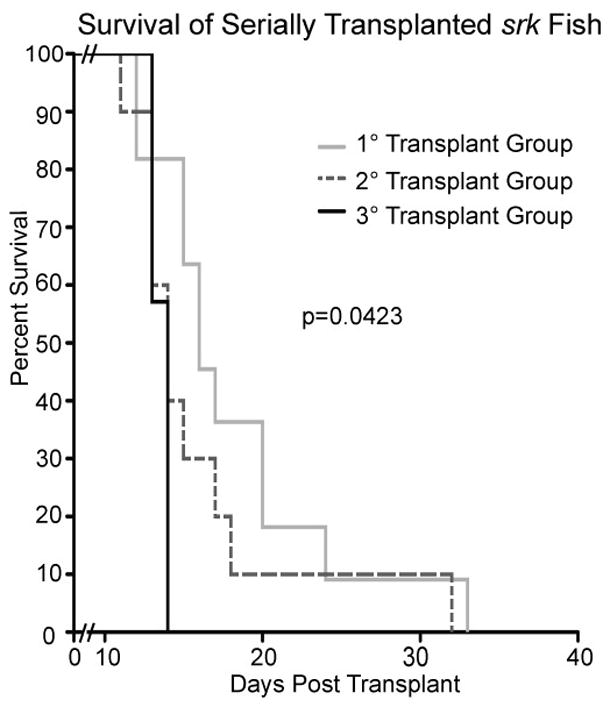
GFP+ cells from a srk tumor were sequentially transplanted into 3 iterations of pre-irradiated WT hosts. 1 × 10⁵ cells were used in each transplant. Only engrafted fish are plotted (1st host cohort n=11; 2nd group n=10; 3rd n=7). One engrafted fish from each cohort (not included above) was used as a donor in the subsequent transplant round. Recipients had shortened survival in each round, with statistical significance of p=0.0423.
To assess the presence and frequency of LIC, we performed transplants with cells from 3 different srk tumors (Supplemental Figure 7). Using 10-fold dilutions of GFP+ cells in groups of five recipients each, hosts were followed for engraftment. By the linear regression model of incidence analysis, LIC values were then determined (46). The three srk tumors in these experiments yielded LIC frequencies of 1:1 752, 1:8 159, and 1:10 373 cells, comparable to numbers reported with zebrafish T-ALL caused by murine c-MYC (47). Also, using cells from in vivo-passaged hlk tumors, we have seen high engraftment with as few as 2 500 GFP+ cells (data not shown).
These experiments establish that tumor cells from srk, hlk, and otg can be transplanted, a common property of neoplasias. Also, serial passaging shows that progressively more malignant phenotypes can be acquired. Further, tumors from these models contain LIC, and these cells can be quantified. Plausibly, comparisons between the same malignancy pre- and post-transplant (or following many transplant iterations) will reveal differences responsible for their more aggressive behavior.
Conclusion
We have used an ENU mutagenesis screen to induce and identify three D. rerio models of heritable T cell cancer predisposition. These mutants emulate many clinical and molecular features of human T-ALL and T-LBL. Key characteristics and experimental advantages of these new disease models are summarized below.
Mutants have reproducible and heritable malignancy predisposition. Srk and hlk are dominantly inherited, but heterozygous penetrance is modest. Thus, these lines may represent models of familial leukemias and lymphomas, which have been repeatedly reported but are not molecularly defined (16–20). As homozygous traits, srk, hlk, and otg all have high penetrance (40–51%; Figure 6), facilitating production of large numbers of affected animals for study. Although antibodies against most D. rerio proteins are currently scarce, malignant T cells can be FACS-purified easily because they are GFP+, simplifying their procurement.
These T cell cancers are similar to human T-ALL and T-LBL. Mutants develop thymic tumors, akin to mediastinal masses seen in both experimental mammalian lymphoma models and human patients. Tumors often disseminate, with tropism for marrow and blood, again modeling human T cell malignancies. Expression patterns confirm that neoplastic cells are T lineage, and TCR analyses verify their clonality. Malignant cells are allogeneically transplantable with high rates of engraftment. Transplanted cells authentically re-establish the original disease, expediting the generation of large numbers of malignant cells. Via transplantation, LIC studies are also possible. Finally, in vivo selection can expand clones with high LIC fractions or other desirable attributes that are currently difficult to study with mammalian models.
These studies emphasize the feasibility of forward genetic screens with adult vertebrates to discover non-embryonic phenotypes relevant to human health, such as cancer predisposition. Traditionally, zebrafish and other “genetic” models have been used in mutational screens querying developmental phenotypes, using early embryos. By screening mutant populations into early adulthood (6 mo), we show that late-manifesting conditions are also viable experimental targets. As zebrafish rarely develop spontaneous malignancy in their first 6 mo, we exploited the mutagenicity of ENU and a T cell-specific fluorochrome to detect phenotypes that would otherwise be impractical to pursue experimentally. We note that our approach is not limited to T lymphocyte cancers. Exchanging lck::EGFP for other cell-specific markers, similar screens could investigate any number of pathologic endpoints.
Using these mutants, superimposed modifier screens may be performed to identify collaborating genes affecting these phenotypes. Mutants with low penetrance and long latency (srk and hlk heterozygotes) are well-suited for enhancer screens seeking more prevalent and/or earlier disease onset. Highly-penetrant mutants with early incidence (srk homozygotes) are optimal for suppressor approaches.
These cancer-prone mutants should prove useful for dissecting the genetic changes that underlie T cell malignancy occurrence and progression. T cells can be purified from mutant fish prior to tumor development (presumably before acquiring other mutations obligate to transformation). Neoplastic cells can also be purified from thymic cancers, from disseminated clones at other sites, or from highly-aggressive neoplasms after serial transplantation. This should allow for comparisons between cells from each stage of disease progression. We believe these genetic cancer predisposition models will provide a platform to permit the step-by-step analysis of each crucial biologic point in T-ALL and T-LBL. Ultimately, understanding the molecular events that cause neoplastic transformation––and those underlying key stages of disease progression like dissemination and engraftment––should improve our ability to treat these diseases at each and every point in their complex evolution.
Supplementary Material
Acknowledgments
The authors wish to thank Eric Konnick and Lauren Shih for superb technical contributions to this work, Dr. Kenneth Boucher for expert statistical analysis, and ARUP Institute for histology and immunophenotyping. We also thank Drs. Stephen Lessnick, John Parant, and Joshua Schiffman for critical appraisal of the manuscript.
JKF was supported by NIH NICHD award 5K08 HD53350; NM was supported by NIH NICHD award 2K12 HD001410 and an Alex’s Lemonade Stand Young Investigator award; JKF and NM were also supported by the Children’s Health Research Center at the University of Utah and by Primary Children’s Medical Center Foundation grants; LR was supported by NIH NIDDKT32 award DK007115; SAH was supported by an American Cancer Society Fellowship award; NST was supported by NIH NIAID award R21 AI079784 and the Huntsman Cancer Foundation; Huntsman Cancer Institute core facilities supported by grant P30 CA042014 also participated in this work.
Footnotes
Supplementary information is available at Leukemia’s website.
References
- 1.Silverman LB, Sallan SE. Newly diagnosed childhood acute lymphoblastic leukemia: update on prognostic factors and treatment. Curr Opin Hematol. 2003 Jul;10(4):290–6. doi: 10.1097/00062752-200307000-00007. [DOI] [PubMed] [Google Scholar]
- 2.Gaynon PS, Trigg ME, Heerema NA, Sensel MG, Sather HN, Hammond GD, et al. Children’s Cancer Group trials in childhood acute lymphoblastic leukemia: 1983–1995. Leukemia. 2000 Dec;14(12):2223–33. doi: 10.1038/sj.leu.2401939. [DOI] [PubMed] [Google Scholar]
- 3.Thiel E, Kranz BR, Raghavachar A, Bartram CR, Loffler H, Messerer D, et al. Prethymic phenotype and genotype of pre-T (CD7+/ER−)-cell leukemia and its clinical significance within adult acute lymphoblastic leukemia. Blood. 1989 Apr;73(5):1247–58. [PubMed] [Google Scholar]
- 4.Goldberg JM, Silverman LB, Levy DE, Dalton VK, Gelber RD, Lehmann L, et al. Childhood T-cell acute lymphoblastic leukemia: the Dana-Farber Cancer Institute acute lymphoblastic leukemia consortium experience. J Clin Oncol. 2003 Oct 1;21(19):3616–22. doi: 10.1200/JCO.2003.10.116. [DOI] [PubMed] [Google Scholar]
- 5.Pui CH. Recent advances in the biology and treatment of childhood acute lymphoblastic leukemia. Curr Opin Hematol. 1998 Jul;5(4):292–301. doi: 10.1097/00062752-199807000-00009. [DOI] [PubMed] [Google Scholar]
- 6.Larson RA, Dodge RK, Linker CA, Stone RM, Powell BL, Lee EJ, et al. A randomized controlled trial of filgrastim during remission induction and consolidation chemotherapy for adults with acute lymphoblastic leukemia: CALGB study 9111. Blood. 1998 Sep 1;92(5):1556–64. [PubMed] [Google Scholar]
- 7.Takeuchi J, Kyo T, Naito K, Sao H, Takahashi M, Miyawaki S, et al. Induction therapy by frequent administration of doxorubicin with four other drugs, followed by intensive consolidation and maintenance therapy for adult acute lymphoblastic leukemia: the JALSG-ALL93 study. Leukemia. 2002 Jul;16(7):1259–66. doi: 10.1038/sj.leu.2402526. [DOI] [PubMed] [Google Scholar]
- 8.Gilliland DG. Hematologic malignancies. Curr Opin Hematol. 2001 Jul;8(4):189–91. doi: 10.1097/00062752-200107000-00001. [DOI] [PubMed] [Google Scholar]
- 9.Ferrando AA, Neuberg DS, Staunton J, Loh ML, Huard C, Raimondi SC, et al. Gene expression signatures define novel oncogenic pathways in T cell acute lymphoblastic leukemia. Cancer Cell. 2002 Feb;1(1):75–87. doi: 10.1016/s1535-6108(02)00018-1. [DOI] [PubMed] [Google Scholar]
- 10.Pui CH, Relling MV, Downing JR. Acute lymphoblastic leukemia. N Engl J Med. 2004 Apr 8;350(15):1535–48. doi: 10.1056/NEJMra023001. [DOI] [PubMed] [Google Scholar]
- 11.Armstrong SA, Look AT. Molecular genetics of acute lymphoblastic leukemia. J Clin Oncol. 2005 Sep 10;23(26):6306–15. doi: 10.1200/JCO.2005.05.047. [DOI] [PubMed] [Google Scholar]
- 12.Ferrando AA, Look AT. Clinical implications of recurring chromosomal and associated molecular abnormalities in acute lymphoblastic leukemia. Semin Hematol. 2000 Oct;37(4):381–95. doi: 10.1016/s0037-1963(00)90018-0. [DOI] [PubMed] [Google Scholar]
- 13.Harrison CJ, Foroni L. Cytogenetics and molecular genetics of acute lymphoblastic leukemia. Rev Clin Exp Hematol. 2002 Jun;6(2):91–113. doi: 10.1046/j.1468-0734.2002.00069.x. discussion 200–2. [DOI] [PubMed] [Google Scholar]
- 14.Graux C, Cools J, Michaux L, Vandenberghe P, Hagemeijer A. Cytogenetics and molecular genetics of T-cell acute lymphoblastic leukemia: from thymocyte to lymphoblast. Leukemia. 2006 Sep;20(9):1496–510. doi: 10.1038/sj.leu.2404302. [DOI] [PubMed] [Google Scholar]
- 15.Weng AP, Ferrando AA, Lee W, Morris JPt, Silverman LB, Sanchez-Irizarry C, et al. Activating mutations of NOTCH1 in human T cell acute lymphoblastic leukemia. Science. 2004 Oct 8;306(5694):269–71. doi: 10.1126/science.1102160. [DOI] [PubMed] [Google Scholar]
- 16.Palomero T, Lim WK, Odom DT, Sulis ML, Real PJ, Margolin A, et al. NOTCH1 directly regulates c-MYC and activates a feed-forward-loop transcriptional network promoting leukemic cell growth. Proc Natl Acad Sci U S A. 2006 Nov 28;103(48):18261–6. doi: 10.1073/pnas.0606108103. [DOI] [PMC free article] [PubMed] [Google Scholar]
- 17.Gunz FW, Gunz JP, Veale AM, Chapman CJ, Houston IB. Familial leukaemia: a study of 909 families. Scand J Haematol. 1975 Sep;15(2):117–31. doi: 10.1111/j.1600-0609.1975.tb01063.x. [DOI] [PubMed] [Google Scholar]
- 18.Goldgar DE, Easton DF, Cannon-Albright LA, Skolnick MH. Systematic population-based assessment of cancer risk in first-degree relatives of cancer probands. J Natl Cancer Inst. 1994 Nov 2;86(21):1600–8. doi: 10.1093/jnci/86.21.1600. [DOI] [PubMed] [Google Scholar]
- 19.Horwitz M. The genetics of familial leukemia. Leukemia. 1997 Aug;11(8):1347–59. doi: 10.1038/sj.leu.2400707. [DOI] [PubMed] [Google Scholar]
- 20.Segel GB, Lichtman MA. Familial (inherited) leukemia, lymphoma, and myeloma: an overview. Blood Cells Mol Dis. 2004 Jan-Feb;32(1):246–61. doi: 10.1016/j.bcmd.2003.10.005. [DOI] [PubMed] [Google Scholar]
- 21.Benson KF, Horwitz M. Familial leukemia. Best Pract Res Clin Haematol. 2006;19(2):269–79. doi: 10.1016/j.beha.2005.11.002. [DOI] [PubMed] [Google Scholar]
- 22.Amatruda JF, Zon LI. Dissecting hematopoiesis and disease using the zebrafish. Dev Biol. 1999 Dec 1;216(1):1–15. doi: 10.1006/dbio.1999.9462. [DOI] [PubMed] [Google Scholar]
- 23.Trede NS, Langenau DM, Traver D, Look AT, Zon LI. The use of zebrafish to understand immunity. Immunity. 2004 Apr;20(4):367–79. doi: 10.1016/s1074-7613(04)00084-6. [DOI] [PubMed] [Google Scholar]
- 24.Meeker ND, Trede NS. Immunology and zebrafish: spawning new models of human disease. Dev Comp Immunol. 2008;32(7):745–57. doi: 10.1016/j.dci.2007.11.011. [DOI] [PubMed] [Google Scholar]
- 25.Langenau DM, Traver D, Ferrando AA, Kutok JL, Aster JC, Kanki JP, et al. Myc-induced T cell leukemia in transgenic zebrafish. Science. 2003 Feb 7;299(5608):887–90. doi: 10.1126/science.1080280. [DOI] [PubMed] [Google Scholar]
- 26.Chen J, Jette C, Kanki JP, Aster JC, Look AT, Griffin JD. NOTCH1-induced T-cell leukemia in transgenic zebrafish. Leukemia. 2007 Mar;21(3):462–71. doi: 10.1038/sj.leu.2404546. [DOI] [PubMed] [Google Scholar]
- 27.Solnica-Krezel L, Schier AF, Driever W. Efficient recovery of ENU-induced mutations from the zebrafish germline. Genetics. 1994 Apr;136(4):1401–20. doi: 10.1093/genetics/136.4.1401. [DOI] [PMC free article] [PubMed] [Google Scholar]
- 28.Streisinger G, Walker C, Dower N, Knauber D, Singer F. Production of clones of homozygous diploid zebra fish (Brachydanio rerio) Nature. 1981 May 28;291(5813):293–6. doi: 10.1038/291293a0. [DOI] [PubMed] [Google Scholar]
- 29.Gestl EE, Kauffman EJ, Moore JL, Cheng KC. New conditions for generation of gynogenetic half-tetrad embryos in the zebrafish (Danio rerio) Journal of Heredity. 1997;88(1):76–9. [Google Scholar]
- 30.Bertrand JY, Kim AD, Violette EP, Stachura DL, Cisson JL, Traver D. Definitive hematopoiesis initiates through a committed erythromyeloid progenitor in the zebrafish embryo. Development. 2007 Dec;134(23):4147–56. doi: 10.1242/dev.012385. [DOI] [PMC free article] [PubMed] [Google Scholar]
- 31.Traver D, Paw BH, Poss KD, Penberthy WT, Lin S, Zon LI. Transplantation and in vivo imaging of multilineage engraftment in zebrafish bloodless mutants. Nat Immunol. 2003 Dec;4(12):1238–46. doi: 10.1038/ni1007. [DOI] [PubMed] [Google Scholar]
- 32.Langenau DM, Ferrando AA, Traver D, Kutok JL, Hezel JP, Kanki JP, et al. In vivo tracking of T cell development, ablation, and engraftment in transgenic zebrafish. Proc Natl Acad Sci U S A. 2004 May 11;101(19):7369–74. doi: 10.1073/pnas.0402248101. [DOI] [PMC free article] [PubMed] [Google Scholar]
- 33.Haffter P, Granato M, Brand M, Mullins MC, Hammerschmidt M, Kane DA, et al. The identification of genes with unique and essential functions in the development of the zebrafish, Danio rerio. Development. 1996 Dec;123:1–36. doi: 10.1242/dev.123.1.1. [DOI] [PubMed] [Google Scholar]
- 34.Geisler R, Rauch GJ, Geiger-Rudolph S, Albrecht A, van Bebber F, Berger A, et al. Large-scale mapping of mutations affecting zebrafish development. BMC Genomics. 2007;8:11. doi: 10.1186/1471-2164-8-11. [DOI] [PMC free article] [PubMed] [Google Scholar]
- 35.Trede NS, Ota T, Kawasaki H, Paw BH, Katz T, Demarest B, et al. Zebrafish mutants with disrupted early T-cell and thymus development identified in early pressure screen. Dev Dyn. 2008 Sep;237(9):2575–84. doi: 10.1002/dvdy.21683. [DOI] [PMC free article] [PubMed] [Google Scholar]
- 36.Lutzner M, Edelson R, Schein P, Green I, Kirkpatrick C, Ahmed A. Cutaneous T-cell lymphomas: the Sezary syndrome, mycosis fungoides, and related disorders. Ann Intern Med. 1975 Oct;83(4):534–52. doi: 10.7326/0003-4819-83-4-534. [DOI] [PubMed] [Google Scholar]
- 37.Hicks J, Mierau GW. The spectrum of pediatric tumors in infancy, childhood, and adolescence: a comprehensive review with emphasis on special techniques in diagnosis. Ultrastruct Pathol. 2005 May-Aug;29(3–4):175–202. doi: 10.1080/01913120590951185. [DOI] [PubMed] [Google Scholar]
- 38.Borowitz MJCJ. T-lymphoblastic leukaemia/lymphoma. In: Swerdlow SH, Campos E, Harris NL, Jaffe EF, Pileri SA, Stein H, Thiele J, Vardiman JW, editors. WHO Classification of Tumours of Haematopoietic and Lymphoid Tissues. Lyon: IARC Press; 2008. pp. 176–8. [Google Scholar]
- 39.Fay D, Spencer A. Genetic Mapping and Manipulation: Chapter 8 - Dominant Mutations. Wormbook; Feb 17, 2006. Community TCER. [DOI] [PMC free article] [PubMed] [Google Scholar]
- 40.Zhuravleva J, Paggetti J, Martin L, Hammann A, Solary E, Bastie JN, et al. MOZ/TIF2-induced acute myeloid leukaemia in transgenic fish. Br J Haematol. 2008 Nov;143(3):378–82. doi: 10.1111/j.1365-2141.2008.07362.x. [DOI] [PubMed] [Google Scholar]
- 41.Sabaawy HE, Azuma M, Embree LJ, Tsai HJ, Starost MF, Hickstein DD. TEL-AML1 transgenic zebrafish model of precursor B cell acute lymphoblastic leukemia. Proc Natl Acad Sci U S A. 2006 Oct 10;103(41):15166–71. doi: 10.1073/pnas.0603349103. [DOI] [PMC free article] [PubMed] [Google Scholar]
- 42.Scott RH, Homfray T, Huxter NL, Mitton SG, Nash R, Potter MN, et al. Familial T-cell non-Hodgkin lymphoma caused by biallelic MSH2 mutations. J Med Genet. 2007 Jul;44(7):e83. doi: 10.1136/jmg.2007.048942. [DOI] [PMC free article] [PubMed] [Google Scholar]
- 43.Langenau DM, Jette C, Berghmans S, Palomero T, Kanki JP, Kutok JL, et al. Suppression of apoptosis by bcl-2 overexpression in lymphoid cells of transgenic zebrafish. Blood. 2005 Apr 15;105(8):3278–85. doi: 10.1182/blood-2004-08-3073. [DOI] [PubMed] [Google Scholar]
- 44.Bernt KM, Armstrong SA. Leukemia stem cells and human acute lymphoblastic leukemia. Semin Hematol. 2009 Jan;46(1):33–8. doi: 10.1053/j.seminhematol.2008.09.010. [DOI] [PMC free article] [PubMed] [Google Scholar]
- 45.Traver D, Winzeler A, Stern HM, Mayhall EA, Langenau DM, Kutok JL, et al. Effects of lethal irradiation in zebrafish and rescue by hematopoietic cell transplantation. Blood. 2004 Sep 1;104(5):1298–305. doi: 10.1182/blood-2004-01-0100. [DOI] [PubMed] [Google Scholar]
- 46.Tropepe V, Coles BL, Chiasson BJ, Horsford DJ, Elia AJ, McInnes RR, et al. Retinal stem cells in the adult mammalian eye. Science. 2000 Mar 17;287(5460):2032–6. doi: 10.1126/science.287.5460.2032. [DOI] [PubMed] [Google Scholar]
- 47.Langenau DM, Keefe MD, Storer NY, Jette CA, Smith AC, Ceol CJ, et al. Co-injection strategies to modify radiation sensitivity and tumor initiation in transgenic Zebrafish. Oncogene. 2008 Jul 10;27(30):4242–8. doi: 10.1038/onc.2008.56. [DOI] [PMC free article] [PubMed] [Google Scholar]
Associated Data
This section collects any data citations, data availability statements, or supplementary materials included in this article.