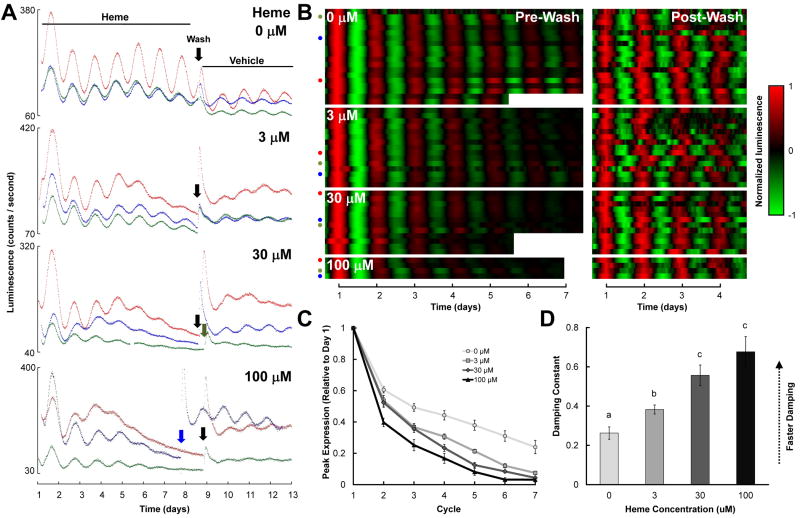
Figure 1.
Effects of heme on PER2∷LUC rhythms in mouse SCN explants. A, B Three representative raw bioluminescence traces (A) and all baseline-subtracted, smoothed data (B) for SCNs treated with 0-100 μM heme (left panels in B); cultures were subsequently washed and transferred to control media at the time indicated by the downward arrows in A, and bioluminescence monitoring was continued (right panels in B). Tissue was dissected on day 0 (not shown). In B, each heatmap row represents a different culture, the x-axis indicates time (with t = 1 corresponding to the time of peak luminescence on day 1 in the left panels and to the time of peak luminescence on the day following the media change in the right panels), colors represent luminescence level as indicated in the key to the right, pre- and post-media change data were normalized independently, and colored dots indicate the cultures illustrated by traces in part A. C, Mean peak PER2:LUC expression during each circadian cycle prior to the media change, normalized to peak expression on the day after dissection (Cycle 1). D, Mean damping constants for recordings prior to the media change. In this and subsequent figures: groups with the same letters above error bars are statistically similar while groups with different letters are statistically different (Tukey’s HSD, p’s < .05); all error bars indicate ±SEM.

