

Abstract
In 2009, electrophoretically driven DNA separations in slab gels and capillaries have the sepia tones of an old-fashioned technology in the eyes of many, even while they remain ubiquitously used, fill a unique niche, and arguably have yet to reach their full potential. For comic relief, what is old becomes new again: agarose slab gel separations are used to prepare DNA samples for “next-gen” sequencing platforms (e.g., the Illumina and 454 machines)—dsDNA molecules within a certain size range are “cut out” of a gel and recovered for subsequent “massively parallel” pyrosequencing. In this review, we give a Barron lab perspective on how our comprehension of DNA migration mechanisms in electrophoresis has evolved, since the first reports of DNA separations by CE (∼1989) until now, 20 years later. Fused silica capillaries, and borosilicate glass and plastic microchips, quietly offer increasing capacities for fast (and even “ultra-fast”), efficient DNA separations. While the channel-by-channel scaling of both old and new electrophoresis platforms provides key flexibility, it requires each unique DNA sample to be prepared in its own micro- or nanovolume. This Achille's heel of electrophoresis technologies left an opening through which pooled-sample, next-gen DNA sequencing technologies rushed. We shall see, over time, whether sharpening understanding of transitions in DNA migration modes in crosslinked gels, nanogel solutions, and uncrosslinked polymer solutions will allow electrophoretic DNA analysis technologies to flower again. Microchannel electrophoresis, after a quiet period of metamorphosis, may emerge sleeker and more powerful, to claim its own important niche applications.
Keywords: Polyacrylamide, Poly(N, N-dimethylacrylamide), DNA Electrophoresis, Polymer solutions, DNA migration mechanisms, Transient Entanglement Coupling, Reptation
1 Introduction
The field of genomics has been driven for decades by the ability to perform size-based separations of DNA in crosslinked gels and linear polymer solutions. This technique has been utilized for applications ranging from restriction mapping of large chromosomal fragments [1, 2], to genetic fingerprinting via short tandem repeat (STR) analyses [3-8], to one of the defining moments of the 21st century—the sequencing of the entire human genome [9-11], an accomplishment that has almost limitless applications. However, the ability to separate and sequence DNA was not taken at face value, and the need to understand the fundamental electrophoretically driven migration mechanisms behind those separations was born. Both theoretical and experimental investigations have produced a deeper, however still incomplete, understanding of this field, in which it is generally accepted that size-based separations of DNA in crosslinked and linear polymer matrices occur via three separation modalities. Transient entanglement coupling [12-19], Ogston sieving [20-22], and reptation [23-28], along with some minor variations [29-33], depending on the separation environment and experimental conditions, largely account for size-based separation of DNA during electrophoresis. In this review we will begin our discussion with the discovery of the transient entanglement coupling (TEC) mechanism by Barron et al. in the early 1990's [13], and discuss how that discovery has developed into a branch of research within the Barron lab dedicated to understanding the underlying mechanisms behind high-field DNA separations in capillaries and on microfluidic chips.
2 Electrophoretic DNA migration mechanisms
2.1 Transient entanglement coupling
When electrophoresed through a salt-containing buffer, DNA behaves as a free-draining polymer [34] and does not separate by size (to any useful extent) in free solution. Unless one is performing End-Labeled Free-Solution Electrophoresis (ELFSE), also known as Free-Solution Conjugate Electrophoresis (FSCE) [35-38], to achieve DNA size separations it is necessary to electrophorese DNA molecules through either a crosslinked polymer matrix, or a solution of linear polymers. With the advent of capillary and microchip electrophoresis, linear polymer solutions became the matrix of choice for DNA separations because their fluid character allows them to be loaded into and unloaded from tiny separation microchannels with relative ease [39]. When dealing with uncrosslinked polymer solutions for electrophoretic DNA separations, there are three primary concentration regimes of concern. As shown in Equation 1, these three regimes are defined by the values C* and Ce, the overlap and entanglement concentrations, respectively, which depend on the average molar mass and physical and chemical properties of a specific polymer, and are impacted as well by its affinity for the aqueous solvent. When the average concentration of the polymer in solution is at or below the concentration found within a single polymer coil, C*, it is considered to be a “dilute” polymer solution. It is within this regime that the transient entanglement coupling (TEC) mechanism was discovered and given its name [12-14].
| (1) |
When a polymer solution is dilute and there are few or no entanglements between chains, i.e. C < C*, matrix polymer coils drift about and are reasonably well spaced in solution, interacting primarily with solvent. The polymer coils, though not entangled with each other, can be caught and dragged by rapidly electromigrating DNA molecules. Once caught, the matrix polymers' random-coil chain configurations become deformed by strong local interactions involving physical chain coupling and hydrodynamics, and the same is true for the DNA molecules that drag them. As it was articulated in 1993, the physical dragging of matrix polymers by DNA was a mechanism of size separation for which the only clear precedent was the work of Hans Joachim Bode in 1976-1979, when he added water-soluble linear polymers into buffers in which he ran agarose gels, and observed improved dsDNA resolution. Dr. Bode also dissolved linear polymers in packed beds of glass beads, and showed that this could provide decent SDS-protein separations. These excellent ideas, observations and insights occurred just a few years after the 1974 publication of Rauno Virtanen's seminal Ph.D. work in developing zone electrophoresis in narrow-bore tubes (200-500 μm i.d.); together Bode and Virtanen could have done great things, however, they lived far apart from each other, and did not collaborate.
The world has become increasingly small. In late 1992, in a quiet student office at U.C. Berkeley, 2nd-year chemical engineering Ph.D. student Annelise Barron suddenly realized (while her lab's lone CE instrument—a donated ABI breadboard literally built on plywood, which pre-dated ABI's 270A—was running a dsDNA separation) that if excellent DNA separations are obtained by counter-migration CE in ultra-dilute polymer solutions, two orders of magnitude in concentration below C* as she had just confirmed, then the only explanation was that the matrix polymers were becoming entangled on and were dragged by electrophoresing DNA; this migration mode can provide quite decent dsDNA separations by counter-migration CE, which gives an unusually long effective capillary length since the DNA swims upstream against EOF. Following these “transient entanglement coupling” collisions, a DNA molecule stretches into a U-shaped conformation, and drags one or more uncharged matrix polymer chains through solution before sliding off, afterward returning to a globular chain configuration and then repeating the process. This mechanism that Barron envisioned in the abstract was later truly “seen” to be occurring via fluorescence videomicroscopy by Michael Morris' group in Michigan; a similar imaging approach was pursued by W. Sunada and H.W. Blanch.
Barron reasoned that the key to the TEC mechanism providing DNA separations is that the number and duration of DNA-polymer chain interactions is dependent on the size of the DNA, in particular, on the cross-sectional area of the coil that an unoriented DNA molecule adopts in dilute solution during electromigration.
This hypothesis was confirmed via theory, represented elegantly in Equations 2-4 [15]. Hubert et al. developed Equation 2 to describe the velocity of a DNA molecule when n polymer strands are being dragged by a DNA molecule, and n ≫ 1. In this scenario, Q is the effective charge of the DNA, E is the electric field intensity, Fdrag is the average drag force imparted by one polymer strand, MDNA is the size of the DNA in base pairs, and ξ is the DNA friction coefficient per base pair. Equation 3 defines the mean lifetime of a given DNA-polymer interaction, where τp is the time required for the polymer to disentangle from the DNA and τDNA is the time required for the DNA to disentangle from the polymer. Lastly, the time between collisions was considered when n < 1, this is where Equation 4 defines VDNA or the velocity of a DNA molecule when DNA is migrating through solution with a time τcoll between interactions. Further verification of the theory was found during experimental studies of individual migrating DNA molecules observed by fluorescence microscopy [16, 40, 41], an example of which can be seen in Figure 1.
Figure 1.
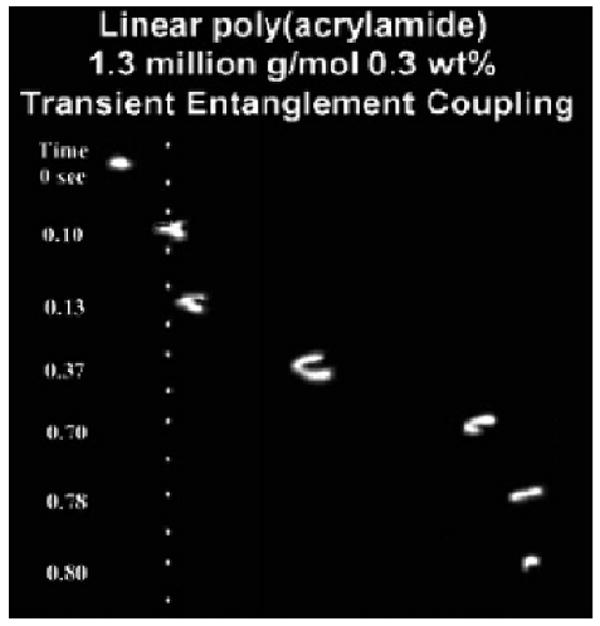
Single-molecule epifluorescent videomicroscopy still-frame captures at indicated time points depicting the transient entanglement coupling mechanism of λ-DNA electrophoresing through a 1.3 MDa, 0.3 wt % linear polyacrylamide solution. The applied electric field is ∼ 130 V/cm, and the white dots have been superimposed over the images to act as reference points. Reproduced with permission from [33].
| (2) |
| (3) |
| (4) |
A useful niche for TEC separations exists in the kb-Mb DNA size range. Smaller DNA fragments do not separate well in these solutions because collisions occur less frequently and the interaction times are negligible. However, it is difficult to separate very large DNA molecules using highly entangled solutions because they take on I-shaped conformations and move with relatively constant electrophoretic velocities regardless of size [28]. The dilute solution viscosities are amenable to use in capillaries and microfluidic chips, and the rapid separation times, in comparison to gels typically used for this process, are very appealing. There are, however, some drawbacks to working in this separation regime. Due to the nature of the random DNA-polymer interactions, band broadening can be significant in these separations, providing (for instance) insufficient resolution for DNA sequencing; however it has very desirable qualities for separations of large DNA restriction fragments, for which a lower peak capacity and moderate resolution are quite useful.
2.2 Reptation
Reptation theory evolved at a healthy pace as the majority of analytical DNA separations were transitioned from being performed on slab gels to capillaries and microfluidic devices. In the case of crosslinked gels, reptation of DNA was previously described with the biased reptation model [24, 25], later modified by Viovy et al. as the biased reptation model with fluctuations [27]. This migration mechanism occurs when a DNA molecule is too large to migrate in a random-coil configuration through the confining structure of a gel, and is forced to enter gel “tubes” end-on, then elongate and “snake” through a series of interconnecting pores. The molecule's “head” chooses the direction it takes, and the rest of the chain must follow. The longer the DNA chain, the more easily it becomes aligned and oriented in a gel network, in an electric field.
The use of crosslinked gels as separation media in capillaries was largely abandoned by 1993, because of numerous problems including bubble formation, channel clogging, and the inability to load a fresh separation matrix following gel degradation [42]. However, it was observed that highly entangled linear polymer solutions, above CE, behave in a similar manner to crosslinked polymer gels, which provided an alternative that could be readily loaded and removed from capillaries and microfluidic chips [43]. Theory, however, did not transition between gels and entangled solutions quite as readily, and modifications to the prevailing theory were necessary to accurately describe the mobility of DNA in uncrosslinked polymer solutions. The “biased reptation with fluctuations” theory can be applied in both types of separation media, because DNA is still forced to elongate and migrate through a “porous” structure created by the entangled polymer network. However, in polymer solutions the separations are complicated by the constant fluctuation and evolution of the “porous” structure as a result of interactions with both DNA, and the reptating nature of the polymer network elements themselves. The resulting mobility of the DNA in these polymer solutions (μtot) is best described by Viovy and Duke [44] as the mobility due to reptation theory in gels (μrep) combined with the mobility due to constraint release (μCR), succinctly shown in Equation 5.
| (5) |
If the constraint release term begins to dominate, size-based separations of DNA become nearly impossible. This can be counteracted by the use of highly entangled polymer solutions, which provide a more robust but still permeable network, and increases the average lifetime of the polymer entanglements [44]. An example of the chain configuration adopted by a large (48.5 kb) dsDNA molecule reptating through a polymer solution is shown in Figure 2.
Figure 2.
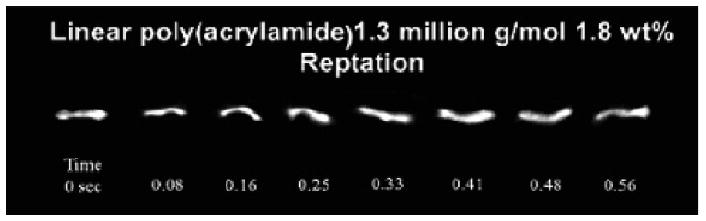
Single-molecule epifluorescent videomicroscopy still-frame captures at indicated time points depicting the reptation mechanism of λ-DNA electrophoresing through a 1.3 MDa, 1.8 wt % linear polyacrylamide solution. The applied electric field is ∼ 130 V/cm. Reproduced with permission from [33].
3 Stochastic single-molecule videomicroscopy methods to measure electrophoretic DNA migration modalities in polymer solutions above and below entanglement
Perhaps the most intriguing regime for DNA separations is the transition between transient entanglement coupling and reptation. Polymer solutions in this region are designated as semi-dilute, since they are bound by C* and Ce (the concentration above which the polymers are fully entangled) and provide a middle-ground between fast, moderate-resolution (TEC) and slower, higher resolution (reptation) separations. Understanding the transition from transient entanglement coupling to reptation and how it correlates with polymer properties can aid in the development of polymer solutions tailored for specific DNA separation requirements, thereby maximizing performance and minimizing separation time. In more recent work, the Barron group studied these three regimes and the transitions between them via single-molecule videomicroscopy of fluorescently labeled λ-DNA fragments utilizing three common separation matrices [45, 46]: linear polyacrylamide (LPA), hydroxyethylcellulose (HEC), and poly(ethylene oxide) (PEO), correlating the occurrence of TEC and reptation events with polymer molar mass and concentration [40]. To accomplish this, a minimum of two 30-second videos were recorded and an average of 30-40 separate DNA molecules' migration mechanisms were tabulated as they electrophoresed through a given polymer solution. This was repeated for at least 10 separate concentrations ranging from 0.01 % (w/w) to 4 % (w/w) for each polymer molar mass at a constant field strength of ∼100 V/cm.
To help better understand the correlation between polymer properties and the observed migration mechanisms, we adopted a method that previously had been used to “reduce” or “collapse” a large amount of data on the polymer solution's specific viscosity and normalized concentration into one, universal curve [47]. It was found that the migration mechanism data could be condensed in a similar manner, and the resulting curves are shown in Figure 3. Here we have presented specific viscosity and mechanistic data from matrixes with three different LPA molar masses, versus the normalized concentration, C/C*, in a range from 0.1 to 11 times C*. It is clear that when concentrations near C* were probed (C/C* = 1), TEC was the dominant mechanism, however as the polymer concentration was increased, reptation became more common until the fully entangled regime was achieved, and reptation was the predominant mode of migration. Both sets of data follow a power law relationship until the entanglement concentration is reached, where a new power law curve can be fit to the data. This sharp increase in slope correlated to the entanglement concentration of the polymer and was found to be ∼6.5C* for LPA, ∼5C* for HEC and ∼3.5C* for PEO. The difference in normalized entanglement concentrations for different polymers was expected, given the quite distinct chemical structures of the polymers, since intrinsic steric hindrances alter the degree of polymer chain solvation and the level of inter-chain contact upon entanglement. The result we obtained, however, is a universal curve that can aid in determining optimum polymer solution concentration ranges to achieve a desired combination of speed (TEC) and resolution (reptation) for a specific purpose.
Figure 3.
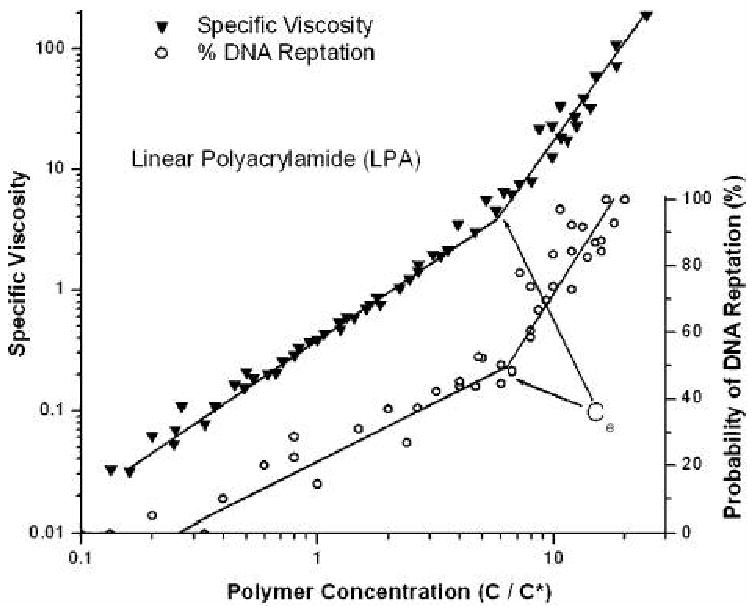
Specific viscosity and probability of DNA reptation events during electrophoresis are plotted against concentration relative to C*, the overlap concentration, for three LPA polymers with molar masses of 500,000 g/mol 1,200,000 g/mol and 3,600,000 g/mol. The specific viscosity of these polymer solutions reduce down and overlap to a single trend of increasing viscosity with a marked increase in slope at the entanglement concentration, Ce, near 6.5C*. The probability of DNA reptation also reduces to a universal scaling with increasing probability of reptation vs. polymer concentration. As with the case in the viscosity data a marked increase in slope in reptation events develops at Ce. Lines have been drawn to aid the eye. Reproduced with permission from [40].
This study also tied together nicely with early predictions by Barron et al. [12-14] and theoretical studies by Hubert et al. [15], in that it was observed that TEC events occurred with a greater frequency in polymer solutions with larger molar masses. This is a result of longer DNA-polymer entanglement times, as briefly discussed in Section 2.
4 Hydrophobically modified polyacrylamides (HMPAMs) for fast, high-resolution DNA separations by capillary and microchip electrophoresis
We created an interesting twist on a traditional CE separation polymer, linear polyacrylamide, by copolymerizing acrylamide with small blocks of hydrophobic N,N-dialkylacrylamides, which become incorporated in “blocks” by a micellar polymerization method. When these hydrophobically modified polyacrylamides (HMPAMs) were used in conjunction with a poly-N-hydroxyethylacrylamide (pHEA) microchannel wall coating [48], it was shown that proteins could be removed from solution, electrophoretically, via hydrophobic adsorption of proteins, presumably on the alkylacrylamide blocks [41]. As mentioned above, to best utilize the hydrophobe incorporated into the copolymers, the copolymers were synthesized so that small groups of hydrophobic acrylamide monomers were dispersed randomly throughout the polymer backbone. The free-radical micellar polymerization method involved the use of sodium dodecyl sulfate (SDS) micelles to sequester and cluster the hydrophobes. The hydrophobic alkyl- or dialkylacrylamide monomers remained within the cores of the SDS micelles until encountered by a growing polymer chain, and then could be incorporated all at once, and integrated into the polymer backbone in groups during polymerization [49-53].
The materials used in this electrophoretic “hydrophobic guard column” have a unique ability to form physical crosslinks between the hydrophobic blocks in aqueous solution [50, 54]. This physical association unfortunately (for CE) creates an increase in viscosity when compared to matched-molar mass LPA homopolymers; however these physical crosslinks break or become dissociated when the polymer solution is placed under shear [55], such as occurs while loading a microfluidic channel, and then re-form when the external force is removed. This results in very similar channel loading times, when compared to matched-molar mass homopolymers, even though the zero-shear viscosities tend to be much higher. When testing these materials, Chiesl et al. observed an unanticipated result where it was found that not only could DNA freely pass through these matrixes (without being slowed down like proteins), but it also separated with substantially higher resolution in some cases [33, 41]. Currently, there are two possible explanations for this increase in separation performance, which depend on the concentration regime of the polymer in solution.
4.1 Interchain hydrophobic association
In the region of hydrophobic association [54, 56], similar to the semi-dilute regime discussed previously, it was observed that faster, yet equivalently resolved, DNA separations could be achieved with HMPAMs as compared with LPA homopolymers of matched molar mass. The cause of this was hypothesized to be a novel migration mechanism, which had never been observed previously in linear polymer solutions. This mechanism was coined “stationary entanglement coupling” [33] and can be seen in Figure 4. In this regime the hydrophobic blocks in the copolymers create physical crosslinks between the polymer chains, dramatically increasing the rigidity of the polymer network as “sensed” by migrating DNA molecules. The result is a stiffened LPA matrix with relatively large average pore sizes. Therefore it should not be surprising that the observed mechanism has been previously seen in agarose gels, which also have large average pore sizes and robust structures in comparison to typical entangled polymer solutions [29-32]. During stationary entanglement coupling mode migration, a DNA molecule collides with a polymer chain and extends into a U-shape, similar to events discussed previously pertaining to transient entanglement coupling. However, in this scenario the DNA molecule and polymer chain remain at a constant position until the DNA disentangles from the polymer network. Further confirmation that this mechanism is unique to the rigid HMPAM copolymer system was found during the previously discussed videomicroscopic imaging study in the Barron lab, where no instances of stationary entanglement coupling were observed in any of the LPA solutions (lacking blocks of hydrophobe) over a wide range of polymer concentrations.
Figure 4.
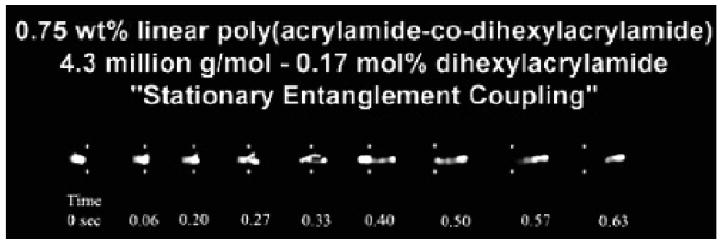
Single-molecule epifluorescent videomicroscopy still-frame captures at indicated time points depicting the “stationary entanglement coupling” mechanism of λ-DNA. The DNA was electrophoresing through a 4.3 MDa, 0.75 wt % linear polyacrylamide-co-dihexylacrylamide solution with 0.17 mol dihexylacrylamide. The applied electric field is ∼ 130 V/cm and the white dots have been superimposed over the images to act as reference points. Reproduced with permission from [33].
The similarity of migration mechanisms observed in the copolymer matrixes to those seen in agarose slab gels requires further study. By combining these matrixes with pulsed-field electrophoresis techniques, such as those that have been used very successfully with agarose gels [57, 58], they could be exploited for separating large dsDNA molecules quickly and with high resolution using capillary and microfluidic electrophoresis systems.
4.2 Polymer chain entanglement with physical cross,links
As the concentration of the hydrophobically modified polyacrylamide was increased into the entanglement regime, another intriguing observation was made. The migration time of the dsDNA decreased slightly, however with this came an increase in resolution [33, 59]. Even with the incorporation of as little as ∼ 0.1 mol % of N,N-dihexylacrylamide monomer in blocks into the copolymer, these HMPAM matrixes provide up to a 10% increase in average DNA sequencing read length over LPA homopolymers of matched molar mass [59]. This increase in resolution has also been attributed to the intermolecular physical crosslinking taking place between the hydrophobic blocks. However, in the entangled regime for HMPAMs, it is believed that the crosslinks simply are simulating a larger molar mass homopolymer, thereby resulting in longer average sequencing read lengths. Specifically, on a 7.5-cm glass offset T microfluidic chip, an average of 554 to 583 bases/run have been sequenced in 9.5-11.5 minutes using 4% (w/w) solutions of the copolymer, depending on the average molar mass of the copolymer (ranging from ∼1.4 to 7.3 MDa), with the longest sequencing read in excess of 600 bases (98.5% accuracy)[59].
Another factor contributing to the improvement in DNA sequencing read lengths was found by calculating DE, or the apparent dispersion coefficients of a ssDNA ladder while electrophoresing through a polymer matrix. Using Equation 6 we quantified the amount of peak broadening in the matched molar mass copolymer and homopolymer systems, even though the migration times of the respective DNA fragments were slightly different [60]. This can be accomplished because DE takes into account effects from both Brownian motion and dispersion caused by the DNA electrophoresing through the polymer matrix. In Equation 6, tr is the time required for each DNA peak to elute, Wt is the full-width at half-max for each DNA peak, μ is the DNA fragment mobility with an electric field strength E, and winj is the initial injection plug width.
| (6) |
The apparent dispersion coefficients were calculated for the ssDNA fragments moving through 4% (w/w) 1.4 and 2.8 MDa copolymer and homopolymer matrixes, and data for the 1.4 MDa polymer solutions are shown in Figure 5. The dispersion coefficients decrease with DNA size for both matrixes, however at ∼300 bp a deviation between the two curves is seen. In this region, it was observed that DE decreased less rapidly with DNA size in the homopolymer system. The larger DNA sizes are where the difference in read length was found between the two matrixes and the slightly higher dispersion coefficients in the homopolymer matrixes are likely decreasing the resolution for the larger DNA molecules and thereby contributing to the shorter overall read lengths. Similar observations were made when comparing the 2.8 MDa copolymer and homopolymer separation matrixes. This provides an indication that the mode of DNA migration in a polymer network can strongly affect peak efficiencies.
Figure 5.

The DNA dispersion coefficients, DE, are shown for ssDNA fragments electromigrating through 1.4 MDa LPA and LPAcoDHA polymer solutions at 4% (w/w) on a 7.5-cm effective length glass microfluidic chip at 180 V/cm. Error bars were calculated using the standard deviations for both the measured migration time and final peak width of each fragment with n=2.
The result of performing sequencing separations in the entangled regime with HMPAMs is a polymer matrix that provides very high-resolution separations over a short distance, which can also be loaded into a microfluidic device without difficulty. Achieving these separation capabilities is essential for obtaining the long contiguous read lengths required for multiplexed genome sequencing systems [61] and single-channel microfluidic devices likely to be used in medical and forensic studies [5-7].
5 Poly(N,N-dimethylacrylamide) (pDMA) matrixes for ssDNA separations
5.1 Evidence for a hybrid separation mechanism
Another focus of our research has been to develop poly(N,N-dimethylacrylamide) (pDMA) matrixes for DNA separations, specifically for microchip electrophoresis applications. Using pDMA matrixes developed in our laboratory, we have observed ssDNA migration patterns that only qualitatively agree with the theoretical predictions put forth by reptation models, in which the fragment mobilities are inversely proportional to the fragment size. In the reptation limit, a log-log plot of the fragment mobility versus fragment size would have a limiting slope of −1 [24-27, 62]. However, our data in the power-law region of this log-log plot approach slopes of −0.45 to -0.60, depending on the polymer concentration [63]. In fact, these values lie between the value of −1 predicted by reptation theory and the slopes observed in this region of the log-log plot for fragments undergoing TEC, which yielded values between −0.26 and 0 [13].
In addition to mobility plots, we investigated these pDMA matrixes spectroscopically by fluorescently labeling large λ-DNA fragments and collecting the sequential fluorescence images digitally using a CCD camera using the same technique discussed in the previous sections [63]. Since the length of the λ-DNA is much larger than its Kuhn length, it is a highly flexible molecule and is not limited in its conformation. As is seen in Figure 6, which is comprised of both stills and time lapses of the migrating molecules as they electrophorese within a 3% (w/v) pDMA network, very clear images of the DNA strand can be taken. The upper molecule reptates through the entire viewing frame in the given time. The lower molecule is reptating at first, but then changes conformation to the U-shape, as in Figure 6b. The lower molecule then continues to migrate towards the anode while maintaining its U-shape, indicating that it is dragging the polymers that it is hooked upon through the network. We were intrigued that these migratory dynamics are reminiscent of transient entanglement coupling, but are not occurring in an ultra-dilute polymer solution. The polymer concentration is much higher than the overlap threshold concentration C*; the polymer solution can be characterized as semi-dilute. Based on the previously mentioned videomicroscopy study by our group, where it was shown that the migration mode of λ-DNA is highly dependent on the extent of entanglement of the polymer matrix [40] and the two migration modes observed simultaneously in Figure 6c, one can postulate that a similar hybrid mechanism can occur when ssDNA fragments (with similar chain flexibilities to λ-DNA) are separated in a polymer separation matrix.
Figure 6.
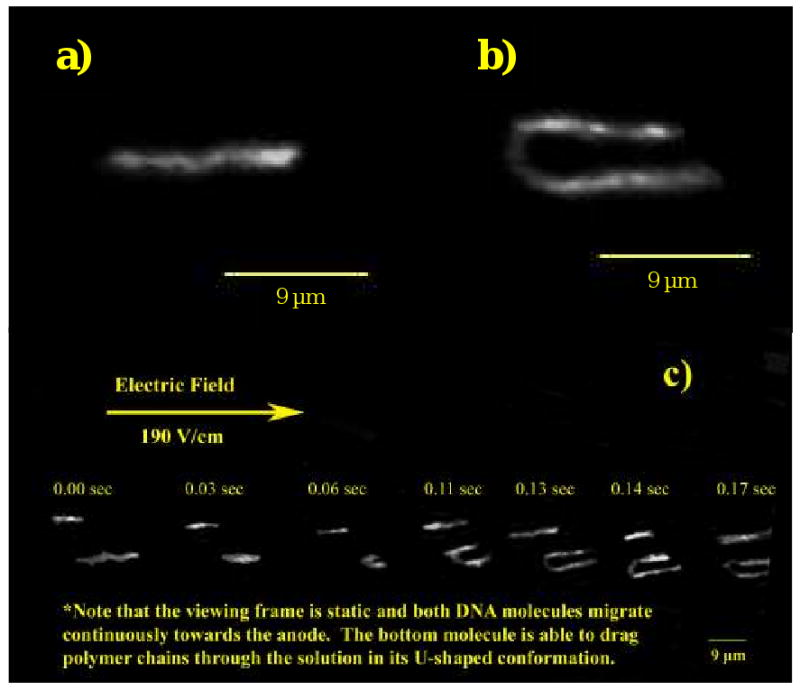
Images captured from DNA imaging videos. A) λ-DNA is reptating through the polymer network. B) This is an image of a λ-DNA molecule that has hooked around the polymer matrix in a U-shaped conformation and is dragging the disentangled matrix polymers. C) A series of frames at the shown time intervals show two DNA molecules moving through the network (same molecules in a and b). The top molecule reptates through the entire viewing frame in the given time. The lower molecule is reptating at first and then hooks and drags the polymer network through the viewing frame. Reproduced with permission from [63].
Using a pDMA matrix similar to the one used for the videomicroscopy study shown in Figure 6, we have shown that sequencing read lengths of up to 550 bases are achievable on a borosilicate glass microfluidic chip in less than 6 minutes when we use a 4% pDMA matrix with a molar mass of 3.4 MDa, a high electric field strength of 235 V/cm, and a short separation distance of just 7.5 cm. When the polymer concentration is increased slightly to 5% (w/v) 3.4 MDa pDMA, the read length is slightly reduced. However, when the 3.4 MDa pDMA is blended and dissolved with a 280 kDa pDMA at concentrations of 3% (w/v) and 1% (w/v), respectively, as well as 3% (w/v) and 2% (w/v) respectively, similarly to previous work using blended matrixes [64-67], DNA sequencing read lengths of up to 587 bases in 6 minutes and 601 bases in 6.5 minutes could be achieved, respectively. These results indicate that long read lengths are possible, even in short (7.5-cm) microchannels, in a polymer matrix that has been appropriately tuned (with regard to physical properties) for this separation platform. The availability of a high-performance wall coating to suppress EOF and reduce DNA adsorption is important, though, for the obtainment of such nice separations, as discussed in the paper.
It is important to note that all prior microchip-based sequencing efforts had focused on utilizing LPA as the DNA separation matrix. Prior four-color sequencing studies of other labs using LPA matrixes showed the possibility of obtaining 430 bases in 24 minutes with a 16-cm separation length [61], 580 bases in 18 minutes with an 11.5-cm separation length [66], and 500 bases in 20 minutes with a 6.5-cm separation length [68]. While our pDMA matrixes yield very similar read lengths to these other microchip-based sequencing results, they are completed in about one-third the time, and we attribute that to the fact that our blended polymer matrix leads to a “mixed mode” of DNA migration, essentially a temporal and spatial blend of TEC and reptation modes, which occurs only because of the very particular physical properties of the entangled polymer network. Because in fact this “ultra-fast” migration by mixed-mode DNA chain dynamics was discovered serendipitously, it must be considered as a “discovery”, rather than a new technology that was “designed.” But, chance favors the prepared mind, and sometimes, dogged, thorough, and methodical experimentation with seemingly well-understood systems can reveal surprising, emergent results. Had the young Professor Barron listened to the sage advice of some of the silver-crowned heads of CE, she would never have continued her work in this area long enough for her group to have made this discovery.
5.2 Comparison of pDMA with commercially available matrixes
Less than 15 years ago, the only means by which one could obtain these long DNA sequencing read lengths was by utilizing capillary array electrophoresis (CAE), which normally employs 35-60 cm separation lengths and requires 1-2 hours of electrophoresis. These commercial, capillary-based systems have been optimized to routinely yield read lengths of 700-900 bases in 8-, 16-, 96-, or 384-capillary arrays, depending on the instrument. An integral aspect of this optimization was the development of robust polymer networks that delivered long reads, such as the LongRead™ LPA matrix for the GE-Amersham/Molecular Dynamics MegaBACE CAE instruments and the POP™-series of polymers for ABI CAE instruments. In fact, we have found that the log-log plot of electrophoretic mobility versus DNA fragment size for ssDNA in the sequencing size range (0-600 bases) approaches the expected limiting slope for “pure” DNA reptation of −1, as shown in Figure 7 for T-terminated ssDNA sequencing fragments migrating through POP-7™ according to manufacturer directions.
Figure 7.

A log-log plot of T-terminated ssDNA sequencing fragments mobility as a function of fragment size with as-purchased POP-7™ as the separation matrix in a capillary on the ABI 3100. The slope of these data in the power law region approaches −1, which is the relationship predicted by the biased reptation model. Running temperature for these experiments was 55 °C.
Despite their optimization for DNA sequencing by CAE, we have shown that these materials yield much shorter read lengths when they are used for DNA sequencing within a microfluidic chip, than they do for a capillary [69]. This result was contrary to a widely held assumption that microfluidic platforms could perform high-quality DNA sequencing separations simply by inserting a matrix developed for a capillary-based instrument into a microfluidic chip. In this study, pDMA synthesized in our laboratory yields comparable sequencing results to POP-6™ in a 16-capillary array on an ABI 3100, but achieves these results in ∼1/3 the time. In addition, the microfluidic chip sequencing ability of this same pDMA that was synthesized in our laboratory was compared to those of POP-5™, POP-6™, POP-7™, and LongRead™ LPA.
The commercial matrixes were also used for four-color DNA sequencing in a borosilicate glass microfluidic chip with a separation distance of 7.5 cm, coated with poly-N,N,-hydroxyethylacrylamide (since POPs do not coat borosilicate glass). The average read lengths obtained in the polymer networks optimized for capillary separations were 378 bases, 417 bases, 434 bases, and < 300 bases for POP-5™, POP-6™, POP-7™, and LongRead™, respectively. In contrast, pDMA matrixes formulated in our lab resulted in average read lengths of ∼ 575 bases. From these results, we conclude that polymer separation matrixes designed for use in CAE systems are not necessarily the most effective matrixes in a microfluidic chip. Future development of microfluidic platforms for DNA separations, especially for long-read DNA sequencing, will likely demand focused separate matrix development and optimization, specifically tailored to the designed platform.
5.3 Band-broadening insights
Based simply on the platform transfer of the commercial matrixes, we set out to understand why the separation quality of ssDNA fragments is so much lower with the matrixes designed for use in CAE systems than our pDMA formulations. In a manuscript currently under review, we describe results we have obtained that impart a better understanding of the crucial dynamics involved in ssDNA separations on a microfluidic chip. Specifically, we performed electrophoresis of ssDNA fragments using LongRead™ LPA and a pDMA synthesized in our lab as the separation matrixes, keeping all other experimental parameters constant. We analyzed the data in the context of both the fragment selectivities and the peak widths—the two components of peak resolution—and found that the selectivities between the two matrixes are nearly identical. However, the measured peak widths are much larger in the LongRead™ matrix, for ssDNA fragment sizes larger than 200 bases.
By considering the dispersion coefficient of the ssDNA fragments in each matrix, as was discussed in section 4.2, instead of just selectivity and peak widths, we are able to normalize the data taken in each matrix so that they can be compared directly. In the pDMA matrix, we observe a sharp decrease in the dispersion coefficient as a function of increasing DNA fragment size. In the LongRead™ matrix, we observe an initial decrease in the dispersion coefficient up to approximately 200 bases, similar to that observed in the pDMA, after which we observe a marked increase in the apparent DNA dispersion coefficient up to 400 bases, followed by a plateau in the dispersion coefficient to 900 bases. While this dispersion behavior is not expected within the confines of the biased reptation model, a mechanism called geometration actually predicts such an increase in the dispersion coefficient [70]. Within the geometration mechanism, which was developed to describe large dsDNA molecules moving through crosslinked gels, an electromigrating DNA molecule becomes uncoiled in a “U” shape around a polymer fiber, with the polymer at the apex [29]. Due to the uniform electromotive force acting on each end of the unwound DNA coil, the DNA remains entrained on the stationary polymer fiber until one of the ends pulls the other around the polymer molecule, at which point the DNA and polymer become disengaged. This mechanism is qualitatively similar to the hypothesized mechanism above, which was used to describe the behavior of ssDNA molecules in a less robust pDMA matrix, but rather than the DNA molecules pulling polymer molecules through the entangled network, these polymer molecules are too strongly entangled to be pulled out of the established, entangled polymer network. Therefore the polymer molecules remain static, and the migrating ssDNA molecules must hook over and then pull off, or else move around those static obstacles during electrophoresis. For reasons we do not yet fully understand, this seems to lead to an increasingly wide distribution of migration times for DNA molecules of a given size, as DNA size increases. We have hypothesized that the physical “strength” of the polymer network as experienced by the electromigrating DNA, and thereby the ability of a DNA molecule to disrupt that network if it becomes entangled and trapped, greatly affects the overall separation mechanism and determines the degree to which a polymer network can serve as an effective DNA separation matrix that gives narrow bands as well as high selectivity as a function of DNA chain length.
6 Concluding remarks
The research and development of new approaches for capillary electrophoresis separations of DNA, including the competitive quest for an optimum polymer matrix as well as an understanding of what promotes and limits the DNA separations, enjoyed its heyday between about 1989 and 1999. The CE research community quieted down after that and certainly, many fewer publications appeared in this area over the past 10 years. Even so, it has been satisfying to us that, with the continued support of NIH/NHGRI, by moving to tailor-made polymers and copolymers and focusing on microfluidic chips rather than fused silica capillaries, we continue to see surprising new aspects of DNA migration and separation mechanism, as well as to surprise ourselves with the unexpectedly impressive capabilities of microchip electrophoresis technologies, such as our recent observation of “ultra-fast”, long-read DNA sequencing on a chip. Thus far, we have only shown this extremely fast DNA sequencing in a microchip with a single, 20 μm deep × 80 μm wide microchannel. Since it is not only the read length, speed and quality of a separation, but for many applications, also the overall throughput and per-base cost of a DNA analysis system that is key, ultra-fast long-read sequencing likely will remain a curiosity with niche applications, until capillary or microchip electrophoresis is successfully parallelized more massively, from today's 96- or 384-capillary arrays to something like 10,000 or 40,000 channels in parallel. A 40,000-channel CE system with 10-minute turnaround times for each 500-base read could give a sub-$1000 human genome—but if and only if a single-tube, parallelized method of Sanger sample preparation and injection is also developed, to feed such a beast. Currently, these may both seem like ridiculously tall orders, but we think that there may be a few innovative ways by which these engineering tasks could be accomplished, and we are working on these. The high-quality, ultra-long reads (relative to most current next-gen technologies) that are obtainable with capillary or microchip electrophoresis system will continue to offer unique advantages for certain applications in genome analysis, and these can be developed for 96-channel microchip systems such as that developed by the Mathies lab at U.C. Berkeley.
Acknowledgments
The authors would like to acknowledge Karl Putz for his help with rheology measurements. This publication was made possible by Grant Number 5 R01 HG001970-06 from the NIH/National Human Genome Research Institute. Its contents are solely the responsibility of the authors and do not necessarily represent the official views of the National Human Genome Research Institute, National Institutes of Health.
Abbreviation
- TEC
transient entanglement coupling
- HMPAM
hydrophobically modified polyacrylamide
- pDMA
poly(N,N-dimethylacrylamide)
- dsDNA
double-stranded DNA
- ssDNA
single-stranded DNA
- DHA
N,N-dihexylacrylamide
- pHEA
poly-N-hydroxyethylacrylamide
- CAE
capillary array electrophoresis
- LPA
linear polyacrylamide
- SDS
sodium dodecyl sulfate
- LIF
laser induced fluorescence
Footnotes
(See reference 63, Supporting Information, Figure S1, for a detailed plot showing these concentration regimes in a polymer solution for DNA electrophoresis.)
References
- 1.Maschke HE, Frenz J, Belenkii A, Karger BL, Hancock WS. Electrophoresis. 1993;14:509–514. doi: 10.1002/elps.1150140178. [DOI] [PubMed] [Google Scholar]
- 2.Kleemiss MH, Gilges M, Schomburg G. Electrophoresis. 1993;14:515–522. doi: 10.1002/elps.1150140179. [DOI] [PubMed] [Google Scholar]
- 3.Edwards A, Civitello A, Hammond HA, Caskey CT. American Journal of Human Genetics. 1991;49:746–756. [PMC free article] [PubMed] [Google Scholar]
- 4.Bienvenue JM, Duncalf N, Marchiarullo D, Ferrance JP, Landers JP. Journal of Forensic Sciences. 2006;51:266–273. doi: 10.1111/j.1556-4029.2006.00054.x. [DOI] [PubMed] [Google Scholar]
- 5.Horsman KM, Bienvenue JM, Blasier KR, Landers JP. Journal of Forensic Sciences. 2007;52:784–799. doi: 10.1111/j.1556-4029.2007.00468.x. [DOI] [PubMed] [Google Scholar]
- 6.Yeung SHI, Liu P, Del Bueno N, Greenspoon SA, Mathies RA. Analytical Chemistry. 2009;81:210–217. doi: 10.1021/ac8018685. [DOI] [PubMed] [Google Scholar]
- 7.Wang Y, Wallin JM, Ju JY, Sensabaugh GF, Mathies RA. Electrophoresis. 1996;17:1485–1490. doi: 10.1002/elps.1150170913. [DOI] [PubMed] [Google Scholar]
- 8.Liu P, Seo TS, Beyor N, Shin KJ, et al. Analytical Chemistry. 2007;79:1881–1889. doi: 10.1021/ac061961k. [DOI] [PubMed] [Google Scholar]
- 9.Venter JC, Adams MD, Myers EW, Li PW, et al. Science. 2001;291:1304–1351. doi: 10.1126/science.1058040. [DOI] [PubMed] [Google Scholar]
- 10.Lander ES, Linton LM, Birren B, Nusbaum C, et al. Nature. 2001;409:860–921. doi: 10.1038/35057062. [DOI] [PubMed] [Google Scholar]
- 11.Collins FS, Lander ES, Rogers J, Waterston RH. Nature. 2004;431:931–945. [Google Scholar]
- 12.Barron AE, Soane DS, Blanch HW. Journal of Chromatography A. 1993;652:3–16. doi: 10.1016/0021-9673(93)80639-P. [DOI] [PubMed] [Google Scholar]
- 13.Barron AE, Blanch HW, Soane DS. Electrophoresis. 1994;15:597–615. doi: 10.1002/elps.1150150184. [DOI] [PubMed] [Google Scholar]
- 14.Barron AE, Sunada WM, Blanch HW. Biotechnology and Bioengineering. 1996;52:259–270. doi: 10.1002/(SICI)1097-0290(19961020)52:2<259::AID-BIT7>3.0.CO;2-P. [DOI] [PubMed] [Google Scholar]
- 15.Hubert SJ, Slater GW, Viovy JL. Macromolecules. 1996;29:1006–1009. [Google Scholar]
- 16.Sunada WM, Blanch HW. Biotechnology Progress. 1998;14:766–772. doi: 10.1021/bp980063+. [DOI] [PubMed] [Google Scholar]
- 17.Noguchi H. Journal of Chemical Physics. 2000;112:9671–9678. [Google Scholar]
- 18.Starkweather ME, Hoagland DA, Muthukumar M. Macromolecules. 2000;33:1245–1253. [Google Scholar]
- 19.Todorov TI, de Carmejane O, Walter NG, Morris MD. Electrophoresis. 2001;22:2442–2447. doi: 10.1002/1522-2683(200107)22:12<2442::AID-ELPS2442>3.0.CO;2-9. [DOI] [PubMed] [Google Scholar]
- 20.Ogston AG. Transactions of the Faraday Society. 1958;54:1754–1757. [Google Scholar]
- 21.Rodbard D, Chrambac A. Proceedings of the National Academy of Sciences of the United States of America. 1970;65:970–&. doi: 10.1073/pnas.65.4.970. [DOI] [PMC free article] [PubMed] [Google Scholar]
- 22.Slater GW, Kenward M, McCormick LC, Gauthier MG. Current Opinion in Biotechnology. 2003;14:58–64. doi: 10.1016/s0958-1669(02)00012-5. [DOI] [PubMed] [Google Scholar]
- 23.Degennes PG. Journal of Chemical Physics. 1971;55:572–&. [Google Scholar]
- 24.Lumpkin OJ, Dejardin P, Zimm BH. Biopolymers. 1985;24:1573–1593. doi: 10.1002/bip.360240812. [DOI] [PubMed] [Google Scholar]
- 25.Slater GW, Noolandi J. Biopolymers. 1986;25:431–454. [Google Scholar]
- 26.Duke T, Viovy JL, Semenov AN. Biopolymers. 1994;34:239–247. [Google Scholar]
- 27.Semenov AN, Duke TAJ, Viovy JL. Physical Review E. 1995;51:1520–1537. doi: 10.1103/physreve.51.1520. [DOI] [PubMed] [Google Scholar]
- 28.Ueda M, Oana H, Baba Y, Doi M, Yoshikawa K. Biophysical Chemistry. 1998;71:113–123. doi: 10.1016/s0301-4622(98)00093-3. [DOI] [PubMed] [Google Scholar]
- 29.Deutsch JM. Science. 1988;240:922–924. doi: 10.1126/science.3363374. [DOI] [PubMed] [Google Scholar]
- 30.Deutsch JM, Madden TL. Journal of Chemical Physics. 1989;90:2476–2485. [Google Scholar]
- 31.Schwartz DC, Koval M. Nature. 1989;338:520–522. doi: 10.1038/338520a0. [DOI] [PubMed] [Google Scholar]
- 32.Gurrieri S, Smith SB, Wells KS, Johnson ID, Bustamante C. Nucleic Acids Research. 1996;24:4759–4767. doi: 10.1093/nar/24.23.4759. [DOI] [PMC free article] [PubMed] [Google Scholar]
- 33.Chiesl TN, Putz KW, Babu M, Mathias P, et al. Analytical Chemistry. 2006;78:4409–4415. doi: 10.1021/ac060193u. [DOI] [PMC free article] [PubMed] [Google Scholar]
- 34.Olivera BM, Baine P, Davidson N. Biopolymers. 1964;2:245–257. [Google Scholar]
- 35.Mayer P, Slater GW, Drouin G. Analytical Chemistry. 1994;66:1777–1780. [Google Scholar]
- 36.Meagher RJ, Won JI, Coyne JA, Lin J, Barron AE. Analytical Chemistry. 2008;80:2842–2848. doi: 10.1021/ac702591t. [DOI] [PubMed] [Google Scholar]
- 37.Meagher RJ, Won JI, McCormick LC, Nedelcu S, et al. Electrophoresis. 2005;26:331–350. doi: 10.1002/elps.200410219. [DOI] [PubMed] [Google Scholar]
- 38.Vreeland WN, Desruisseaux C, Karger AE, Drouin G, et al. Analytical Chemistry. 2001;73:1795–1803. doi: 10.1021/ac001380+. [DOI] [PubMed] [Google Scholar]
- 39.Chiari M, Nesi M, Fazio M, Righetti PG. Electrophoresis. 1992;13:690–697. doi: 10.1002/elps.11501301147. [DOI] [PubMed] [Google Scholar]
- 40.Chiesl TN, Forster RE, Root BE, Larkin M, Barron AE. Analytical Chemistry. 2007;79:7740–7747. doi: 10.1021/ac071160x. [DOI] [PubMed] [Google Scholar]
- 41.Chiesl TN, Shi W, Barron AE. Analytical Chemistry. 2005;77:772–779. doi: 10.1021/ac049000y. [DOI] [PubMed] [Google Scholar]
- 42.Dolnik V. J Microcolumn Sep. 1994;6:315–330. [Google Scholar]
- 43.Viovy JL. Reviews of Modern Physics. 2000;72:813–872. [Google Scholar]
- 44.Viovy JL, Duke T. Electrophoresis. 1993;14:322–329. doi: 10.1002/elps.1150140155. [DOI] [PubMed] [Google Scholar]
- 45.Kantor RM, Guo XH, Huff EJ, Schwartz DC. Biochemical and Biophysical Research Communications. 1999;258:102–108. doi: 10.1006/bbrc.1999.0592. [DOI] [PubMed] [Google Scholar]
- 46.Albargheuthi MN, Barron AE. Electrophoresis. 2000;21:4096–4111. doi: 10.1002/1522-2683(200012)21:18<4096::AID-ELPS4096>3.0.CO;2-W. [DOI] [PubMed] [Google Scholar]
- 47.Heo Y, Larson RG. Journal of Rheology. 2005;49:1117–1128. [Google Scholar]
- 48.Albarghouthi MN, Stein TM, Barron AE. Electrophoresis. 2003;24:1166–1175. doi: 10.1002/elps.200390150. [DOI] [PubMed] [Google Scholar]
- 49.McCormick CL, Nonaka T, Johnson CB. Polymer. 1988;29:731–739. [Google Scholar]
- 50.Hill A, Candau F, Selb J. Macromolecules. 1993;26:4521–4532. [Google Scholar]
- 51.Biggs S, Selb J, Candau F. Langmuir. 1992;8:838–847. [Google Scholar]
- 52.Volpert E, Selb J, Candau F. Polymer. 1998;39:1025–1033. [Google Scholar]
- 53.Kujawa P, Audibert-Hayet A, Selb J, Candau F. Journal of Polymer Science Part a-Polymer Chemistry. 2003;41:3261–3274. [Google Scholar]
- 54.Volpert E, Selb J, Candau F. Macromolecules. 1996;29:1452–1463. [Google Scholar]
- 55.Regalado EJ, Selb J, Candau F. Macromolecules. 1999;32:8580–8588. [Google Scholar]
- 56.Candau F, Regalado EJ, Selb J. Macromolecules. 1998;31:5550–5552. [Google Scholar]
- 57.Schwartz DC, Cantor CR. Cell. 1984;37:67–75. doi: 10.1016/0092-8674(84)90301-5. [DOI] [PubMed] [Google Scholar]
- 58.Carle GF, Frank M, Olson MV. Science. 1986;232:65–68. doi: 10.1126/science.3952500. [DOI] [PubMed] [Google Scholar]
- 59.Forster RE, Chiesl TN, Fredlake CP, White CV, Barron AE. Electrophoresis. 2008;29:4669–4676. doi: 10.1002/elps.200800353. [DOI] [PMC free article] [PubMed] [Google Scholar]
- 60.Luckey JA, Norris TB, Smith LM. Journal of Physical Chemistry. 1993;97:3067–3075. [Google Scholar]
- 61.Paegel BM, Emrich CA, Weyemayer GJ, Scherer JR, Mathies RA. Proceedings of the National Academy of Sciences of the United States of America. 2002;99:574–579. doi: 10.1073/pnas.012608699. [DOI] [PMC free article] [PubMed] [Google Scholar]
- 62.Duke TAJ, Semenov AN, Viovy JL. Physical Review Letters. 1992;69:3260–3263. doi: 10.1103/PhysRevLett.69.3260. [DOI] [PubMed] [Google Scholar]
- 63.Fredlake CP, Hert DG, Kan CW, Chiesl TN, et al. Proceedings of the National Academy of Sciences of the United States of America. 2008;105:476–481. doi: 10.1073/pnas.0705093105. [DOI] [PMC free article] [PubMed] [Google Scholar]
- 64.Bunz AP, Barron AE, Prausnitz JM, Blanch HW. Industrial & Engineering Chemistry Research. 1996;35:2900–2908. [Google Scholar]
- 65.Salas-Solano O, Carrilho E, Kotler L, Miller AW, et al. Analytical Chemistry. 1998;70:3996–4003. doi: 10.1021/ac980457f. [DOI] [PubMed] [Google Scholar]
- 66.Salas-Solano O, Schmalzing D, Koutny L, Buonocore S, et al. Analytical Chemistry. 2000;72:3129–3137. doi: 10.1021/ac000055j. [DOI] [PubMed] [Google Scholar]
- 67.Zhou HH, Miller AW, Sosic Z, Buchholz B, et al. Analytical Chemistry. 2000;72:1045–1052. doi: 10.1021/ac991117c. [DOI] [PubMed] [Google Scholar]
- 68.Liu SR, Shi YN, Ja WW, Mathies RA. Analytical Chemistry. 1999;71:566–573. doi: 10.1021/ac980783v. [DOI] [PubMed] [Google Scholar]
- 69.Fredlake CP, Hert DG, Root BE, Barron AE. Electrophoresis. 2008;29:4652–4662. doi: 10.1002/elps.200800352. [DOI] [PMC free article] [PubMed] [Google Scholar]
- 70.Popelka S, Kabatek Z, Viovy JL, Gas B. Journal of Chromatography A. 1999;838:45–53. [Google Scholar]