Summary
Ursodeoxycholic acid (UDCA) has been shown to prevent colon tumorigenesis in animal models and in humans. In vitro work indicates that this bile acid can suppress cell growth and mitogenic signaling suggesting that UDCA may be an anti-proliferative agent. However, the mechanism by which UDCA functions is unclear. Previously we showed that bile acids may alter cellular signaling by acting at the plasma membrane. Here we utilized EGFR as a model membrane receptor and examined the effects that UDCA has on its functioning. We found that UDCA promoted an interaction between EGFR and caveolin-1 and this interaction enhanced UDCA-mediated suppression of MAP kinase activity and cell growth . Importantly, UDCA treatment led to recruitment of the ubiquitin ligase, c-Cbl, to the membrane, ubiquitination of EGFR, and increased receptor degradation. Moreover, suppression of c-Cbl activity abrogated UDCA's growth suppression activities suggesting that receptor ubiquitination plays an important role in UDCA's biological activities. Taken together these results suggest that UDCA may act to suppress cell growth by inhibiting the mitogenic activity of receptor tyrosine kinases such as EGFR through increased receptor degradation.
Keywords: bile acids, colon cancer, chemoprevention, c-Cbl, endocytosis
Introduction
Bile acids are polar derivatives of cholesterol that are excreted into the digestive tract where they aid in the emulsification and absorption of dietary fats [1] . Although bile acids have a clear role in digestion they have also been implicated by epidemiological studies as modifiers of colon cancer etiology with deoxycholic acid (DCA) being fingered as a key culprit in the promotion of colon tumorigenesis by high fat diets [2-4]. However, recent evidence suggests that another bile acid, ursodeoxycholic acid (UDCA) has chemopreventive properties in both animal models [5-7] and in humans [8] suggesting that these agents have distinctly different effects on the colonic epithelium. Consistent with this we have shown that DCA is cytotoxic and induces apoptosis on cells in culture, whereas UDCA induces senescence and growth suppression[9]. Surprisingly DCA and UDCA have nearly identical chemical structures differing only in the position of one hydroxyl group which can be located on either the C-7 or C-11 positions of the cholesterol nucleus in DCA or UDCA respectively. The mechanism by which these two structurally related bile acids exhibit such opposing biological effects remains unclear.
In previous studies we proposed that bile acids may exert their biological effects by activating intracellular signaling and that this activity is initiated at the cell surface. Early studies of DCA showed that this bile acid activated protein kinase C as well as the MAP kinase signaling pathway [10] and that this activity was induced through the ligand-independent activation of EGFR [10, 11] which led to activation of the AP-1 transcription factor [12]. Importantly, DCA's ability to stimulate intracellular signaling was related to its hydrophobicity and ability to alter the composition of the cell membrane [13, 14] suggesting that this structure was the origin bile acid-induced intracellular signaling. In contrast, UDCA was found to suppress DCA-induced signaling [15, 16] but, surprisingly, was also shown to accumulate in the plasma membrane [17]. These observations supported the idea that both of these bile acids might be exerting their biological effects by altering the plasma membrane.
We previously showed that plasma membrane alterations caused by DCA resulted in the phosphorylation of membrane-associated caveolin-1 [13]. Caveolin-1 is a structural protein found in caveolae lipid rafts in the plasma membrane [18] which serve as signaling platforms for a wide variety of membrane signaling pathways including the EGF receptor which stimulates MAP kinase signaling. Importantly, loss or disruption of caveolae can result in aberrant signaling [19] . Caveolin-1 is a key structural component of caveolae, but it also is thought to regulate receptor activity by binding with receptors and suppressing their activity. Loss of caveolin-1 facilitates development of tumors in mice which suggests that caveolin-1 may be a tumor suppressor [20, 21] .
In these studies we used EGFR as a model system to examine the effects that UDCA and DCA have on receptor tyrosine kinases and tested whether the biological activities of these two bile acids was affected by the presence or absence of caveolin-1. We show that UDCA suppresses EGFR signaling by promoting endocytosis and degradation of the receptor and that this is facilitated by the presence of caveolin-1. The significance of our results with respect to the effects of bile acids on colon tumor etiology are discussed.
Materials and Methods
Bile acids and antibodies
DCA was obtained from Sigma (St. Louis, MO) and UDCA was obtained from Calbiochem (La Jolla, CA). Bile acids were maintained in stock solutions of 100mM, dissolved in double-distilled water. The Caveolin-1, c-CBL, EGFR, and Flotillin-2 antibodies were purchased from Santa Cruz Biotechnology (Santa Cruz, CA). The Anti-MAP Kinase activated (diphosphorylated ERK-1 & 2) antibody was purchased from Sigma (St. Louis, MO). The Ubiquitin and total ERK 1 & 2 antibodies were obtained from Upstate Biotechnology (Lake Placid, NY). The Mannose-6-Phosphate Receptor antibody was purchased from Abcam (Cambridge, MA). The fluorescent probes, Alexa Fluor 594 and 488 were purchased from Molecular Probes (Eugene, OR). Mouse and rabbit secondary antibodies were purchased from Kirkegaard & Perry Laboratories (Gaithersburg, MD).
Cell Lines
The HT-29 cell lines, derived from human colorectal adenocarcinoma, were obtained from the American Tissue Type Culture Collection (Manassas, VA). The stably transfected cell line HT29-cav-1, was generously provided by Dr. Emanuela Felley-Bosco (Institute of Biochemistry, University of Lausanne, Lausanne, Switzerland) and has been described previously [20]. All cell lines were grown at 37°C and in humidified, 5% CO2 incubators. Cells were maintained in Dulbeccos modified Eagle's medium (DMEM) (Gibco BRL, Gaithersburg, MD) supplemented with 10% (v/v) fetal bovine complex (Gemini Bioproducts, Sacramento, CA.), 4 mM sodium pyruvate, 100 units/ml penicillin/streptomycin, and 100 μM non-essential amino acids.
Analysis of Proliferation – Growth Curves
Primary cultures of HT29 and HT29-cav-1 cells were seeded in 60 mm dishes at a density of 50,000 cells/dish. Cell number was counted with the Bright Line Counting Chamber (Hausser Scientific, PA) every 6 hours for 3 days of incubation at 37°C. Each point represents the total number of cells per plate expressed as a percentage of initial cell count. The experiment was performed in triplicate and repeated twice. Error bars depict variation between experiments.
Sucrose Gradient Fractionation of Cellular Membranes
Total cell membranes were fractionated according to the method of Song et al. [22] with some modifications. Briefly, cells were cultivated in 10 cm dishes, washed twice with PBS and scraped into 2 mls of 500 mM sodium carbonate (pH 11.0). The cell suspensions were homogenized on ice with loose-fitting Dounce Homogenizer (10 strokes), and subjected to sonication using an ultrasonicator (three 10 second bursts). The homogenate was adjusted to 45% sucrose by adding an equal volume of 90% sucrose prepared in MBS (25 mM MES, pH 6.5, 150mM NaCl) and placed at the bottom of ultraclear centrifuge tubes (Beckman Instruments, Palo Alto, CA). A 5−35% discontinuous sucrose gradient was layered above using equal volumes of 35% and 5% sucrose over the cell homogenate layer. The gradients were centrifuged to equilibrium by centrifugation at 160,000 × g for 18 hours in a SW41 rotor at 4°C. Twelve 1 ml fractions were collected from top to bottom, stored at 4°C for later analysis.
Immunofluorescence
Cells were seeded on coverslips in 12 well dishes and grown until 60% confluent and then treated accordingly for each experiment. The cells were then fixed for 30 minutes in 4% Paraformaldehyde in PBS at room temperature, washed twice with cold PBS, and permeabilized with 0.2% Triton X-100 for 10 minutes. This was followed with 3 washes with PBS and 2 washes with the blocking reagent, 5% BSA in PBS. Coverslips were then incubated for 1 hour with primary antibodies (dilutions ranged from 1:100 to 1: 500) at 32°C. Subsequently the cells were washed 3 times with PBS and twice with 5% BSA followed by incubation with fluorescence-conjugated secondary antibodies at room temperature for 1 hour. After incubation, cells were washed with cold PBS, incubated with DAPI for 2 minutes, and washed 2 more times with PBS. Finally coverslips were mounted with VECTASHIELD Mounting Medium (Vector Laboratories, Burlingame, CA) and observed using a NIKON microscope and images collected using Metamorph software.
Pulse Chase Analysis
Cells were grown to 70% confluence and treated with bile acids overnight. Cells were washed twice with pre-warmed phosphate buffered saline, and incubated in L-Cysteine and L-Methionine-free DMEM (Invitrogen) supplemented with 5% dialyzed fetal bovine serum for 1 hour. Cells were labeled with 150μCi/ml L-[35S] methionine (PerkinElmer, Waltham, MA) for 2 hours, washed 3 times in pre-warmed phosphate buffered saline, and chased in complete DMEM medium containing 2mM (unlabeled) L-Methionine and L-Cysteine, and 30μg/ml cyclohexamide (Sigma) for 0.5, 1, 1.5, and 3 h. Cells were lysed in radioimmune precipitation buffer (150 mM NaCl, 50mM Tris base, pH 7.2, 1% deoxycholic acid, 1% Triton X-100, 0.1% SDS, 0.5% aprotinin, 12.5μg/ml leupeptin, 1mM sodium vanadate), and immunoprecipitated with anti-EGFR antibody, resolved by 7.5% SDS-PAGE. Gels were fixed, dried and autoradiographed to detect [35S] methionine-labeled protein bands. For quantitation of EGFR bands, densities of the bands were scanned with Molecular Dynamics PhosphorImager and quantified with Image Quant software.
Stable Transfection of Expression Vector and siRNA Transfection
C381A-c-Cbl ring finger mutant in the expression vector pcDNA3 was a generous gift from Dr. Yosef Yarden (Department of Biological Regulation, Weizmann Institute of Science, Rehovot, Israel) and has been described previously [23]. pcDNA3-HA-c-cbl and a pCMV-Tag2 empty vector were simultaneously transformed and subsequently transfected into HT-29-cav-1 cells using LipoTAXI Mammalian transfection kit (Stratagene, La Jolla, CA) according to manufacturer's instruction manual. Stably transfected clones were selected in the presence of 600 μg/ml G418, and individual clones expanded into stable colonies.
Results
UDCA-induced growth suppression is enhanced in the presence of caveolin 1
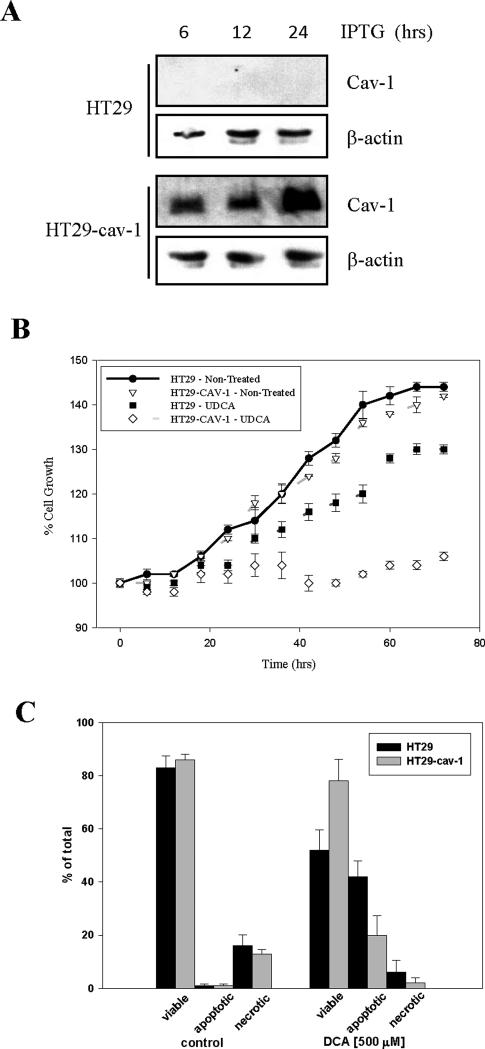
We previously showed that bile acids cause membrane perturbations which led to activation of mitogenic signaling [12, 17]. It has been reported that signal transduction pathways involved in cell proliferation are regulated at least in part through the caveolae membrane domains [24]. Hence, we examined the effect that the absence or presence of cav-1 had on UDCA suppression of cell proliferation. To examine this we utilized HT29 cells which do not express caveolin-1 and HT29-cav-1 cells which are transfected with an inducible vector which drives expression of caveolin-1 in response to IPTG (Figure 1A). In all experiments the cells were incubated with 1mM IPTG for 24 hours prior to initiation of the experiment to induce caveolin-1 in the HT29-cav-1 cells . As expected incubating HT29 cells with UDCA caused a significant suppression of cell growth when compared with the untreated controls (p=0.0001). Importantly, UDCA-induced growth suppression was significantly enhanced in caveolin-1 expressing cells when compared to UDCA-treated HT29 cells (p=0.0001; Figure 1B). Indeed, the presence of caveolin-1 combined with UDCA treatment completely eliminated cell proliferation. No significant difference in growth between HT29 cells and HT29-cav1 cells was observed. In contrast, the cytotoxic effects of DCA was reduced in the presence of caveolin (Figure 1C). DCA induced apoptosis approached 50% in HT29 cells. However under the same conditions DCA-induced apoptosis in HT29-cav1 cells was only ∼20% indicating that the presence of caveolin suppressed the cytotoxic effects of this bile acid. Hence, it appears that caveolin has opposing effects on the activity of these two bile acids. It enhanced the growth suppressing activity of UDCA, but suppressed DCA-induced apoptosis. Importantly, caveolin-1 had no effect on its own on either cell growth or cell death.
Figure 1. Caveolin-1 enhances suppression of growth and MAP kinase signaling by UDCA.
(A) HT29 and HT29-cav-1 cells were plated onto 10 cm plates and grown in the presence of 1 mM IPTG for the number of hours indicated. The cells were then harvested and cell lysates examined by immunoblotting for the caveolin-1 and beta actin. (B) HT29 and HT29-Cav-1 cells were plated onto 60 mm plates and grown in the presence of 1 mM IPTG for 24 hours prior to the addition of 250 μM UDCA. Cells were trypsinized from the plates at regular intervals and counted. Graphs represent the total number of cells/plate expressed as a percentage of the initial cell count. The experiment was performed in triplicate and repeated twice.Error bars represent standard error. (C) HT29 and HT29-cav-1 cells were grown on 60 mm plates and caveolin expression induced as described in panel A. Subsequently, cells were either not further treated or incubated with 500 μM DCA for 16 hours. Cells were then harvested by trypsinization and the fraction of viable, apoptotic, and necrotic cells determined by fluorescent microscopy after staining with acridine orange/ethidium bromide [9]. The bars depict the average from three experiments. Error bars show stander deviation.
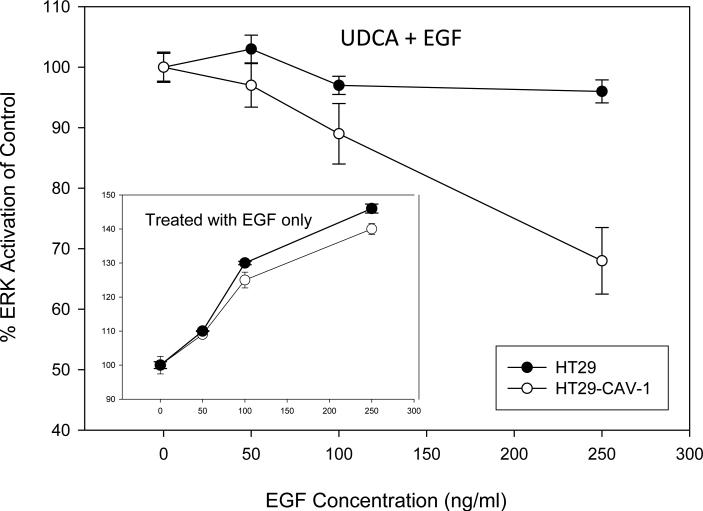
Since we previously showed that UDCA suppressed DCA-induced EGFR signaling [16] we asked whether UDCA could suppress EGF-induced signaling and whether the presence or absence of caveolin had any effect on this. As expected we found that increasing concentrations of EGF resulted in a dose-dependent increase in ERK1/2 activation in HT29 and HT29-cav-1 cells and the magnitude of ERK activation was similar for the two cell lines (Figure 2. inset ). However, when the cells were pre-treated with UDCA, induction of MAP kinase activity by EGF was reduced and this effect was enhanced in the HT29-cav-1 cells (Figure 2.). These results reaffirm the observation that UDCA can suppress MAP kinase signaling and that this effect is enhanced in the presence of caveolin.
Figure 2. Caveolin-1 facilitates suppression of MAP kinase signaling by UDCA.
(inset) HT29 and HT29-Cav-1 cells were plated onto 10 cm dishes and caveolin-1 induced as described in Figure 1. The cells were then incubated for 18 hours in serum free media and subsequently exposed to 0, 50,100, or 200 ng/ml EGF for 15 minutes. Cells were analyzed for the presence of total ERK1/2 and phosphorylated ERK1/2 by immunoblotting and the quantity of phosphorylated ERK1/2 determined using Scion Image. The values graphed depict the extent of ERK phosphorylation in HT29 (solid circles) and HT29-cav-1 (open circles) cells exposed to increasing concentrations of EGF. These experiments served as controls for the following studies. (Large graph) HT29 (solid circles) and HT29-Cav-1 (open circles) cells were grown on 60 mm plates and caveolin-1 expression induced as described above, however, in addition both cell lines were preincubated with 250 μM UDCA for 16 hours. Subsequently, the cells were incubated with the same concentrations of EGF as above and the extent of ERK1/2 phosphorylation determined by immunoblotting. Band densities were quanititated using Scion Image. The values graphed depict the change in activation of ERK by EGF in UDCA pretreated HT29 and HT29-cav1 cells normalized relative to cells not pretreated with UDCA (inset). The experiment was repeated twice. Error bars depict stander deviation.
UDCA induces endocytosis, ubiquitination and degradation of EGFR
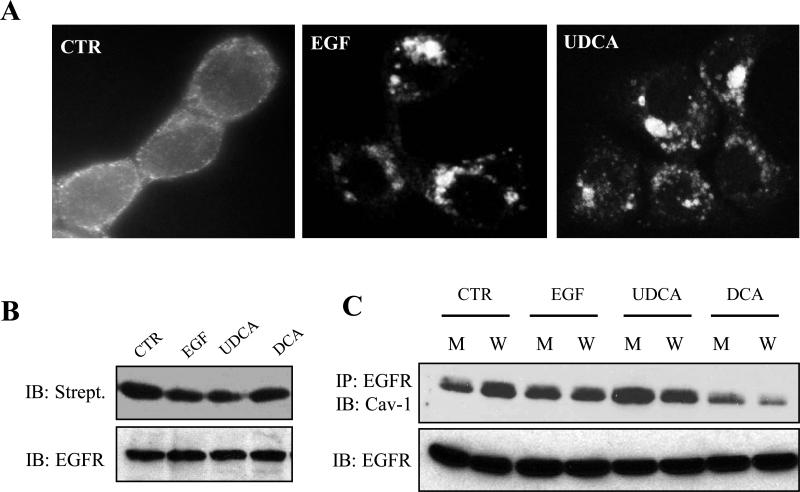
Attenuation of receptor signaling is normally accomplished by receptor internalization followed by ubiquitination and degradation [25]. Since UDCA could suppress receptor signaling we examined the subcellular localization of EGFR in HT29-cav1 cells after treatment with UDCA. We performed immunofluorescent confocal microscopy to visualize the localization of EGFR in the cell after treatment with EGF and UDCA (Figure 3A). In control cells the receptor can be seen concentrated primarily on the cell surface and as expected treatment of the cells with EGF resulted in internalization of EGFR and accumulation of the receptor in preinuclear vesicles. Importantly, UDCA led to a similar accumulation of EGFR in perinuclear vesicles suggesting that UDCA could also induce internalization of the receptor.
Figure 3. UDCA induces internalization of EGFR and association with caveolin-1.
(A) Caveolin-1 was induced in HT29-cav-1 cells as previously described and then serum starved. Subsequently cells were either not further treated (CTR), treated with 100 ng/ml EGF (+EGF) for 15 minutes or incubated with 250 μM UDCA (UDCA) for 60 minutes. The cells were fixed and stained with anti-EGFR as described in Materials and Methods. Confocal images of each treatment group are depicted. The experiment was repeated three times. Typical results are shown. (B) Caveolin-1 expression was induced in HT29-cav-1 cells as previously described and the cells either not further treated (CTR), treated with 100 ng/ml EGF (EGF) for 15 minutes or incubated with 250 μM UDCA (UDCA) or 250 μM DCA (DCA) for 18 hours. Surface proteins were then biotinylated. EGFR was then immunoprecipitated with an anti-EGFR antibody and the recovered proteins separated by SDS-PAGE electrophoresis and probed for the presence of biotin using horseradish-peroxidase-labeled streptavidin. Subsequently the filter was probed for EGFR using an anti-EGFR antibody. The experiment was repeated three times. Typical results are shown. (C) Caveolin-1 was induced in HT29-cav-1 cells as previously described and the cells either not further treated (CTR), incubated with EGF for 15 minutes, or incubated with 250 μM DCA (DCA) or 250 μM UDCA (UDCA) for 18 hours. Whole cells extracts (W) or membrane preparations (M) were prepared and EGFR immunoprecipitated with an anti-EGFR antibody. Protein samples were separated by SDS-PAGE and probed for the presence of caveolin-1 using an anti-caveolin-1 antibody and for EGFR using an anti-EGFR antibody. The experiments were repeated three times. Typical results are shown.
To confirm that EGFR was indeed lost from the cell surface we biotinylated surface proteins and tested for this modification of the EGFR in the treated cells (Figure 3B). As expected EGFR was extensively biotinylated in control cells. However, biotinylation was reduced in both UDCA and EGF-treated cells consistent with internalization of the receptor. We also examined biotin-labeled EGFR on DCA treated cells and found that it had no measurable change in this assay.
Since caveolin-1 can suppress receptor signaling and caveolin-1 enhanced UDCA's ability to suppress mitogenic signaling we sought to determine whether treatment with UDCA led to an association between EGFR and caveolin-1. HT29-cav-1 cells were incubated with DCA and UDCA and EGFR immunoprecipitated from the treated cells (Figure 3C.). Immunoblotting reveals that caveolin-1 readily co-immunoprecipitates with EGFR even in the untreated control cells, but this increases in cells that were incubated with UDCA. Hence, there is a physical interaction between EGFR and caveolin-1 and this is enhanced by UDCA. In contrast, the interaction between EGFR and caveolin-1 is suppressed by DCA. Hence, these two bile acids act in an opposing manner.
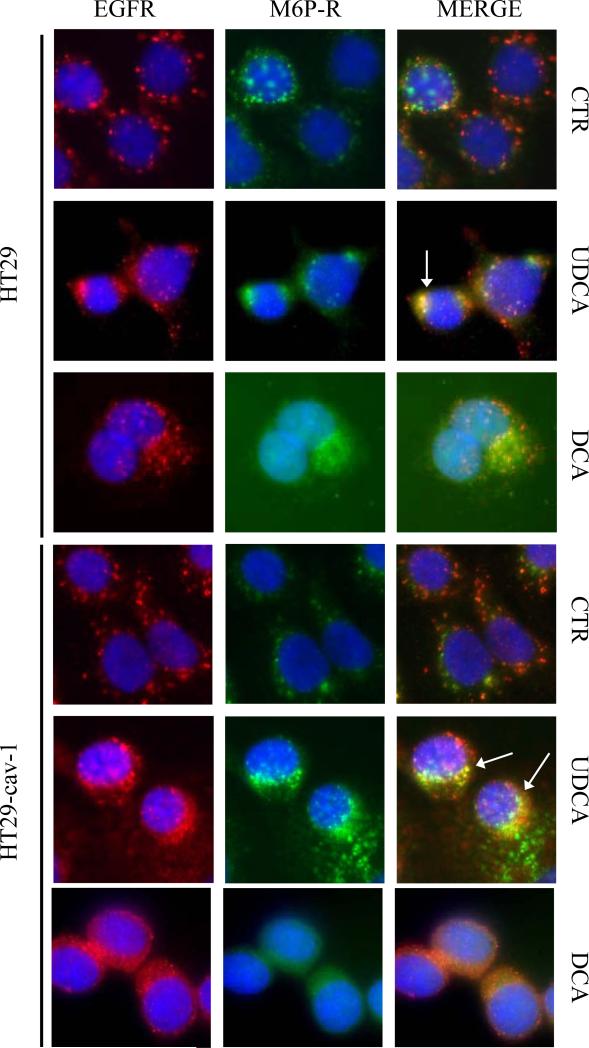
Endocytic vesicles containing activated receptors are sorted and the receptors they contain either degraded or recycled back to the surface [26]. Receptors destined for degradation are ubiquitinated and the vesicles they reside in become associated with proteins that are characteristic of late endosomes. To determine whether UDCA could induce endocytosis of EGFR and examine the nature of the EGFR-containing endocytic vesicles we conducted immunofluorescent microscopy and stained for EGFR and the Mannose-6-Phosphate Receptor (M6P) which is a marker for late endosomes [27]. In control cells the receptor can be seen to reside on the cell's surface and the M6P receptor does not overlap with the EGF receptor in the merged photomicrographs (Figure 4). However, in cells treated with UDCA the EGFR accumulated in perinuclear vesicles as seen in Figure 3A and these also stained for the MP6 receptor. Moreover, there appeared to be a qualitative increase in dual labeled perinuclear vesicles in UDCA-treated HT29-cav1 cells verses HT29 parental cells. Interestingly although we saw internalization of EGFR in DCA-treated cells there was no colocalization of EGFR and MP6 Receptor suggesting that the EGFR-containing vesicles were not late endosomes. Collectively our data suggested that UDCA caused EGFR endocytosis and formation of late endosomes.
Figure 4. UDCA causes internalized EGFR to associate with late endosomes.
HT29 and HT29-cav-1 cells were grown on coverslips and incubated with 1 mM IPTG for 24 hours. The cells were serum-starved and then either left untreated (CTR) or incubated with 250 μM UDCA or 250 μM DCA for 18 hours. The cells were fixed and co-stained for EGF receptor (EGFR, red) and mannose-6-phosphate receptor (M6P-R, green). Merged images are shown on the right (MERGE). White arrows point to endosomes that show colocalization of both M6P and EGFR. The experiment was repeated three times and images depict typical results.
UDCA-induced degradation of EGFR is mediated through c-Cbl
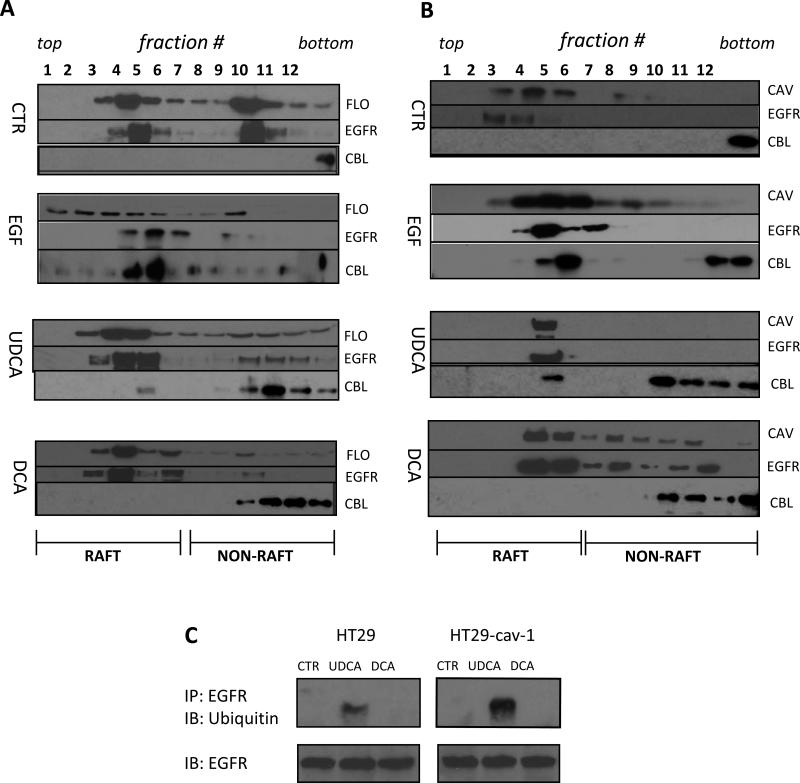
Internalization and degradation of EGFR requires ubiquitination that occurs through the actions of the c-Cbl E3 ligase [23, 28]. Ubiquitination of the receptor marks the protein for degradation and plays an important role in sorting the receptor-containing vesicles into the late endosome pathway that leads to receptor degradation [25]. Consequently, we sought to determine whether c-Cbl activity was stimulated in UDCA treated cells. To explore this we fractionated DCA- and UDCA-treated HT29 and HT29-cav-1 cell lysates on sucrose gradients (Figure 5A and 5B). Fractions from the gradients were probed for a variety of markers including flotillin and caveolin-1 which identify lipid rafts and caveolae. When we probed the fractions for c-Cbl we found that c-Cbl cofractionated with EGFR in the lipid raft fractions in both HT29 and HT29-cav1 cells treated with either EGF or UDCA. Notably c-Cbl was absent from these fractions in control cells and in DCA-treated cells suggesting that UDCA, but not DCA, caused c-Cbl to be recruited to lipid rafts in the plasma membrane. To further investigate the fate of EGFR in UDCA-treated cells we pooled the EGFR-containing fractions from sucrose gradients for control and bile acid-treated cells and immunoprecipitated the receptor. The immunoprecipitated proteins were probed for the presence of ubiquitin by immunoblotting which showed no ubiquitination in the control or in DCA-treated cells (Figure 5C). However, EGFR was extensively ubiquitinated in UDCA-treated cells. Moreover, the extent of ubiquitination was enhanced in HT29-cav-1 cells as compared to parental HT29 cells suggesting that ubiquitination of EGFR was favored in the presence of caveolin-1. Hence, UDCA, but not DCA, caused recruitment of c-Cbl to EGFR which subsequently led to ubiquitination of the receptor.
Figure 5. UDCA treatment induces association of Cbl with EGFR in the raft fraction on sucrose gradients.
HT29 (A) or HT29-cav-1 (B) cells were serum-starved and incubated with IPTG as previously described. The cells were either untreated (CTR) or incubated with 100 ng/ml EGF for 15 minutes (EGF), 250 μM UDCA (UDCA) or 250 μM DCA (DCA) for 18 hours. Treatments are indicated on the left of each panel. Total cell extracts were prepared and the membranes fractionated on sucrose gradients as described in Materials and Methods. Aliquots of the collected fractions were separated on SDS-PAGE gels and probed for the presence of flotillin (FLO), caveolin-1 (CAV), or EGFR (EGFR), or c-Cbl (CBL) using the appropriate antibody. The antibody used is indicated to the right of each row in each panel. The fraction numbers are marked at the top of panels A and B. Fractions from the top of the gradient on the left (top). Fractions from the bottom of the gradient are on the right (bottom). The range of fractions that contain lipid rafts is marked at the bottom of each panel. The experiment was repeated three times. Typical results are shown. (C) EGFR-containing fractions from the gradients in panels A (HT29) and B (HT29-cav-1) that were either untreated (CTR), treated with UDCA (UDCA), or treated with DCA (DCA) were pooled and EGFR immunoprecipitated using an anti-EGFR antibody. The recovered proteins were separated on SDS-PAGE gels and probed with an anti-ubiquitin antibody and anti-EGFR antibody (upper set of gel bands). The total quantity of EGFR in these fractions was also determined by immunoblotting for EGFR (lower set of gel bands). The experiment was repeated twice. Typical results are shown.
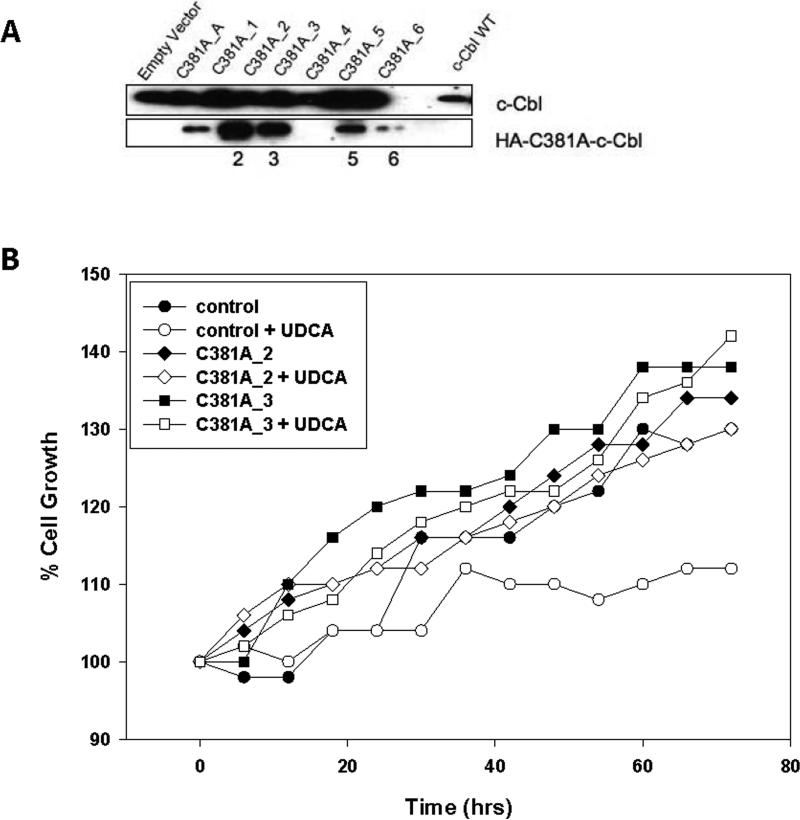
Our experiments implicated c-Cbl as having an important role in the biological effects manifested by UDCA. To test this we inactivated c-Cbl genetically using a dominant negative mutant. HT29-cav-1 cells were stably transfected with the pcDNA3-HA-c-cbl vector and an empty vector. Seven clones were successfully expanded and tested by immunoblotting for the presence of the pcDCA3-HA-c-Cbl which could be distinguished from endogenous c-Cbl by virtue of the HA tag (Figure 6A). Of the clones that were established we chose to further characterize clones C381A_2 and C381A_3 since they expressed the highest levels of the HA-tagged c-Cbl. To determine if loss of c-Cbl function affected UDCA-induced growth suppression, we examined the growth of these cells in the presence of UDCA. As expected, growth of the HT29 control cells was suppressed (Figure 6B). However, we found no significant suppression of growth by UDCA in of any of the cells expressing a dominant negative c-Cbl when compared with untreated control cells. Hence, UDCA's ability to suppress the growth of cells with a nonfunctional c-Cbl was eliminated which suggested that c-Cbl plays an important role in UDCA-induced growth suppression.
Figure 6. Dominant negative c-Cbl inhibits UDCA-induced growth suppression.
(A) The pcDNA3-HA-C381A-c-Cbl which drives expression of a dominant negative HA-tagged c-Cbl was stably introduced into HT29-cav-1 cells. Seven clones were examined for the presence of C381A (0 through 6), by immunoblotting for total c-Cbl (top row) using an anti-Cbl antibody or the dominant negative protein using an anti-HA antibody. (B) HT29 cells (control) and dominant negative expressing C381A-2 (C381A_2) and C381A-3 (CD81A_3) cells were plated onto 60 mm plates and either left untreated or incubated with 250 μM UDCA (+ UDCA). Cells were trypsinized from the plates at regular intervals and counted. The experiment was performed in triplicate. The average values are graphed.
Thus far our data implied that UDCA promoted conditions that should favor degradation of EGFR. To directly test this we examined the half live of the receptor in parental HT29, HT29-cav-1 cells and in the C381A_2 and C381A_3 cell lines using the pulse-chase method. Results are shown in Table I. TheEGFR half-life in untreated HT29 cells was determined to be about six hours and this remained unchanged in the untreated HT29-cav-1 caveolin-1 expressing cells. Treatement with UDCA caused a 30% reduction in the half life of EGFR in parental HT29 cells and a five fold decrease in receptor half life in the HT29-cav-1 cells when compared to the untreated controls. Hence, the EGFR half-life was significantly shortened in cells expressing caveolin-1 and treated with UDCA indicating that under these conditions degradation of the receptor was markedly increased. In contrast, DCA treatment had no effect on the half life of EGFR and when we examined the half life in the C381A_2 and C381A_3 cells, we found that it was similar to the untreated controls. These results confirm the essential role of c-Cbl in promoting receptor degradation by UDCA and suggest that receptor degradation is a key outcome of exposure to UDCA.
Table 1.
Comparison of EGFR half-life (hrs.) in HT29, HT29-Cav1, or HT29-cav1 cells stably transfected with the C381A dominant negative c-Cbl mutant and treated with UDCA or DCA.
| CTR | UDCA | DCA | |
|---|---|---|---|
| HT29 | 6 +/− 1.2 | 4 +/− 0.7 | 7 +/− 0.8 |
| HT29-CAV1 | 5 +/− 0.5 | 1 +/1 0.4 | 8 +/− 1.6 |
| C381A-2 | 5 +/− 0.7 | 4 +/− 0.4 | 6 +/− 0.1 |
| C381A-3 | 6 +/− 1.2 | 6 +/− 1.3 | 5 +/− 0.9 |
Discussion
Our studies suggest that the bile acid, UDCA, which shows chemoprevention activity in clinical trials, acts through a novel mechanism to down regulate mitogenic signaling. UDCA can suppress cell proliferation and our data showed that this effect was potentiated by caveolin-1. Suppression of ERK MAP kinase activity by UDCA was also enhanced by caveolin-1 suggesting that caveolin-1 augmented UDCA's ability to suppress cell proliferation through the inhibition of mitogenic signaling. This is consistent with caveolin-1's role as a suppressor of receptor-mediated MAP kinase signaling [24, 29]. Caveolae, the membrane structures containing caveolin-1, are known to suppress receptor activity when receptors are recruited into these structures [30] and our data demonstrating that there is an enhanced physical interaction between caveolin-1 and EGFR implies that a key effect of UDCA is to promote the down regulation of transmembrane receptor activity. This is supported by our finding that UDCA's growth suppressing capacity is reduced in cells that lack caveolin-1. It should be noted, however, that UDCA does not act exclusively through caveolin-1 since UDCA was still capable of modest growth suppression of cells that lack caveolin-1. Hence, it is possible that UDCA may influence the functioning of other membrane structures such as clathrin coated pits which are also known to play an important role in the processing of receptors such as EGFR [31]. In any case, UDCA's affects at the plasma membrane appear to play an important role in the biological activity exhibited by this bile acid.
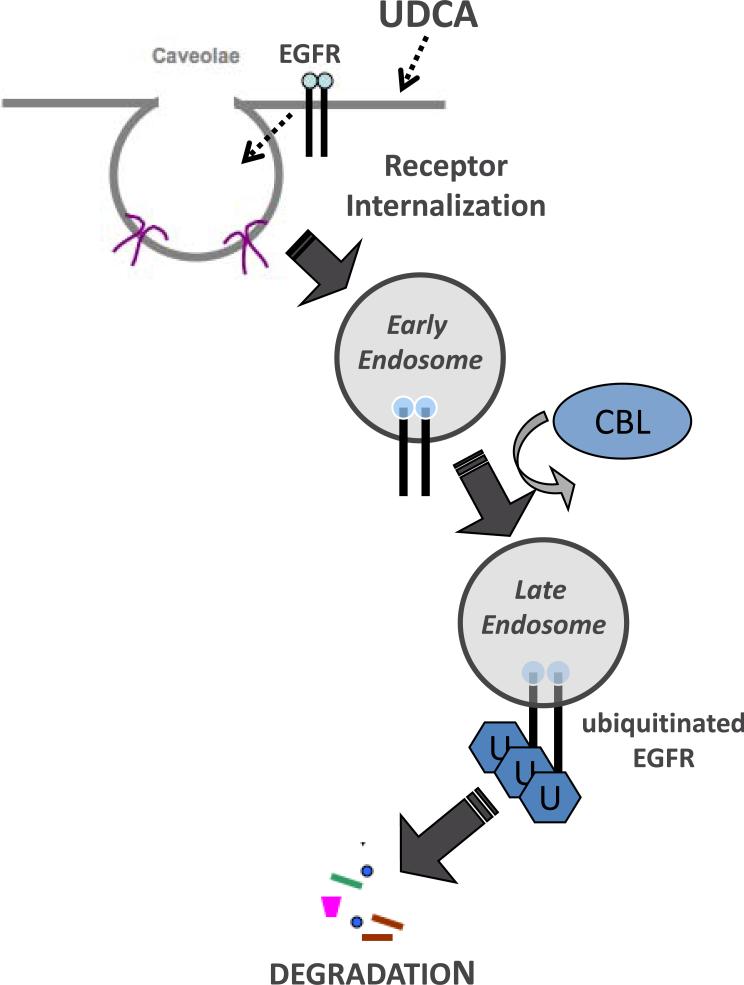
A key event in the down regulation of EGFR and other receptors that collect in caveolae is the internalization of the receptor. Concordantly, we showed that EGFR became internalized and collected in late endosomal vesicles that fuse with lysosomes which results in receptor degradation [31]. Ubiquitination acts as a marker that targets receptors to a degradative pathway [26, 28, 32] and when we examined EGFR we found that it became ubiquitinated in response to UDCA treatment. This was accompanied by a reduced half-life for the receptor indicating that UDCA promoted more rapid receptor turnover. c-Cbl is an E3 ubiquitin ligase that promotes degradation of some receptors by tagging with ubiquitin [33]. Importantly, decreased receptor stability in UDCA-treated cells was accompanied by the appearance of c-Cbl in the same sucrose gradient fractions as EGFR and caveolin-1 suggesting that c-Cbl plays an important role in the degradation of EGFR that is promoted by UDCA. We confirmed the importance of c-Cbl for UDCA's effect on cells by suppressing c-Cbl activity with a dominant negative protein which reduced UDCA-enhanced degradation of EGFR and reduced UDCA's ability to suppress cell proliferation. Hence, UDCA's anti-proliferative effect on cells is a consequence of its ability to augment normal receptor processing [34]. A model showing how UDCA may promote silencing of EGFR is depicted in Figure 7.
Figure 7.
Model of UDCA-induced down regulation of EGFR
In contrast our studies indicate that the effects of DCA on the EGFR are markedly different from that seen with UDCA. Cells treated with DCA showed no ubiquitination of EGFR and no recruitment of c-Cbl to the membrane. Yet, the EGF receptor did appear to be internalized in response to DCA. With regard to this it is notable that the endosomes in DCA-treated cells were not late endosomes (did not stain for the mannose-6 phosphate receptor) suggesting that EGFR-containing endosomes do not favor degradation of the receptor. This is consistent with our observation that the half life of the receptor was not altered in these cells.
So what is the fate of EGFR in DCA-treated cells? One possibility is that the receptor may be recycled back to the surface or may continue to signal from endocytic vesicles. It has been shown that EGFR can follow two routes once internalized, it can either be degraded or it can be recycled back to the surface where it can continue to signal [35]. This possibility is suggested by two seemingly contradictory results, one which shows that there is no change in the surface biotinylation of EGFR in DCA-treated cells (Figure 3B) and the other that EGFR is apparently internalized (Figure 3A). Recycling EGFR back to the cell surface would counteract loss of the receptor from the plasma membrane and so the quantity of the protein at the surface would seem to remain unchanged in the biotinylation experiment. Experiments to directly test this are currently in progress in our laboratory.
It is unclear how DCA could promote a different route for processing of EGFR. One possibility is that DCA activates a different endocytic pathway. Our results are consistent with this in that DCA causes a reduction in the association between EGFR and caveolin-1 and DCA does not promote recruitment of c-Cbl to lipid rafts as does UDCA. Hence, receptor internalization induced by DCA appears not to require caveolin-1 although caveolin-1 does influence activity of this bile acid. We previously showed that downregulation of MAP kinase activity by UDCA can suppress DCA-induced apoptosis [16]. Since caveolin-1 suppresses MAP kinase signaling [24] it seems likely that the reduced DCA-induced apoptosis observed in HT29-cav-1 cells is due to reduced MAP kinase signaling. In spite of these differences in signaling activity it seems apparent that there is considerable overlap between UDCA and DCA in processing of receptors. This is consistent with genetic studies which also suggest that there is overlap in the cellular components that are activated by both bile acids even though the biological outcome that results from exposure to each of these agents is distinctly different [36]. Hence, the functional distinction between a tumor promoting bile acid and a chemopreventing bile acid may ultimately be determined by how receptors are processed once they are internalized.
Interestingly, others have suggested similar mechanism of action for (-)-Epigallocatechin Gallate (EGCG), the biologically active ingredient in green tea. Weinstein and co-workers report that EGCG promotes the down-regulation of EGFR by altering membrane organization leading to inhibition of EGFR activation [37]. In addition, the presence of caveolin-1 down-regulates inducible nitric oxide synthase by reducing iNOS protein levels through accelerated degradation via the proteasome pathway[38]. These observations in conjunction with our findings suggest that augmentation of receptor processing through the manipulation of the plasma membrane to suppress receptor-mediated mitogenic signaling may be a useful in the design of chemopreventive strategies.
Acknowledgements
We would like to thank Dr. Yosef Yarden (Department of Biological Regulation, Weizmann Institute of Science, Rehovot, Israel) for the kind gift of the C381A-c-Cbl pcDNA3 plasmid and Dr. Emanuela Felley-Bosco (Institute of Biochemsitry, University of Lausanne, Lausanne, Switzerland) for the gift of the HT29-cav-1 cells. This work was supported by a grant from the Arizona Biomedical Research Council (#0712), by a grant from the NIH (#CA72008), and by a cancer center support grant to the Arizona Cancer Center (#CA02374).
Footnotes
Publisher's Disclaimer: This is a PDF file of an unedited manuscript that has been accepted for publication. As a service to our customers we are providing this early version of the manuscript. The manuscript will undergo copyediting, typesetting, and review of the resulting proof before it is published in its final citable form. Please note that during the production process errors may be discovered which could affect the content, and all legal disclaimers that apply to the journal pertain.
References
- 1.Vlahcevic ZR, Heuman DM, Hylemon PB. Regulation of bile acid synthesis. Hepatology. 1991;13:590–600. [PubMed] [Google Scholar]
- 2.Armstrong B, Doll R. Environmental factors and cancer incidence and mortality in different countries, with special reference to dietary practices. International Journal of Cancer. 1975;15:617–631. doi: 10.1002/ijc.2910150411. [DOI] [PubMed] [Google Scholar]
- 3.Bayerdorffer E, Mannes GA, Richter WO, Ochsenkuhn T, Wiebecke B, Kopcke W, Paumgartner G. Increased serum deoxycholic acid levels in men with colorectal adenomas. Gastroenterology. 1993;104:145–151. doi: 10.1016/0016-5085(93)90846-5. [DOI] [PubMed] [Google Scholar]
- 4.Reddy BS, Watanabe K, Weisburger JH, Wynder EL. Promoting effect of bile acids in colon carcinogenesis in germ-free and conventional F344 rats. Cancer Research. 1977;37:3238–3242. [PubMed] [Google Scholar]
- 5.Earnest DL, Holubec H, Wali RK, Jolley CS, Bissonette M, Bhattacharyya AK, Roy H, Khare S, Brasitus TA. Chemoprevention of azoxymethane-induced colonic carcinogenesis by supplemental dietary ursodeoxycholic acid. Cancer Research. 1994;54:5071–5074. [PubMed] [Google Scholar]
- 6.Wali RK, Frawley BP, Jr., Hartmann S, Roy HK, Khare S, Scaglione-Sewell BA, Earnest DL, Sitrin MD, Brasitus TA, Bissonnette M. Mechanism of action of chemoprotective ursodeoxycholate in the azoxymethane model of rat colonic carcinogenesis: potential roles of protein kinase C-alpha, -beta II, and -zeta. Cancer Research. 1995;55:5257–5264. [PubMed] [Google Scholar]
- 7.Ikegami T, Matsuzaki Y, Shoda J, Kano M, Hirabayashi N, Tanaka N. The chemopreventive role of ursodeoxycholic acid in azoxymethane-treated rats: suppressive effects on enhanced group II phospholipase A2 expression in colonic tissue. Cancer Letters. 1998;134:129–139. doi: 10.1016/s0304-3835(98)00248-1. [DOI] [PubMed] [Google Scholar]
- 8.Alberts DS, Martinez ME, Hess LM, Einspahr JG, Green SB, Bhattacharyya AK, Guillen J, Krutzsch M, Batta AK, Salen G, Fales L, Koonce K, Parish D, Clouser M, Roe D, Lance P. Phase III trial of ursodeoxycholic acid to prevent colorectal adenoma recurrence. J Natl Cancer Inst. 2005;97:846–853. doi: 10.1093/jnci/dji144. [DOI] [PubMed] [Google Scholar]
- 9.Martinez JD, Stratagoules ED, LaRue JM, Powell AA, Gause PR, Craven MT, Payne CM, Powell MB, Gerner EW, Earnest DL. Different bile acids exhibit distinct biological effects: the tumor promoter deoxycholic acid induces apoptosis and the chemopreventive agent ursodeoxycholic acid inhibits cell proliferation. Nutr Cancer. 1998;31:111–118. doi: 10.1080/01635589809514689. [DOI] [PubMed] [Google Scholar]
- 10.Qiao D, Stratagouleas ED, Martinez JD. Activation and role of mitogen-activated protein kinases in deoxycholic acid-induced apoptosis. Carcinogenesis. 2001;22:35–41. doi: 10.1093/carcin/22.1.35. [DOI] [PubMed] [Google Scholar]
- 11.Cheng K, Raufman JP. Bile acid-induced proliferation of a human colon cancer cell line is mediated by transactivation of epidermal growth factor receptors. Biochem Pharmacol. 2005;70:1035–1047. doi: 10.1016/j.bcp.2005.07.023. [DOI] [PubMed] [Google Scholar]
- 12.Qiao D, Chen W, Stratagoules ED, Martinez JD. Bile acid-induced activation of activator protein-1 requires both extracellular signal-regulated kinase and protein kinase C signaling. J Biol Chem. 2000;275:15090–15098. doi: 10.1074/jbc.M908890199. [DOI] [PubMed] [Google Scholar]
- 13.Akare S, Martinez JD. Bile acid induces hydrophobicity-dependent membrane alterations. Biochim Biophys Acta. 2005;1735:59–67. doi: 10.1016/j.bbalip.2005.04.006. [DOI] [PubMed] [Google Scholar]
- 14.Powell AA, LaRue JM, Batta AK, Martinez JD. Bile acid hydrophobicity is correlated with induction of apoptosis and/or growth arrest in HCT116 cells. Biochem J. 2001;356:481–486. doi: 10.1042/0264-6021:3560481. [DOI] [PMC free article] [PubMed] [Google Scholar]
- 15.Im E, Akare S, Powell A, Martinez JD. Ursodeoxycholic acid can suppress deoxycholic acid-induced apoptosis by stimulating Akt/PKB-dependent survival signaling. Nutr Cancer. 2005;51:110–116. doi: 10.1207/s15327914nc5101_15. [DOI] [PubMed] [Google Scholar]
- 16.Im E, Martinez JD. Ursodeoxycholic acid (UDCA) can inhibit deoxycholic acid (DCA)-induced apoptosis via modulation of EGFR/Raf-1/ERK signaling in human colon cancer cells. J Nutr. 2004;134:483–486. doi: 10.1093/jn/134.2.483. [DOI] [PubMed] [Google Scholar]
- 17.Jean-Louis S, Akare S, Ali MA, Mash EA, Jr., Meuillet E, Martinez JD. Deoxycholic acid induces intracellular signaling through membrane perturbations. J Biol Chem. 2006;281:14948–14960. doi: 10.1074/jbc.M506710200. [DOI] [PubMed] [Google Scholar]
- 18.Lisanti MP, Scherer PE, Vidugiriene J, Tang Z, Hermanowski-Vosatka A, Tu YH, Cook RF, Sargiacomo M. Characterization of caveolin-rich membrane domains isolated from an endothelial-rich source: implications for human disease. J Cell Biol. 1994;126:111–126. doi: 10.1083/jcb.126.1.111. [DOI] [PMC free article] [PubMed] [Google Scholar]
- 19.Liu P, Rudick M, Anderson RG. Multiple functions of caveolin-1. J Biol Chem. 2002;277:41295–41298. doi: 10.1074/jbc.R200020200. [DOI] [PubMed] [Google Scholar]
- 20.Bender FC, Reymond MA, Bron C, Quest AF. Caveolin-1 levels are down-regulated in human colon tumors, and ectopic expression of caveolin-1 in colon carcinoma cell lines reduces cell tumorigenicity. Cancer Res. 2000;60:5870–5878. [PubMed] [Google Scholar]
- 21.Williams TM, Cheung MW, Park DS, Razani B, Cohen AW, Muller WJ, Di Vizio D, Chopra NG, Pestell RG, Lisanti MP. Loss of caveolin-1 gene expression accelerates the development of dysplastic mammary lesions in tumor-prone transgenic mice. Mol Biol Cell. 2003;14:1027–1042. doi: 10.1091/mbc.E02-08-0503. [DOI] [PMC free article] [PubMed] [Google Scholar]
- 22.Song KS, Li S, Okamoto T, Quilliam LA, Sargiacomo M, Lisanti MP. Co-purification and direct interaction of Ras with caveolin, an integral membrane protein of caveolae microdomains. Detergent-free purification of caveolae microdomains. J Biol Chem. 1996;271:9690–9697. doi: 10.1074/jbc.271.16.9690. [DOI] [PubMed] [Google Scholar]
- 23.Waterman H, Levkowitz G, Alroy I, Yarden Y. The RING finger of c-Cbl mediates desensitization of the epidermal growth factor receptor. J Biol Chem. 1999;274:22151–22154. doi: 10.1074/jbc.274.32.22151. [DOI] [PubMed] [Google Scholar]
- 24.Engelman JA, Chu C, Lin A, Jo H, Ikezu T, Okamoto T, Kohtz DS, Lisanti MP. Caveolin-mediated regulation of signaling along the p42/44 MAP kinase cascade in vivo. A role for the caveolin-scaffolding domain. FEBS Lett. 1998;428:205–211. doi: 10.1016/s0014-5793(98)00470-0. [DOI] [PubMed] [Google Scholar]
- 25.Marmor MD, Yarden Y. Role of protein ubiquitylation in regulating endocytosis of receptor tyrosine kinases. Oncogene. 2004;23:2057–2070. doi: 10.1038/sj.onc.1207390. [DOI] [PubMed] [Google Scholar]
- 26.Di Fiore PP, Gill GN. Endocytosis and mitogenic signaling. Curr Opin Cell Biol. 1999;11:483–488. doi: 10.1016/s0955-0674(99)80069-6. [DOI] [PubMed] [Google Scholar]
- 27.Brown WJ, Goodhouse J, Farquhar MG. Mannose-6-phosphate receptors for lysosomal enzymes cycle between the Golgi complex and endosomes. J Cell Biol. 1986;103:1235–1247. doi: 10.1083/jcb.103.4.1235. [DOI] [PMC free article] [PubMed] [Google Scholar]
- 28.Ravid T, Heidinger JM, Gee P, Khan EM, Goldkorn T. c-Cbl-mediated ubiquitinylation is required for epidermal growth factor receptor exit from the early endosomes. J Biol Chem. 2004;279:37153–37162. doi: 10.1074/jbc.M403210200. [DOI] [PubMed] [Google Scholar]
- 29.Couet J, Sargiacomo M, Lisanti MP. Interaction of a receptor tyrosine kinase, EGF-R, with caveolins. Caveolin binding negatively regulates tyrosine and serine/threonine kinase activities. J Biol Chem. 1997;272:30429–30438. doi: 10.1074/jbc.272.48.30429. [DOI] [PubMed] [Google Scholar]
- 30.Galbiati F, Volonte D, Brown AM, Weinstein DE, Ben-Ze'ev A, Pestell RG, Lisanti MP. Caveolin-1 expression inhibits Wnt/beta-catenin/Lef-1 signaling by recruiting beta-catenin to caveolae membrane domains. J Biol Chem. 2000;275:23368–23377. doi: 10.1074/jbc.M002020200. [DOI] [PubMed] [Google Scholar]
- 31.Vieira AV, Lamaze C, Schmid SL. Control of EGF receptor signaling by clathrin-mediated endocytosis. Science. 1996;274:2086–2089. doi: 10.1126/science.274.5295.2086. [DOI] [PubMed] [Google Scholar]
- 32.Di Fiore PP, De Camilli P. Endocytosis and signaling. an inseparable partnership. Cell. 2001;106:1–4. doi: 10.1016/s0092-8674(01)00428-7. [DOI] [PubMed] [Google Scholar]
- 33.Dikic I. Mechanisms controlling EGF receptor endocytosis and degradation. Biochem Soc Trans. 2003;31:1178–1181. doi: 10.1042/bst0311178. [DOI] [PubMed] [Google Scholar]
- 34.Yarden Y, Ullrich A. Growth factor receptor tyrosine kinases. Annu Rev Biochem. 1988;57:443–478. doi: 10.1146/annurev.bi.57.070188.002303. [DOI] [PubMed] [Google Scholar]
- 35.Ceresa BP, Schmid SL. Regulation of signal transduction by endocytosis. Curr Opin Cell Biol. 2000;12:204–210. doi: 10.1016/s0955-0674(99)00077-0. [DOI] [PubMed] [Google Scholar]
- 36.Powell AA, Akare S, Qi W, Herzer P, Jean-Louis S, Feldman RA, Martinez JD. Resistance to ursodeoxycholic acid-induced growth arrest can also result in resistance to deoxycholic acid-induced apoptosis and increased tumorgenicity. BMC Cancer. 2006;6:219. doi: 10.1186/1471-2407-6-219. [DOI] [PMC free article] [PubMed] [Google Scholar]
- 37.Adachi S, Nagao T, Ingolfsson HI, Maxfield FR, Andersen OS, Kopelovich L, Weinstein IB. The inhibitory effect of (-)-epigallocatechin gallate on activation of the epidermal growth factor receptor is associated with altered lipid order in HT29 colon cancer cells. Cancer Res. 2007;67:6493–6501. doi: 10.1158/0008-5472.CAN-07-0411. [DOI] [PubMed] [Google Scholar]
- 38.Felley-Bosco E, Bender FC, Courjault-Gautier F, Bron C, Quest AF. Caveolin-1 down-regulates inducible nitric oxide synthase via the proteasome pathway in human colon carcinoma cells. Proc Natl Acad Sci U S A. 2000;97:14334–14339. doi: 10.1073/pnas.250406797. [DOI] [PMC free article] [PubMed] [Google Scholar]


