

Abstract
The permeation coefficient characterizes the ability of a chemical to penetrate the dermis, and the current study describes our efforts to develop structure-based models for the permeation coefficient. Specifically, we have integrated non-linear, quantitative structure-property relationship (QSPR) models, genetic algorithms (GAs), and neural networks to develop a reliable model. Case studies were conducted to investigate the effects of structural attributes on permeation using a carefully characterized database.
Upon careful evaluation, a permeation coefficient data set consisting of 333 data points for 258 molecules was identified, and these data were added to our extensive thermophysical database. Of these data, permeation values for 160 molecular structures were deemed suitable for our modeling efforts. We employed established descriptors and constructed new descriptors to aid the development of a reliable QSPR model for the permeation coefficient. Overall, our new nonlinear QSPR model had an absolute-average percentage deviation, root-mean-square error, and correlation coefficient of 8.0%, 0.34, and 0.93, respectively. Cause-and-effect analysis of the structural descriptors obtained in this study indicates that that three size/shape and two polarity descriptors accounted for approximately 70% of the permeation information conveyed by the descriptors.
Keywords: QSPR, permeation, enhancer, modeling, neural network
1. Introduction
The largest organ of the body is the skin, which serves as a protective layer against the presiding environment; however, the skin can be breached by chemicals, which may have either a beneficial or deleterious impact on the body. Transdermal drug delivery (TDD) has been used in a beneficial manner to provide a therapeutic avenue for systemic treatment of a variety of maladies.
Compared to the conventional injection and oral delivery mechanisms for drug delivery, TDD is preferable due to its sustained and controlled delivery1 and avoidance of common problems such as painful administration, patient compliance, and liver metabolism. The basic premise of TDD is the penetration of a drug through the stratum corneum (SC) dermal layer and absorption into systemic circulation. In general, the drug has two potential routes of entry: (a) through hair follicles and sweat ducts, and (b) across the SC. Hair follicles and sweat ducts occupy only a small fraction of the total skin surface area and are believed to be insignificant factors in TDD.2 To permeate through the SC, the drug must first partition into the skin and then diffuse through the hydrophilic and/or lipophilic environment of the SC to the dermis, where the molecules would be absorbed into the systemic circulation system. Examples of available TDD applications include scopolamine, nitroglycerin, clonidine, estradiol, fentanyl, nicotine, and testosterone.
Often a drug of interest will exhibit poor permeation, several methods (both physical and chemical) have been developed to improve the permeation of drugs through skin.3 Use of chemical penetration enhancers (CPEs) is an attractive alternative method and merits widespread investigation. Many different types of CPEs have been identified and evaluated;4 however, no CPE has been identified or proven to be truly effective or widely applicable.5 Rational development of CPEs requires detailed analysis of several interrelated factors, including (a) structure and properties of human skin, (b) thermophysical properties of the penetration enhancer, (c) the properties of the drug, and CPE-drug interactions. The thermophysical requirements, coupled with the varied mechanisms for CPE action, make identification of a widely applicable CPE difficult. In addition, most CPEs have complex non-linear concentration-dependent enhancement profiles (which can be further altered by the presence of co-solvents).
The ability to predict accurately the dermal permeation of a chemical is important for the development of new therapeutic formulations in TDD and assessment for potential risk for environmental chemicals. Development of a suitable predictive model has generally centered on the use of structure-property relationships (SPR). Most early modeling efforts utilized linear quantitative structure-property relationship (QSPR) models; however, since most thermophysical properties have non-linear relationships with chemical structure, traditional linear algorithms result often in inferior QSPR models.6,7 New models accounting for all the structural features of importance to skin permeation, which avoid the pitfall of over-reliance on linear models, are required.
In this article, we describe our efforts to model accurately skin permeation using state-of-the-art non-linear algorithms. Specifically, the objectives of this work are to (a) assemble a representative, carefully evaluated permeation coefficient (Kp) database suitable for our modeling requirements (b) demonstrate the ability of non-linear QSPR modeling to predict the skin permeation coefficients of various chemicals, (c) investigate the predictive abilities of structural descriptors identified in previous literature studies, and (d) develop an improved Kp model using a combination of literature descriptors and statistically determined descriptors. These results support our research to identify effective CPEs for TDD.
2. Model Review
Quantitative structure-activity relationship (QSAR) and quantitative structure-property relationship are closely related, and their general methodology is similar. Both modeling techniques rely on the assumption that quantifiable relationships exist between the thermophysical properties, chemical affinity, or biological activity and molecular structure.
QSPR techniques have appeared in the literature for over a century. They have facilitated the prediction of thermophysical properties of a molecule based solely on information from its chemical structure.8–10 Although structure-property relationships do not completely eliminate chemical synthesis or experimental validation, a dramatic reduction in the number of molecules requiring synthesis and validation is realized. The fundamental assumption of QSPR is the three dimensional (3-D) structure of a molecule encodes all the information required to describe its molecular behavior.11
Numerous QSPR models have been proposed in the literature to predict varied, and often complex, thermophysical properties of molecules.12–17 In this effort, the thermophysical property of interest is the permeation coefficient, Kp, which is defined using Fick’s first law for diffusion of a substance through a given material. It is calculated as:
where Km is the partition coefficient, D is the average diffusion coefficient, and h is the skin thickness.
Various models for Kp are presented in Table 1. In brief, QSPR work on skin permeation revealed that hydrophobicity correlated linearly with increasing permeability.18 Flynn19 demonstrated for a set of over 95 organic molecules that skin permeability (expressed as the permeability coefficient, Kp) was a function of partitioning between aqueous and non-aqueous layers, as described by the octanol–water partition coefficient (Kow). Potts and Guy20 used log Kow in combination with molecular weight (Mw) and molecular volume (Mv) to model skin permeability. The hydrogen-bonding characteristic of chemicals has also been shown to influence permeability.20 Several hydrogen bonding descriptors, such as the number of hydrogen bonds,21 the ability of a compound to donate a hydrogen atom (hydrogen donor, Hd),22 and the ability to accept a hydrogen bond (hydrogen acceptor, Ha),23 have been investigated. Descriptors, which define molecular shape, such as weighted-holistic-invariant molecular (WHIM) descriptors,24 and a more recent index describing the linearity of a molecule, have also been used.25 Patel and coworkers26 introduced a dimyristoyl phosphatidylcholine (DMPC)-water partition coefficient accounting for the interactions of CPEs with the ordered, lamellar bi-layer structure of human skin. For skin sensitization models, Kow27,28 is often used with other descriptors accounting for the reactivity, stability, and size of the molecule.29 Many of the early models were linear, but some researchers began investigating the application of nonlinear algorithms, as shown in Table 1. In general, these efforts involved the use of small data sets taken from the available data.
Table 1.
Previous Modeling Work
| Author, Citation | Year | Data | Removed | R2 | Model | Descriptors |
|---|---|---|---|---|---|---|
| Potts and Guy60 | 1992 | 93 | 0.67 | linear | log Kow, MW | |
| Pugh and Hadgraft61 | 1994 | 24 | 0.935 | linear | number of atoms, halide groups, aromacity | |
| Lien and Gao62 | 1995 | 22 | 0.96 | linear | quadratic log Kow, number of H-bonds, MW | |
| Barratt63 | 1995 | 60 | 0.90 | linear | log Kow, molecular volume, melting point | |
| Potts and Guy20 | 1995 | 37 | 0.94 | linear | molecular volume, H-bond donor, H-bond acceptor | |
| Abraham64 | 1994 | 46 | 0.96 | linear | linear free energy relationship | |
| Kirchner et al.44 | 1997 | 114 | 0.86 | linear | log Kow, molar volume | |
| Hostynek and Magee65 | 1997 | 20 | 0.8 | linear | vehicle, molar refractivity, number of H-bond acceptors, number of H-bond donors | |
| Roy et al.66 | 1998 | 60 | 0.64 | linear | log Kow, and others | |
| Abraham et al.67 | 1999 | 53 | 0.96 | linear | dipolarity, H-bond donor acidity, H-bond acceptor basicity, McGowan volume | |
| Gute et al.68 | 1999 | 60 | 0.67 | linear | MW, and others | |
| Cronin et al.21 | 1999 | 107 | 0.86 | linear | total number of lone pairs that will H-bond, log Kow, fourth-order valence-corrected molecular connectivity | |
| Minghetti et al.69 | 2000 | 14 | 0.749 | linear | Kow, solvation energy | |
| Dearden et al.70 | 2000 | 91 | 0.83 | linear | H-bond acceptor free energy factor, positive charge per unit volume, electrotopological atom-type indices, Balaban index, number of rotatable bonds | |
| Pugh et al.71 | 2000 | 40 | many | PCA | log Kow, MW, sum of partial charges, H-bond donor, and H-bond acceptor | |
| Poulin and Krishnan72 | 2001 | 47 | 0.95 | Kp equation-based | Kow, diffusion coeff., path length | |
| Ghafourian and Fooladi73 | 2001 | 39 | one | 0.94 | linear | solvent accessible surface area, sum of atomic charges on H-bonding heteroatoms, number of H-bonding heteroatoms, second-order shape index, sum of atomic charges on the H-bonding H atoms |
| Buchwald and Bodor74 | 2001 | 98 | 0.723 | linear | effective van der Waals molecular volume, H-bonds formed at acceptor sites | |
| Patel et al.75 | 2002 | 186 | steroids, atropine, naproxen, nicotine, diclofenac, estriol, benzaldehyde, and digitoxin | 0.9 | QSAR - linear | log Kow, MW, ABSQon - absolute charges of oxygen and nitrogen, SsssCH - sum of E-state indices for all methyl groups |
| Lim et al.76 | 2002 | 92 | RMS = 0.528 | ANN | dipole moment, polarizability, sum charges of N and O atoms, sum charges of H-bonding to N and O | |
| Fujiwara et al.77 | 2003 | 111 | 0.815 | statistical | MW, Kow | |
| Gonzalez and Helguera78 | 2003 | 38 | 0.92 | linear | TOPS-MODE | |
| Pannier et al.79 | 2003 | 94 | 0.82 | fuzzy | MW, Kow | |
| Pannier et al.79 | 2003 | 37 | 0.97 | fuzzy | log Kow, H-bond donor | |
| Pannier et al.79 | 2003 | 54 | 0.95 | fuzzy | log Kow, H-bond donor | |
| Degim et al.59 | 2003 | 38 | atropine, naproxen, nicotine | 0.997 | ANN | MW, Kow, partial charge |
| Moody and MacPherson80 | 2003 | 65 | many | 0.89 | linear | liquid molar volume, surface tension in water, log Kow |
| Abraham and Martins81 | 2004 | 119 | many | 0.832 | LFER | solute excess molar refractivity, solute dipolarity |
| Riviere and Brooks82 | 2005 | 344 | 0.78 | linear | mixture factor, dipolarity, H-bond donor acidity, H-bond acceptor, basicity, McGowan volume, excess molar refractivity | |
| Karande et al.83 | 2005 | 102 | 0.84 | log Kow, sum of squares of polar, dispersive, H-bonding | ||
| Majumdar et al.84 | 2007 | 62 | many | 0.934 | linear | octanol solubility, water solubility, MW, and combinations of these |
| Neumann et al.85 | 2006 | 110 | 0.945 | ensemble model | MW, calculated Kow, solvation free energy |
3. QSPR Model Development
The development of a QSPR model typically involves several distinct and interrelated steps, as illustrated in Figure 1. The approach adapted in our efforts at identifying improved permeation enhancers is summarized below with particular emphasis placed on the development of a reliable, representative database.
Figure 1.

Steps involved in development of a QSPR model
3.1 Database Development
Since the quality of the predictions of a permeation model depends on the consistency and quality of the experimental data used, an exploration of the elements of variation in the data is warranted. Further, the lack of a standard experimental technique for CPE evaluation, and the plethora of skin substitute membranes used, have complicated model development efforts.30
Generally, permeation measurements are conducted using a diffusion system or static cell system. Since the in vivo method is mimicked by the diffusion system, this presents a distinct advantage; however, the dilution of the absorbed penetrants decreases the measurement sensitivity. The static cell system requires careful monitoring to avoid an over-concentration of penetrant in the receptor fluid, which inhibits further absorption. An investigation by van de Sandt and coworkers31 found that the contribution of the variability introduced by method selection was insignificant for the three chemicals used in their study.
Several studies have examined the inter- and intra-individual differences in permeability. Akomeah et al.32 performed permeation experiments using abdominal skin from 14 individuals with caffeine, methyl paraben, and butyl paraben as penetrants and found inter-subject variability in Kp to be as much as 44%. Another study found no significant difference in intra-individual differences for human breast and abdominal tissue;33 however, this is contradicted in a study by Lee et al.34. Other researchers31,35 have also observed that inter-individual differences are a major source of variability in the permeability measurements, and Heuber et al.36 provided a quantification of the experimental error as 55, 32, and 13% due to inter-subject and intra-subject variations, experimental factors, and human error, respectively. Using a standard penetrant, methyl paraben, and silicone membrane for flux determinations at 18 different laboratories, Chilcott et al.37 reported 35% inter-individual variability with a four-fold difference between the lowest and highest flux values. Similarly, Larsen et al.33 reported a five-fold inter-individual difference in flux measurements. An analysis of the database developed by Johnson et al.38 reveals an absolute average deviation in permeation coefficient values of 278% with a high value of 7600% (10% average and 72% high value for log Kp) for 51 measurements of 16 compounds. A study exploring the use of silicone-type membranes rather than animal skins found that for 30 different compounds and 12 replicate measurements the standard deviation was 10% 39. Likely causes of the inter- and intra-variability are the thickness of the skin and the general variability inherent in different human donors.31 Assessment of the quality of a model relies on knowledge of the experimental variability possible in the data. Generally, the model performance should not greatly exceed the estimate of the experimental variability. Exclusion of the variability of skin related factors will result in a smaller experimental deviation. For this work, a 10% experimental variability estimate, which is conservative in terms of the maximum variability possible, will be employed to evaluate the model.
The permeation data employed in modeling usually centers on the Flynn database19 with the addition of more recent data. During modeling efforts, outliers were discovered, and this instigated rigorous examination of the reliability of data both in the Flynn database and other more recent databases. Degim et al.40 found anomalous results for naproxen, atropine, and nicotine, and new values for these compounds were determined along with values for aspirin, benzoic acid, diclofenac, ibuprofen, and methyl nicotinate. Moss and Cronin41 found many of the originally reported steroid values to be inconsistent with more recent studies, and according to Vecchia and Bunge,42 the values for ethyl benzene, styrene, and toluene should not be used. Frasch and Landsittel43 reported that the database developed by Kirchner et al.44 contained permeability coefficients for 63 compounds, which were not experimental values, but had been calculated using a three-parameter “Potts and Guy” linear equation.
Numerous drug permeation enhancer studies have appeared in the literature, and we have used these literature data for initial model calibrations in addition to the Flynn database.19 A dataset of approximately 500 data points for 350 molecules was identified and these permeation enhancement data were added to our extensive thermophysical property database.10,45 As evident from the above numbers, data on some molecules came from multiple sources. Since the literature studies used different experimental methodologies and materials for data generation, rigorous screening criteria were developed to determine the best subset of the data.
The critical review of Kp data by Vecchia and Bunge42 set forth a logical collection of screening criteria and provided a good starting point for database validation. Specifically, preference was given to data where: (a) the experimental conditions were well documented, (b) the permeation coefficients were measured under comparable circumstances, (c) the structure of the molecule could be generated and optimized using commercial computational chemistry software, (d) the melting point and octanol-water partition coefficient of a molecule could be calculated accurately since these variables are significant in skin permeation, and (e) human or porcine skin was used. After applying these criteria, an Oklahoma State University (OSU-KP) database consisting of approximately 260 data points for 169 molecules was constructed in support of our modeling efforts.
3.2 Structure Generation and Optimization
After development of a suitable database, structures need to be generated for the chemical data. The most common representation method of is a two-dimensional (2-D) sketch; however, using a 2-D representation does not provide a complete description of the molecule and lacks information concerning the description of the shape and surface of the molecule. To have an efficient QSPR model, the representation of a molecule should provide all the necessary structural information. This requires information about the constitutive atoms, along with three dimensional (3-D) coordinates that provide a full spatial depiction of the molecule. A commercial package, ChemDraw46 was used to generate the 2-D structures of the molecules, and the 3-D structures were generated using Chem3DUltra. Since more than one set of 3-D coordinates which satisfy the structural constraints (bond length and bond angle) can be generated for any given molecule, the conformation with the lowest Gibbs free energy must be located. The structures were initially optimized using the Chem3D module available in Chem3DUltra. To locate the lowest energy configuration multiple initializations were used during the structure optimization, and AMPAC47 was then employed to further refine the 3-D geometry of the structures. The output files from AMPAC were used to calculate various molecular descriptors.
3.3 Generation of Structural Descriptors
A major component in the development of QSPR is the generation of molecular structure descriptors, which can describe the entire molecular structure or any structural fragment. A more complete treatment of descriptors can be found elsewhere.10,45 The final optimized structures from AMPAC are provided as inputs to commercial QSPR software to generate over 1500 molecular descriptors. A variety of constitutional, topological, geometrical, thermodynamic, quantum-chemical, electrostatic, functional group, and other descriptors are generated using CODESSA48 and Dragon.49 The number of descriptors calculated for each molecule depends on the structural complexity of the molecule. Descriptors that were not calculated for a given molecule were set to zero in subsequent QSPR model development.
3.4 Descriptor Reduction
Generally in a QSPR study, the number of descriptors generated is more than can be realistically employed in model construction. Not all of the generated descriptors are essential to model development for a specific application; in fact, irrelevant or redundant descriptors diminish the performance of a QSPR model.45 The inclusion of a large number of descriptors in model development also increases the computational complexity. Thus, the large initial set of descriptors is reduced to provide a small set, which retains sufficient information concerning the molecular structure to predict adequately the property of interest. Descriptor reduction (DR) is the process of automating the discovery of potentially useful correlations from large sets of descriptor data. The DR process involves the identification of the most relevant set of descriptors for model development and is the most important step in QSPR model development efforts. The most widely used techniques are the multiple linear regression analysis (MLR), principal-component analysis (PCA),50 partial least-squares (PLS),50 genetic algorithms (GA),51 and artificial neural networks (ANNs).45
Most QSPR models developed have been based on multiple linear regression correlations requiring a priori assumption of the form of the mathematical correlation model. However, linear regression analysis ignores the possibility of non-linear descriptor relationships with the properties. The use of such linear approaches often leads to loss of critical information and results in models with poor predictive abilities. In order to ensure that the nonlinear relationships are accounted for in the QSPR models, non-linear transformations of the descriptors are calculated and an expanded set of descriptors is generated. To avoid using a linear method of DR such as MLR, a non-linear GA analysis is used to find the best set of descriptors from the expanded set. The number of descriptors from the expanded set is reduced through successive GA analyses where the most significant descriptors are retained until an optimal descriptor set is determined for use in the ANN analysis. The final number of descriptors is chosen in a somewhat subjective manner that employs a degree of trial and error. The number of descriptors is inversely proportional to the complexity of the neural network, and generally, a balance between the number of descriptors and the network complexity is sought. The DR methodology can provide insight into the number of significant descriptors. In this work, final descriptors sets consisting of ten descriptors were used. Employment of more descriptors did not result in any significant changes in modeling capabilities.
3.5 QSPR Model Development
With a reduced and optimal descriptor set, a QSPR model is produced either with a statistical or neural network (NN) approach. The statistical approach is usually either a multiple linear regression (MLR) or PLS analysis. The resultant QSPR models can be classified as one of three types depending on the combination of feature selection and model. Type I models are completely linear, Type II models are a hybrid, and Type III models are completely non-linear. Generally, Type III models show the best performance in QSPR modeling.52
Several types of NNs are employed in QSPR models, with feed-forward, back-propagation neural networks being common. A collection of interconnected artificial neurons composes a NN, where the neurons are arranged in a minimum of three layers, an input layer (descriptors), an output layer (physical property) and one or two hidden layers, which has the written form of “input-hidden layer 1-hidden layer 2-output” (i.e., 10-4-3-1). While the number of layers may be increased by the addition of more hidden layers, significant results are not obtained when using more than two hidden layers or four layers total.53 The purpose of the NN is to create an association between the structural descriptors and the property of interest. The level of agreement between the input and output of the property of interest in an NN occurs through the adjustment of weights, which affect individual inputs, and biases, which affect the net input. A feed-forward back-propagation NN model with an improved network architecture, consistency, randomization, allocation of training/validation data, and automated network initialization is used for the non-linear model development. The model searches for all possible combinations of hidden layer units that result in a degree of freedom ratio value greater than two. The input dataset is divided into training, validation and testing sets with 70% of data assigned to training set, 15% to validation set and 15% to prediction set.
To find an association between the structural descriptors and the property of interest, the NN is trained in two stages using a portion of the total data as a training set. The first stage involves learning the general features of the training set, and the second stage involves learning the individual characteristics of the molecules in the training set. Property prediction of new molecular structures is enhanced by the first stage of training, but the second stage leads to over-training, which is memorization of the training set molecules. Over-training may be avoided effectively by the use of a cross-validation (CV) set in addition to the training set. The CV set is an independent partial set of structural descriptors and properties. During training, the property of interest is periodically predicted for the CV set. The network training was halted periodically to evaluate the training progress using the CV dataset. During the training, the root-mean-square error (RMSE) of the CV dataset is used to determine the state of the network training.16 Specifically, the RMSE for the training set is expected to reach a minimum as the number of training cycles54 increases. Once the minimum RMSE error of the CV set has been passed, the network is considered to be overtrained, and further training will lessen the predictive capability of the network. Training is stopped at the minimum RMSE error of the CV set, and the predictive ability of the model is evaluated using the prediction dataset. If the RMSE error for the prediction set is not comparable to those of the training and CV sets, then the network model is discarded55 and training is reinitiated.
By training the network starting from several different initial conditions, the robustness of the network performance can be verified. Multiple randomizations of the data and initializations of the weights are used to obtain the best network, as suggested by Iyer and Rhinehart.56 The inputs and targets are normalized to have zero mean and unity standard deviation, which ensures that exceptionally large-valued descriptors do not bias the network. The Nguyen-Widrow algorithm is used to initialize weights and biases, which are updated using a Levenberg-Marquardt optimization technique. To ensure that the best network architecture is obtained, multiple neural network runs using different objective functions such as mean-absolute error, mean-squared error, sum-squared error, and mean-squared error with regularization performance functions were used. The results obtained using the mean-squared error performance function was found to give the best performance for skin permeation modeling. The transfer functions and the performance function of the network are tailored to find the best possible network. The final network is further evaluated using sum of squared errors, average absolute deviations, weighted average absolute deviations, root mean squared error, and correlation coefficient, when applicable.
The preceding discussion provides a general overview of the application of NNs in QSPR models; however, the specific guidelines that we adhere to in our QSPR modeling efforts include the following:57
Random generation of the training set, cross-validation set, and prediction set (for validation) from the reduced set of descriptors should be made in the proportions of 70%, 15%, and 15%, respectively. In every NN run, we perform twenty data randomizations.
The starting weights and biases of the NN should be assigned in a random fashion. This is termed the initialization, and we advocate a minimum of twenty initializations per every data randomization.
The ratio of the molecules to the number of weights in the model should be greater than two58. We refer to this as the degree of freedom (DF) ratio, which will limit the number of hidden neurons used in the NN and provide a more robust model.
The number of hidden layers in the NN is determined empirically, but should not be greater than two. This is because our experience and the literature recommendations indicate using more that two hidden layers is not advisable in most cases. The determination of the best architecture involves implementing the previous guidelines with both one and two hidden layers. The NN architecture providing the best performance is retained for validation.
The error observed in the cross-validation predictions should vary smoothly over the training period of the NN.
3.6 QSPR Model Validation
The final component in the development of a QSPR model is the validation of the newly-constructed model. Validation of the model is generally accomplished by demonstration of the predictive ability of the model. Using a previously prepared prediction set consisting of structural descriptors and properties taken from the reduced set of descriptors, the property of interest is predicted using the new model. The model should be capable of predictions at a desired level of accuracy, and the prediction error should be comparable to that observed for the training and cross-validation sets. Typically, we use the percent average absolute deviation (%AAD) as a statistical measure for the model performance, which is expressed as:
where xi,calc and xi,ex are the calculated and experimental values of the property of interest, respectively, and N is the total number of values. The use of %AAD reflects the model performance more accurately than the R2 value. Although the use of R2 to assess the “goodness of fit” of a model is widespread, the R2 statistic is most suitable for linear models.
A robust validation scheme (which we had developed and evaluated previously for correlation of eight different thermophysical properties)8–10,45 was used to test the viability of the QSPR models developed in the present work. Two consistency measures, internal and external, were used in our model evaluations. We consider our models to be internally consistent if the model is capable of representing the model training set of data within its experimental uncertainty. External consistency is defined as the ability to predict the property in question a priori.
3.7 Case Studies
The objectives of this work are to (a) assemble a representative, carefully evaluated Kp database suitable for our modeling requirements (b) demonstrate the ability of non-linear QSPR modeling to predict the Kp of various chemicals, (c) investigate the predictive abilities of structural descriptors identified in previous literature studies, and (d) develop an improved Kp model using a combination of literature descriptors and statistically determined descriptors. The following case studies were conducted to achieve these objectives:
Case 1: Evaluate the performance of a QSPR using the OSU-KP database and descriptors collated from previous modeling efforts in the literature.
Case 2: Develop a non-linear QSPR model using all available descriptors from Case 1 and augmented with available functional group and WHIM descriptors.
The descriptors identified from literature in Case 1 used different databases comprised of a different mix of structures of varying levels of structural diversity; as such, retaining those descriptors complements the descriptor set developed using our current database.
4. Results and Discussion
We used descriptors obtained from past modeling efforts in the literature to construct a new descriptor set for Case 1 and to develop a non-linear QSPR model. This set includes such descriptors as molecular weight and octanol-water partition coefficient, and other descriptors as presented in Table 2. These descriptors were identified using different experimental databases than what is developed in this work. Our examination of previous models in Table 1 reveals that previous work often centered on small datasets and datasets containing structurally similar molecules.
Table 2.
Case Study Descriptors and Transformations
| Case | ||
|---|---|---|
| 1 | 2 | |
| Descriptor | Descriptor | T-Index |
| log Kow | log Kow | 6 |
| Polarity parameter (Qmax-Qmin) | Polarity parameter (Qmax-Qmin) | 4 |
| Kier shape index (order 1) | Number of single bonds | 5 |
| linearity | Melting point | 2 |
| count of H-acceptor sites [Zefirov’s PC] | nArCOOR (number of esters – aromatic) | 2 |
| LUMO energy | nCq (number of quaternary C) | 4 |
| Molecular volume | nHDon (number H-donors) | 4 |
| Molecular weight | nRCOOR (number of esters – aliphatic) | 3 |
| count of H-donors sites [Zefirov’s PC] | E1v (WHIM descriptor) | 2 |
| Tot dipole of the molecule | L3s (WHIM descriptor) | 1 |
Using the OSU-KP database and the ten most significant literature descriptors, five NN runs are constructed for this study. The %AAD of each run was noted and assigned a score. The scores for the five runs were averaged, and this result was used to help guide the elimination of outlying values. At times, a data point included in the prediction set may show a high % deviation; however, that same datum would have a lower deviation when included in the training set. In such instances, the large deviation can be due to the lack of similar structures to provide adequate training for accurate predictions. Using an average of five runs provides a safeguard against erroneous elimination due to a specific NN inadequate prediction. Ten values associated with multiple-valued structures and ten single-valued structure values were eliminated using this procedure. The single-valued structures included ketorlac, aceclofenac, ibuprofen, flurbiprofen, chloroform, toluene, 1-(diphenylmethyl)-4-ethylpiperazine, benzenetriol, ethylene glycol (mono) n-propyl ether, and ethylene glycol (mono) methyl ether acetate.
Following the elimination of outliers, the remaining multiple values were averaged for each structure, which resulted in a final database containing 160 structures (the database is provided as Supplementary Materials to this article). The literature descriptor set was extended by our addition of WHIM and functional group descriptors which were further modified by transformations. Since relationships between a descriptor and a physical property are often not linear, a selection of transformations was employed in an attempt to account for any non-linearity. The transformations employed are provided in Table 3. All descriptors used in the case studies are provided in Table 2.
Table 3.
Available Descriptor (D) Transformations
| Transformation | T-Index | |
|---|---|---|
| D | 1 | |
| D2 | 2 | |
|
|
3 | |
| |D|0.33 | 4 | |
| ln(|D| +1) | 5 | |
| 1/(D +100) | 6 |
4.1 Case 1
Our objective here was to evaluate the performance of a QSPR using the OSU-KP database and descriptors collated from previous modeling efforts in the literature. As described earlier, literature descriptors developed from a variety of databases were used to develop a non-linear model based on our OSU-KP database. Table 4 presents the summary results for this case. The resulting model was a two hidden layer network (10-5-3-1) with a %AAD, RMSE, and R2 of 8.8, 0.37, and 0.90, respectively. A comparison between predicted and experimental log Kp values and a deviation plot for the predicted values are shown in Figures 2 and 3, respectively. The correlation coefficient is either greater or compares favorably with previous literature models. In the few exceptions where other literature studies found a better correlation, those models were based on smaller and sometimes less diverse datasets. Overall, the descriptors found in the literature provide a good foundation for future modeling effort.
Table 4.
Case Study Results
| Case | |||
|---|---|---|---|
| 1 | 2 | 2 (Averaged) | |
| NN Architecture | 10-5-3-1 | 10-3-7-1 | |
| Statistics | |||
| SSE | 22 | 19 | 9.3 |
| %AAD | 8.8 | 8.0 | 6.4 |
| RMSE | 0.37 | 0.34 | 0.24 |
| R2 | 0.90 | 0.93 | 0.96 |
| Degrees of Freedom | 2.08 | 2.32 | |
Figure 2.
log Kp results for Case 1
Figure 3.

log Kp Deviations for Case 1
An interesting comparison can be made between this result and the work of Degim et al.59, which develops a three descriptor NN model based on a much smaller database of 38 structures consisting mainly of various alcohols. Their model has an R2 of 0.997, which is considerably better than our result. We attempted to apply their descriptors (molecular weight, octanol/water partition coefficient, and charge) to the OSU-KP database; however, their charge descriptor is calculated by software no longer available. Efforts were made to correlate other available charge-type descriptors to various physical properties, but a suitable substitution for the original charge descriptor was not found. Our next attempt at a direct comparison involved recreating the original Degim et al. (2003) QSPR model. While developing this QSPR, two potential problems became apparent. The first problem concerns the appearance that all of their data exists solely in a training set, and the second problem is their use of a 3-5-4-2-1 network with a DF ratio of 0.7, which is well below the rule-of-thumb value of 2.
Typically, the CV set provides a means of monitoring the training of the NN and avoiding over-training, which can be detrimental to the predictive capability of the model. If the data used in this study are retained only in the training set and the descriptors from Case 2 are used, we are able to match the correlation coefficient (R2 = 0.997) reported by Degim et al. (2003) for our much larger database both at a DF ratio similar to the original work and at a DF ratio of one. At DF ratios above one, the reported correlation coefficient is unattainable with our data and descriptor set. Table 5 presents the results of developing QSPR models using our development methodologies and varying the DF ratio. As shown in the table, the statistical measures of the models are directly proportional to the DF ratio; however, if the %AAD is examined for each of the three data sets, the %AAD for the training set at low DF ratios is an order of magnitude smaller than the %AAD for the other two sets. Ideally, the level of deviation observed in the three sets should be similar, and this does not occur until the model developed at a 1.9 DF ratio, which further emphasizes the importance of a DF ratio of sufficient magnitude to ensure the robustness of the model.
Table 5.
Degree of Freedom Effect on a QSPR Model
| QSPR Model Statistics | ||||||||||
|---|---|---|---|---|---|---|---|---|---|---|
| Data Split | 70% Training, 15% Validation, 15% Prediction | 100% Training | ||||||||
| DF | 0.53 | 1.01 | 1.90 | 2.32 | 2.39 | 3.14 | 4.10 | 5.16 | 0.7 | 1.0 |
| SSE | 12 | 16 | 17 | 19 | 21 | 32 | 30 | 33 | 0.21 | 0.26 |
| %AAD | 5.1 | 6.7 | 7.5 | 8.0 | 9.1 | 10.5 | 12.0 | 12.5 | 0.88 | 1.1 |
| RMSE | 0.28 | 0.31 | 0.43 | 0.34 | 0.36 | 0.44 | 0.43 | 0.45 | 0.036 | 0.041 |
| R2 | 0.93 | 0.93 | 0.93 | 0.93 | 0.92 | 0.91 | 0.86 | 0.84 | 0.997 | 0.997 |
| %AAD | ||||||||||
| Training | 0.2 | 3.2 | 6.0 | 5.7 | 6.7 | 8.5 | 10.6 | 10.4 | 0.997 | 0.997 |
| CV | 17.2 | 14.2 | 12.1 | 13.8 | 13.4 | 15.8 | 14.8 | 13.5 | ||
| Prediction | 15.9 | 15.8 | 10.1 | 12.9 | 15.7 | 14.3 | 15.6 | 21.4 | ||
4.2 Case 2
Here, our objective was to develop a non-linear QSPR model using all available descriptors from Case 1 and augmented with available functional group and WHIM descriptors. The inclusion of additional descriptors for this case required the use of a descriptor reduction strategy to create a final modeling descriptor set. The reduction was accomplished using successive GA runs where the most insignificant descriptors were removed from the descriptor pool. Approximately 25% of the descriptors were removed after each run until a final pool of 15 descriptors was reached. These descriptors were then subjected to a sequential analysis (a linear method, which is described in greater detail below) to determine any “cause and effect” and the ten most significant descriptors. The final descriptor set was then used to develop a nonlinear model.
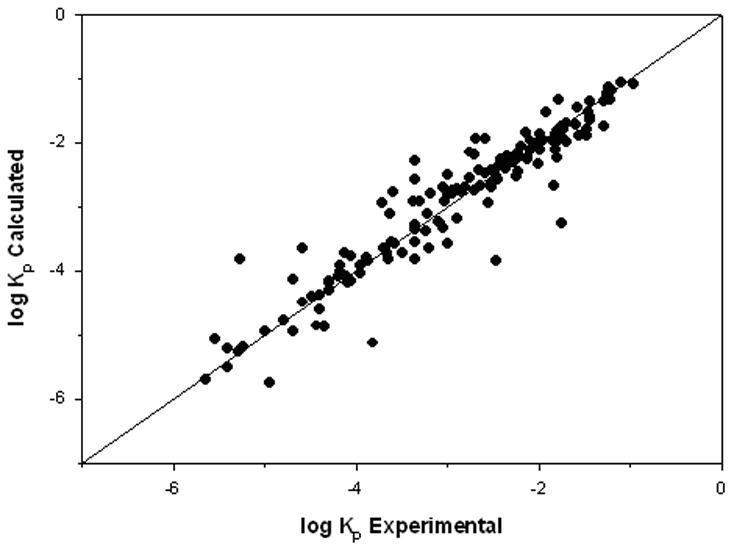
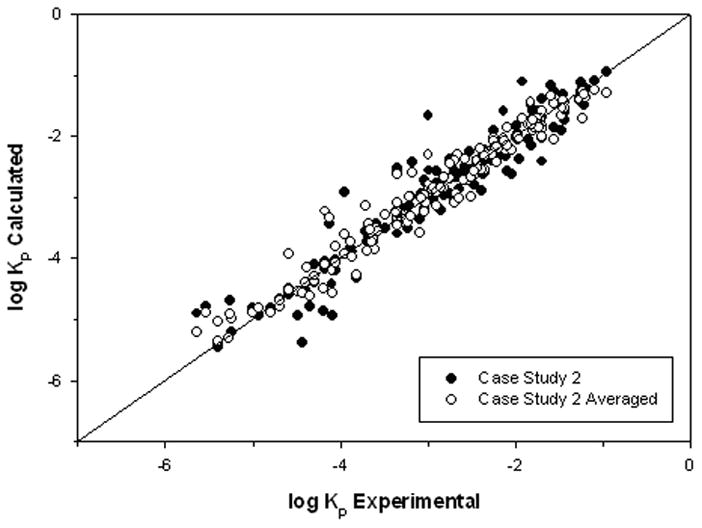
As shown in Table 4, this model (10-3-7-1) is slightly better when compared to the literature-based model presented as Case 1 with a %AAD, RMSE, and R2 of 8.0, 0.34, and 0.93, respectively. Three NN runs were completed with this descriptor set. Completing multiple runs provided us with the opportunity to investigate the structures with poor predictions. Since at this stage, data with larger deviations are not considered outliers, averaged predictions from multiple runs are calculated to reduce the impact of large deviations from a particular run. The results for the three runs result in a %AAD, RMSE, and R2 of 6.4, 0.24, and 0.96, respectively, as shown in Table 5. The model values for the best and averaged runs and the deviations for the best run are presented as Figures 4 and 5, respectively, and comparison of the model values from Case 1 and 2 are shown in Figure 6. While some improvement in R2 was for obtained in Case 2, it is not always the preferable statistical measure. For the current study, the %AAD and RMSE also show improvement from the Case 1 results, as shown in Table 4. As discussed earlier, the variability in permeation measurements can be quite large. The lowest estimate for permeation variability is the 10% deviation calculated by Xia et al.39 for permeation with a synthetic membrane. Exclusion of the variability of skin related factors results in a smaller experimental deviation. This 10% estimate for the experimental variability is conservative in terms of the maximum variability possible. In keeping with good modeling practice, model performance should not greatly exceed this estimate, and our results compare favorably to this experimental variability estimate.
Figure 4.
log Kp Results for Case 2
Figure 5.

log Kp Deviation for Case 2
Figure 6.

log Kp Comparison for Cases 1 and 2
The descriptors used in the models can be examined in terms of a cause and effect, where the “cause” represents the descriptors and the “effect” represents the property value of interest. This is accomplished with a sequential analysis where a linear model is constructed from a pool of descriptors by the retention of the most significant descriptor, and then sequential additions of the next most significant descriptor until the desired number of descriptors in the model is reached. A large number of the significant descriptors reflect the attributes of molecular size/shape (molecular weight and volume, linearity, indexes) or polarity (log Kow, polarity parameter, hydrogen bonding information). The size and shape of the molecule determines the ease with which it may pass between the cells in the SC, and the polarity-type descriptors are involved in describing the solubility of the molecule in the lipophilic environment of the SC. Ultimately, both categories of descriptors are important to describing the partitioning of the molecule through the skin. A sequential analysis of the descriptors from Case 1 and 2 reveals that a five descriptor model results in R2 values of 0.43 and 0.68, respectively. This further reinforces that the Case 2 model, which includes descriptor transformations, improves on the Case 1 model. The higher correlation coefficient found for Case 2 demonstrates a better accounting of the “effect” due to the information provided by the descriptors. The top five ranked descriptors for Case 2 are L3s (WHIM – descriptor size/shape), log Kow (polarity), nArCOOR (number of esters – size/shape), number of single bonds (size/shape), and polarity parameter (polarity) with the transformations given in Table 4. Two of these parameters, log Kow and polarity parameter, were also found in the Case 1 five parameter analysis.
In summary, the models presented herein for skin permeation, as expressed by the permeation coefficient, improves on other literature models in several aspects, including (a) the use of a larger well-screened dataset consisting of diverse chemical structures, (b) selection of a dataset consisting of both literature and additional available descriptors (c) use of multiple QSPR software to provide descriptors assuring both model superiority and stability, (d) use of non-linear transformations to obtain the most suitable set of descriptors, and (e) use of robust non-linear neural networks with multiple randomizations and initializations to ensure network stability.
5. Conclusions
Following are the conclusions drawn based on the work reported herein:
There exist inconsistencies in the permeation data values, which impedes modeling efforts for the permeation coefficient. Characterization of the database resulted in a more refined data set.
The insight provided by the descriptors found in the literature is useful and contributes a useful starting point for QSPR studies.
An accurate non-linear QSPR model has been developed for the permeation coefficient. The variability present in the developed model compares favorably to the level of variability expected in the experimental data.
Cause-and-effect studies revealed a large number of the significant descriptors reflect the attributes of molecular size/shape or polarity. The most significant descriptors in this work are the WHIM descriptor L3s, log Kow, nArCOOR, number of single bonds, and the polarity parameter.
Supplementary Material
Acknowledgments
Financial support for this research was provided by the National Institutes of Health; the National Institute of Biomedical Imaging and Bioengineering (1R21EB005749).
References
- 1.Chong S, Fung HL. Transdermal drug delivery systems: Pharmacokinetics, clinical efficacy, and tolerance development. In: Hadgraft J, Guy RH, editors. Transdermal drug delivery: Developmental issues and research initiatives. 1. New York: Marcel Dekker; 1989. pp. 135–154. [Google Scholar]
- 2.Whalberg JE. Transepidermal or transfollicular absorption? In vivo and in vitro studies in hairy and non-hairy guinea pig skin with sodium and mercuric chlorides. Acta Derm Venereol. 1968;48:336–344. [PubMed] [Google Scholar]
- 3.Barry BW. Novel mechanisms and devices to enable successful transdermal drug delivery. Eur J Pharm Sci. 2001;14:101–114. doi: 10.1016/s0928-0987(01)00167-1. [DOI] [PubMed] [Google Scholar]
- 4.Karande P, Jain A, Mitragotri S. Discovery of transdermal penetration enhancers by high-throughput screening. Nat Biotechnol. 2004;22:192–197. doi: 10.1038/nbt928. [DOI] [PubMed] [Google Scholar]
- 5.Williams AC, Barry BW. Penetration enhancers. Adv Drug Deliv Rev. 2004;56:603–618. doi: 10.1016/j.addr.2003.10.025. [DOI] [PubMed] [Google Scholar]
- 6.Devillers J, Domine D, Guillon C, Bintein S, Karcher W. Prediction of partition coefficients using auto-correlation descriptors. SAR QSAR Environ Res. 1997;7:151–172. [Google Scholar]
- 7.Devillers J, Flatin J. A general QSAR model for predicting the acute toxicity of pesticides to oncorhynchus mykiss. SAR QSAR Environ Res. 2000;11:25–43. doi: 10.1080/10629360008033227. [DOI] [PubMed] [Google Scholar]
- 8.Godavarthy SS, Robinson RL, Jr, Gasem KAM. An improved structure-property model for predicting melting-point temperatures. Ind Eng Chem Res. 2006;45(14):5117–5126. [Google Scholar]
- 9.Godavarthy SS, Robinson RL, Jr, Gasem KAM. SVCR-QSPR model for predicting saturated vapor pressures of pure fluids. Fluid Phase Equilib. 2006;246(1–2):39–51. [Google Scholar]
- 10.Neely BJ. School of Chemical Engineering. Stillwater, OK: Oklahoma State University; 2007. Aqueous hydrocarbon systems: Experimental measurements and quantitative structure-property relationship modeling. [Google Scholar]
- 11.Balaban AT. From chemical topology to 3D geometry. J Chem Inf Comput Sci. 1997;37:645–650. [Google Scholar]
- 12.Hansch C, Fujita T. R-s-p analysis. A method for the correlation of biological activity and chemical structure. J Am Chem Soc. 1964;86:1616–1626. [Google Scholar]
- 13.Katritzky AR, Lobanov VS, Karelson M. Normal boiling points for organic compounds: Correlation and prediction by a quantitative structure-property relationship. J Chem Inf Comput Sci. 1998;38:28–41. [Google Scholar]
- 14.Katritzky AR, Mu L, Karelson M. QSPR treatment of the unified nonspecific solvent polarity scale. J Chem Inf Comput Sci. 1997;37:756–761. [Google Scholar]
- 15.Stanton DT, Egolf LM, Jurs PC, Hicks MG. Computer-assisted prediction of normal boiling points of pyrans and pyrroles. J Chem Inf Comput Sci. 1992;32:306–316. [Google Scholar]
- 16.Wessel MD, Jurs PC. Prediction of normal boiling points for a diverse set of industrially important organic compounds from molecular structure. J Chem Inf Comput Sci. 1995;35:841–850. [Google Scholar]
- 17.Karelson M. Molecular descriptors in QSAR/QSPR. 1. New York: John Wiley & Sons.; 2000. [Google Scholar]
- 18.Roberts MS, Anderson RA, Swarbrick J. Permeability of human epidermis to phenolic compounds. J Pharm Pharmacol. 1997;29:677–683. doi: 10.1111/j.2042-7158.1977.tb11434.x. [DOI] [PubMed] [Google Scholar]
- 19.Flynn GL, editor. Physicochemical determinants of skin absorption. 1. New York: Elsevier; 1990. pp. 93–127. [Google Scholar]
- 20.Potts RO, Guy RH. A predictive algorithm for skin permeability: The effects of molecular size and hydrogen bond activity. Pharm Res. 1995;12:1628–1633. doi: 10.1023/a:1016236932339. [DOI] [PubMed] [Google Scholar]
- 21.Cronin MTD, Dearden JC, Moss GP, Murray-Dickson G. Investigation of the mechanism of flux across human skin in vitro by quantitative structure-activity relationships. Eur J Pharm Sci. 1999;7:325–330. doi: 10.1016/s0928-0987(98)00041-4. [DOI] [PubMed] [Google Scholar]
- 22.Lien EJ, Gao H. QSAR analysis of skin permeability of various drugs in man as compared to in vivo and in vitro studies in rodents. Pharm Res. 1995;4:583–587. doi: 10.1023/a:1016266316100. [DOI] [PubMed] [Google Scholar]
- 23.Pugh WJ, Degim IT, Hadgraft J. Epidermal permeability-penetrant structure relationships. 4. QSAR of permeate diffusion across human stratum corneum in terms of molecular weight, h-bonding and electronic charge. Int J Pharm. 2000;197:203–211. doi: 10.1016/s0378-5173(00)00326-4. [DOI] [PubMed] [Google Scholar]
- 24.Todeschini R, Gramatica P. 3D-modeling and prediction by WHIM descriptors. 5. Theory development and chemical meaning of WHIM descriptors. Quant Struct-Act Relat. 1997;16:113–119. [Google Scholar]
- 25.Patel H, Cronin MTD. A novel index for the prediction of molecular shape. J Chem Inf Comput Sci. 2001;41:1228–1236. doi: 10.1021/ci0103673. [DOI] [PubMed] [Google Scholar]
- 26.Patel H, Schultz TW, Cronin MTD. Physico-chemical interpretation and prediction of the dimyristoyl phosphatidyl choline-water partition coefficient. Journal of Molecular Structure: THEOCHEM. 2002;593(1):9–18. [Google Scholar]
- 27.Basketter DA, Roberts DW, Cronin M, Scholes EW. The value of the local lymph node assay in quantitative structure activity investigations. Contact Dermatitis. 1992;27:137–142. doi: 10.1111/j.1600-0536.1992.tb05241.x. [DOI] [PubMed] [Google Scholar]
- 28.Roberts DW, Basketter DA. A quantitative structure activity/dose response relationship for contact allergic potential of alkyl group transfer agents. Contact Dermatitis. 1990;23(5):331–335. doi: 10.1111/j.1600-0536.1990.tb05167.x. [DOI] [PubMed] [Google Scholar]
- 29.Cronin MTD, Basketter DA. Multivariate QSAR analysis of a skin sensitization database. SAR QSAR Environ Res. 1994;2:159–179. doi: 10.1080/10629369408029901. [DOI] [PubMed] [Google Scholar]
- 30.Kandimalla K, Kanikkannan N, Andega S, Singh M. Effect of fatty acids on the permeation of melatonin across rat and pig skin in-vitro and on the transepidermal water loss in rats in vivo. J Pharm Pharmacol. 1999;51(7):783–790. doi: 10.1211/0022357991773140. [DOI] [PubMed] [Google Scholar]
- 31.van de Sandt JJ, van Burgsteden JA, Cage S, Carmichael PL, Dick I, Kenyon S, Korinth G, Larese F, Limasset JC, Maas WJ. In vitro predictions of skin absorption of caffeine, testosterone, and benzoic acid: A multi-centre comparison study. Regul Toxicol Pharmacol. 2004;39(3):271–281. doi: 10.1016/j.yrtph.2004.02.004. [DOI] [PubMed] [Google Scholar]
- 32.Akomeah FK, Martin GP, Brown MB. Variability in human skin permeability in vitro: Comparing penetrants with different physicochemical properties. J Pharm Sci. 2006 doi: 10.1002/jps.20773. [DOI] [PubMed] [Google Scholar]
- 33.Larsen RH, Nielsen F, Sorensen JA, Nielsen JB. Dermal penetration of fentanyl: Inter-and intraindividual variations. Pharmacol Toxicol. 2003;93(5):244–248. doi: 10.1046/j.1600-0773.2003.pto930508.x. [DOI] [PubMed] [Google Scholar]
- 34.Lee FW, Earl L, Williams FM. Interindividual variability in the percutaneous penetration of testosterone through human skin in vitro. Toxicology. 2001;168:63. [Google Scholar]
- 35.Wilkinson SC, Maas WJM, Nielsen JB, Greaves LC, van de Sandt JJM, Williams FM. Interactions of skin thickness and physicochemical properties of test compounds in percutaneous penetration studies. Int Arch Occup Environ Health. 2006;79(5):405–413. doi: 10.1007/s00420-005-0056-5. [DOI] [PubMed] [Google Scholar]
- 36.Heuber F, Ouvrard-Baraton F, Biesse JP, Courtellemont P, Vincent CM, Marty JP. Pig ear skin as a model for in vitro percutaneous absorption studies: Preliminary results of an inter-laboratory validation. In: Brain KR, Walters KA, editors. Perspectives in percutaneous penetration. 6a. Cardiff: STS Publishing Ltd; 1998. [Google Scholar]
- 37.Chilcott RP, Barai N, Beezer AE, Brain SI, Brown MB, Bunge AL, Burgess SE, Cross S, Dalton CH, Dias M. Inter- and intralaboratory variation of in vitro diffusion cell measurements: An international multicenter study using quasi-standardized methods and materials. J Pharm Sci. 2005;94(3):632–638. doi: 10.1002/jps.20229. [DOI] [PubMed] [Google Scholar]
- 38.Johnson ME, Blankschtein D, Langer R. Evaluation of solute permeation through the stratum corneum: Lateral bilayer diffusion as the primary transport mechanism. J Pharm Sci. 1997;86(10):1162–1172. doi: 10.1021/js960198e. [DOI] [PubMed] [Google Scholar]
- 39.Xia X-R, Baynes RE, Monteiro-Riviere NA, Leidy RB, Shea D, Riviere JE. A novel in-vitro technique for studying percutaneous permeation with a membrane-coated fiber and gas chromatography/mass spectrometry: Part I. Performances of the technique and determination of the permeation rates and partition coefficients of chemical mixtures. Pharm Res. 2003;20(2):275–282. doi: 10.1023/a:1022287524024. [DOI] [PubMed] [Google Scholar]
- 40.Degim IT, Pugh WJ, Hadgraft J. Skin permeability data: Anomalous results. Int J Pharm. 1998;170(1):129–133. [Google Scholar]
- 41.Moss GP, Cronin MTD. Quantitative structure-permeability relationships for percutaneous absorption: Re-analysis of steroid data. Int J Pharm. 2002;238(1–2):105–109. doi: 10.1016/s0378-5173(02)00057-1. [DOI] [PubMed] [Google Scholar]
- 42.Vecchia BE, Bunge AL. Transdermal drug delivery. 2. New York: Marcel Dekker; 2003. pp. 25–55. [Google Scholar]
- 43.Frasch HF, Landsittel DP. Regarding the sources of data analyzed with quantitative structure-skin permeability relationship methods (commentary on ‘investigation of the mechanism of flux across human skin in vitro by quantitative structure-permeability relationships’) Eur J Pharm Sci. 2002;15(5):399–403. doi: 10.1016/s0928-0987(02)00053-2. [DOI] [PubMed] [Google Scholar]
- 44.Kirchner LA, Moody RP, Doyle E, Bose R, Jeffrey J, Chu I. The prediction of skin permeability by using physicochemical data. Altern Lab Anim: ATLA. 1997;25:359–370. [Google Scholar]
- 45.Godavarthy SS. School of Chemical Engineering. Stillwater, Oklahoma: Oklahoma State University; 2004. Design of improved solvents for extractive distillation. [Google Scholar]
- 46.Chemdraw 11.0. Cambridge, MA: Cambridge Software; 2008. [Google Scholar]
- 47.Ampac, 6.0. Shawnee, KS: Semichem Inc; 1998. [Google Scholar]
- 48.Codessa, 2.7.8. Shawnee, KS: Semichem Inc; 1998. [Google Scholar]
- 49.Dragon, 5.4. Milano, Italy: Milano Chemometrics; 2006. [Google Scholar]
- 50.Malinowski ER, Howery DG. Factor analysis in chemistry. 1. New York: Wiley-Interscience; 1980. [Google Scholar]
- 51.Zupan J, Gasteiger J. Neural networks for chemists. 1. Weinheim: VCH Publishers; 1993. [Google Scholar]
- 52.Lucic B, Trinajstic N. Multivariate regression outperforms several robust architectures of neural networks in QSAR modeling. J Chem Inf Comput Sci. 1999;39:121–132. doi: 10.1021/ci990061k. [DOI] [PubMed] [Google Scholar]
- 53.Hagan MT. Lecture comments in neural networks. Oklahoma State University; 2007. [Google Scholar]
- 54.Goldberg DE. Genetic algorithms in search, optimisation and machine learning. 1. Reading, MA: Addison-Wesley; 1988. [Google Scholar]
- 55.Baker JE. Proceedings of the Second International Conference on Genetic Algorithms and Their Application. Massachusetts Institute of Technology; Cambridge, MA: 1987. [Google Scholar]
- 56.Rhinehart RR, Mahesh S, Iyer MS. A method to determine the required number of neural-network training repetitions. IEEE Transactions on Neural Networks. 1999;10:427–432. doi: 10.1109/72.750573. [DOI] [PubMed] [Google Scholar]
- 57.Katritzky AR, Lobanov VS, Karelson M. Codessa user’s manual. University of Florida; Gainsville: 1994. [Google Scholar]
- 58.Ulmer CW, Smith DA, Sumpter BG, Noid DI. Computational neural networks and the rational design of polymeric materials: The next generation polycarbonates. Comput Theor Polym. 1998;8:311–321. [Google Scholar]
- 59.Degim T, Hadgraft J, Ilbasmis S, Ozkan Y. Prediction of skin penetration using artificial neural network (ANN) modeling. J Pharm Sci. 2003;92(3):656–664. doi: 10.1002/jps.10312. [DOI] [PubMed] [Google Scholar]
- 60.Potts RO, Guy RH. Predicting skin permeability. Pharm Res. 1992;9(5):663–669. doi: 10.1023/a:1015810312465. [DOI] [PubMed] [Google Scholar]
- 61.Pugh WJ, Hadgraft J. Ab initio prediction of human skin permeability coefficients. Int J Pharm. 1994;103(2):163–178. [Google Scholar]
- 62.Lien EJ, Gao H. QSAR analysis of skin permeability of various drugs in man as compared to in vitro and in vitro studies in rodents. Pharm Res. 1995;12(4):583–587. doi: 10.1023/a:1016266316100. [DOI] [PubMed] [Google Scholar]
- 63.Barratt MD. Quantitative structure-activity relationships for skin permeability. Toxicol In Vitro. 1995;9(1):27–37. doi: 10.1016/0887-2333(94)00190-6. [DOI] [PubMed] [Google Scholar]
- 64.Abraham MH. New solute descriptors for linear free energy relationships and quantitative structure-activity relationships. In: Politzer P, Murray JS, editors. Quantitative Treatments of Solute/Solvent Interactions. 1. Amsterdam: Elsevier; 1994. pp. 83–133. [Google Scholar]
- 65.Hostynek JJ, Magee PS. Modeling in vivo human skin absorption. Quant Struct-Act Relat. 1997;16(6):473–479. [Google Scholar]
- 66.Roy TA, Krueger AJ, Mackerer CR, Neil W, Arroyo AM, Yang JJ. SAR models for estimating the percutaneous absorption of polynuclear aromatic hydrocarbons. SAR QSAR Environ Res. 1998;9(3–4):171–185. doi: 10.1080/10629369808039155. [DOI] [PubMed] [Google Scholar]
- 67.Abraham MH, Chadha HS, Martins F, Mitchell RC, Bradbury MW, Gratton JA. Hydrogen bonding part 46: A review of the correlation and prediction of transport properties by an LFER method: Physicochemical properties, brain penetration and skin permeability. Pesticide Science. 1999;55(1):78–88. [Google Scholar]
- 68.Gute BD, Grunwald GD, Basak SC. Prediction of the dermal penetration of polycyclic aromatic hydrocarbons (PAHS): A hierarchical QSAR approach. SAR QSAR Environ Res. 1999;10(1):1–15. doi: 10.1080/10629369908039162. [DOI] [PubMed] [Google Scholar]
- 69.Minghetti P, Casiraghi A, Cilurzo F, Montanari L, Monzani MV, Bertolini G, Zaliani A. Solvation enthalpies as descriptors of structure - in vitro percutaneous permeation relationship of benzoxazinones regioisomers. Farmaco. 2000;55(8):563–568. doi: 10.1016/s0014-827x(00)00048-3. [DOI] [PubMed] [Google Scholar]
- 70.Dearden JC, Cronin MTD, Patel H, Raevsky OA. The prediction of skin permeability by using physicochemical data. J Pharm Pharmacol. 2000;52(Suppl):221. [Google Scholar]
- 71.Pugh WJ, Degim IT, Hadgraft J. Epidermal permeability-penetrant structure relationships: 4, QSAR of permeant diffusion across human stratum corneum in terms of molecular weight, h-bonding and electronic charge. Int J Pharm. 2000;197(1–2):203–211. doi: 10.1016/s0378-5173(00)00326-4. [DOI] [PubMed] [Google Scholar]
- 72.Poulin P, Krishnan K. Molecular structure-based prediction of human abdominal skin permeability coefficients for several organic compounds. J Toxicol Environ Health Part A. 2001;62(3):143–159. doi: 10.1080/009841001458271. [DOI] [PubMed] [Google Scholar]
- 73.Ghafourian T, Fooladi S. The effect of structural QSAR parameters on skin penetration. Int J Pharm. 2001;217(1–2):1–11. doi: 10.1016/s0378-5173(00)00687-6. [DOI] [PubMed] [Google Scholar]
- 74.Buchwald P, Bodor N. A simple, predictive, structure-based skin permeability model. J Pharm Pharmacol. 2001;53(8):1087–1098. doi: 10.1211/0022357011776478. [DOI] [PubMed] [Google Scholar]
- 75.Patel H, ten Berge W, Cronin MTD. Quantitative structure-activity relationships (QSARs) for the prediction of skin permeation of exogenous chemicals. Chemosphere. 2002;48(6):603–613. doi: 10.1016/s0045-6535(02)00114-5. [DOI] [PubMed] [Google Scholar]
- 76.Lim CW, Fujiwara S-i, Yamashita F, Hashida M. Prediction of human skin permeability using a combination of molecular orbital calculations and artificial neural network. Biol Pharm Bull. 2002;25(3):361–366. doi: 10.1248/bpb.25.361. [DOI] [PubMed] [Google Scholar]
- 77.Fujiwara SI, Yamashita F, Hashida M. QSAR analysis of interstudy variable skin permeability based on the “latent membrane permeability” concept. J Pharm Sci. 2003;92(10):1939–1946. doi: 10.1002/jps.10462. [DOI] [PubMed] [Google Scholar]
- 78.González MP, Helguera AM. Tops-mode versus dragon descriptors to predict permeability coefficients through low-density polyethylene. J Comput Aided Mol Des. 2003;17(10):665–672. doi: 10.1023/b:jcam.0000017373.50020.41. [DOI] [PubMed] [Google Scholar]
- 79.Pannier AK, Brand RM, Jones DD. Fuzzy modeling of skin permeability coefficients. Pharm Res. 2003;20(2):143–148. doi: 10.1023/a:1022273115847. [DOI] [PubMed] [Google Scholar]
- 80.Moody RP, MacPherson H. Determination of dermal absorption QSAR/QSPRs by brute force regression: Multiparameter model development with Molsuite 2000. J Toxicol Environ Health Part A. 2003;66(20):1927–1942. doi: 10.1080/713853951. [DOI] [PubMed] [Google Scholar]
- 81.Abraham MH, Martins F. Human skin permeation and partition: General linear free-energy relationship analyses. J Pharm Sci. 2004;93(6):1508–1523. doi: 10.1002/jps.20070. [DOI] [PubMed] [Google Scholar]
- 82.Riviere JE, Brooks JD. Predicting skin permeability from complex chemical mixtures. Toxicol Appl Pharmacol. 2005;208(2):99–110. doi: 10.1016/j.taap.2005.02.016. [DOI] [PubMed] [Google Scholar]
- 83.Karande P, Jain A, Ergun K, Kispersky V, Mitragotri S. Design principles of chemical penetration enhancers for transdermal drug delivery. Proc Natl Acad Sci U S A. 2005;102(13):4688–4693. doi: 10.1073/pnas.0501176102. [DOI] [PMC free article] [PubMed] [Google Scholar]
- 84.Majumdar S, Thomas J, Wasdo S, Sloan KB. The effect of water solubility of solutes on their flux through human skin in vitro. Int J Pharm. 2007;329:25–36. doi: 10.1016/j.ijpharm.2006.08.015. [DOI] [PubMed] [Google Scholar]
- 85.Neumann D, Kohlbacher O, Merkwirth C, Lengauer T. A fully computational model for predicting percutaneous drug absorption. J Chem Inf Model. 2006;46(1):424–429. doi: 10.1021/ci050332t. [DOI] [PubMed] [Google Scholar]
Associated Data
This section collects any data citations, data availability statements, or supplementary materials included in this article.