

Abstract
We applied oblique-incidence reflectivity difference (OI-RD) microscopes (a form of polarization-modulated nulling ellipsometry) to detection of biomolecular microarrays without external labeling in a study of protein reactions with surface-immobilized targets. We show that the optical reflectivity difference signals can be quantitatively related to changes in surface mass density of molecular layers as a result of the reactions. Our experimental results demonstrate the feasibility of using oblique-incidence reflectivity difference microscopes for high-throughput proteomics research such as screening unlabeled protein probes against libraries of surface-immobilized small-molecules.
1. INTRODUCTION
Proteomic research aims at a system-wide understanding of abundance, regulation, and functionality of proteins, through their interactions with other “target” molecules. It involves examination of interactions between a large numbers of protein-target pairs under a wide range of conditions. Achieving such a task requires high-throughput techniques that enable assaying a large number of biochemical reactions in parallel. An important class of such techniques is the microarray technology. The latter provides a platform for performing and detecting hundreds to millions of distinct biomolecular reactions simultaneously [1-3].
A biomolecular microarray consists of a two-dimensional array of target spots that are immobilized on a solid surface (such as a functionalized glass slide). Each spot, 20 ∼ 500 μm in diameter and one molecular layer in thickness, consists of a distinct type of molecules that can be DNA, RNA, protein, or small organic molecules. In a high-throughput assay, a biomolecular microarray containing hundreds to thousands of target spots react with a probe solution so that hundreds to thousands of reactions take place simultaneously rather than one at a time. The probe can be small organic molecules, glycans, DNA, RNA, protein, or even cells. The primary advantages of microarray-based assays are high throughput and low target consumption. A major application of biomolecular microarrays is gene expression profiling [3]. Here each spot on a microarray consists of a single-stranded DNA fragment from a specific gene. The fragment can be a 100 ∼ 1000 nucleotide amplified complementary DNA (cDNA) or a 25 ∼ 80 nucleotide long synthetic oligonucleotide. One extracts RNA molecules from a biological sample and converts the molecules into fluorescently labeled complementary DNA or RNA. The latter are then used as the probe to react with surface-immobilized arrays of DNA fragments. Under suitable conditions, the fluorescence yield from a reacted spot is proportional to the amount of RNA transcripts of a gene in the biological sample. In application to proteomics, biomolecular microarrays can be used for either protein expression profiling or protein functionality [1,2]. In a protein expression profiling microarray, target spots are protein-binding molecules such as antibodies [4,5] or small-molecule ligands [6]. When the microarray reacts with a solution of proteins with unknown concentrations under suitable conditions, the amount of protein molecules captured by a surface-bound target is proportional to the concentration of the protein in the solution. Since the abundances of mRNA and the corresponding protein do not necessarily correlate [7], such direct protein profiling is often necessary. In protein functionality microarrays, target spots can be distinct protein molecules (protein microarray) or potential ligands to a specific protein probe (ligand microarray). When a protein microarray react with a molecular probe, one maps out the affinity profile of the probe to a large number of protein targets [8,9]. When a ligand microarray reacts with a protein probe, one screens a larger number of molecular targets for ligands of the protein probe. Useful applications of protein functionality microarrays include early and late stages of drug screening and toxicity assay, biomarker search, and mechanistic studies of protein-molecule interactions.
Many technical challenges remain. These include synthesis and purification of molecule probes and molecular targets, surface immobilization chemistry for microarray fabrication, and high-throughput detection of reactions on protein microarrays. For the latter, fluorescence-based detection is by far the most widely used because of inherent high sensitivity, large dynamic range, and continuing improvement of fluorescent labeling agents in terms of photo-stability and spectral selectivity. In fluorescence detection, one either directly labels molecular probes with fluorescent agents or follow the primary reaction involving unlabeled probes by a secondary reaction. In the secondary reaction, one uses a fluorescently labeled molecule that binds specifically to the primary probe or to an affinity ligand extrinsically attached to the primary molecular probe. Extrinsic labeling agents change how a protein binds to other molecules [1,2] by directly or indirectly altering physical and chemical properties of the protein [2,4,10] including its conformation. The impact of labeling agents on the binding affinity of a protein is often not known a priori. The cost and efficiency of fluorescence labeling process can also be undesirable. It is thus sensible to explore methods of label-free detection, to complement fluorescence-based detection.
We recently developed oblique-incidence optical reflectivity difference (OI-RD) microscopes for label-free detection of biomolecular microarrays. OI-RD is a most sensitive, versatile form of optical ellipsometry [11-14]. An OI-RD microscope detects a biomolecular microarray by measuring the thickness and mass density of target spots. A small change in thickness or mass density in a molecular layer leads to changes in reflectivity (i.e., the ratio of the reflected electric field to the incident electric field). The OI-RD technique has been applied to detection of a wide range of ultrathin films and surface modifications, from vapor-phase-deposited monolayers on solid substrates in vacuum [15], to electrodeposited metal films at liquid-solid interfaces [16], to hybridization reactions of DNA oligomer probes with oligonucleotide microarrays [17]. For microarray studies, the OI-RD technique can be used to evaluate properties of a microarray at each step of processing and to determine kinetics as well as end-points of reactions. We should note that the OI-RD method can be applied to microarrays on all types of optically flat solid supports. Compared to other label-free optical techniques, a scanning OI-RD microscope is more easily configured to detect biomolecular microarrays with over 1000 features [10,17].
In the present paper, we report a series of end-point measurements of surface immobilization of protein targets and reactions of protein probes with surface-bound targets using OI-RD microscopes. We will show how the optical measurements can yield quantitative information on thickness and mass density of a surface-bound molecular layer.
2. EXPERIMENTAL PROCEDURES
2.1. Oblique-incidence optical reflectivity from a microarray spot on a solid support
A typical set-up for detecting oblique-incidence reflectivity difference from a microarray-covered solid surface is sketched in Fig. 1. Let rp0 = |rp0| exp(iΦp0) and rs0 = |rs0| exp(iΦs0) be the reflectivity of the bare substrate for p- and s-polarized components of a monochromatic incident light at wavelength λ. Let rp = |rp| exp(iΦp) and rs = |rs| exp(iΦs) be the reflectivity of the substrate when it is covered with a thin layer of molecules. The fractional change in reflectivity due to the molecular layer is defined as Δp = (rp – rp0)/rp0 and Δs = (rs – rs0)/rs0. We define oblique-incidence reflectivity difference (OI-RD) as Δp - Δs. The real part of the OI-RD signal, Re{Δp - Δs} ≈ (|rp| – |rp0|)/|rp0| - (|rs| – |rs0|)/|rs0|, is simply the differential magnitude change. The imaginary part, Im{Δp - Δs} ≈ (Φp - Φp0) – (Φs - Φs0), is the differential phase change. Since the thickness d of a biomolecular microarray is much less than the optical wavelength λ, Zhu and coworkers [13,18] have shown that
| (1) |
Here θinc is the angle of incidence of the light beam. ε0, εd, and εs are the optical dielectric constants of the ambient, the molecular layer, and the substrate, respectively. When these optical constants are real at λ, only Im{Δp - Δs} remains in Eq. (1),
| (2) |
Figure 1.

Sketch of a scanning OI-RD microscope for microarray detection. The microarray-bearing glass slide is mounted on a translation stage that can move along the x and y directions. PEM: photoelastic modulator for polarization modulation; PS: variable phase shifter; L1: focusing lens for illumination; L2: imaging lens for detection; A: polarization analyzer; PD: single-element or multi-element photodiode detector.
For unlabeled biomolecules immobilized at the interface between a glass slide and an aqueous solution, the ambient, the solid support, and the biomolecular layer are transparent in the visible and near-infrared wavelengths so that ε0, εd, and εs are real. As a result the choice of wavelength in this wavelength range doest not affect the signal significantly as is clear from Eq. (1) and (2). We choose He-Ne lasers normally for high intensity-stability, high spectral-stability, and low cost over other gas or solid-state lasers at other wavelengths. If the biomolecular layer under study happens to have an absorption band in the visible or near-infrared range, it may be advantageous to choose a monochromatic light source with a wavelength close to the band so that Δp – Δs is enhanced since εd becomes large near the absorption band. On the other hand, if the absorption band is photo-bleachable, one often needs to choose light sources at wavelengths not absorbed by the band.
The sensitivity of the OI-RD signal Δp - Δs to d and εd can be optimized by choosing the incidence angle close to the Brewster angle [19]. As pointed out by Zhu, the OI-RD signal given by Eq. (1) or (2) is directly proportional to the angular shift of the surface plasmon resonance at the interface between gold and an ambient (ε0) when a molecular layer with thickness d and optical constant εd is added to the interface, ΔθSPR ≅ (3πd/λ)((εd – ε0)/εd) [20].
In our present study, we interrogate biomolecular microarrays on a functionalized glass surface in air so that ε0 = 1 and εs = 2.28. For quantitative analysis of OI-RD data using Eq. (2), we need to know optical dielectric constants of surface-immobilized molecular targets and protein probes. For serum albumin, immunoglobulin, and streptavidin proteins studied in this paper, we adopt εd = 2.51. This value is representative of globular proteins in general [21-24]. In Appendix A, we give the rationale behind this choice of optical dielectric constants. When the surface coverage Θ of molecular targets on a solid support is less than a full monolayer, there are two possible scenarios. The first is that target molecules uniformly spread over the surface. In this case, εd increases continuously from 1 to 2.51 (the value for bulk-phase protein) when Θ increases from zero to unity. The second scenario is that target molecules aggregate into patches of monolayer-thick film. As a result, εd remains a constant of 2.51 while Θ increases from 0 to 1 and Eq. (2) is reduced to
| (3) |
| (3a) |
This second scenario is what we observe in our present experiment.
2.2. OI-RD Microscopes
As shown in Fig. 1, a p-polarized He-Ne laser beam with λ = 632 nm passes through a photoelastic modulator. The modulator causes the output beam to change between being p-polarized and being s-polarized at a frequency Ω = 50 kHz. The polarization-modulated beam passes through a phase shifter that introduces an adjustable phase difference ΦPS between the p- and s-polarized components. The beam is then focused onto the microarray-covered solid surface at an angle θinc. The reflected beam passes through a polarizing analyzer with the transmission axis set at 45° relative to p-polarization. The intensity of the transmitted beam IR(t) is detected with a photodiode detector. IR(t) consists of various harmonics of modulation frequency Ω. We detect the first harmonic I(Ω) with a lock-in amplifier. As explicitly shown by Thomas and coworkers [15],
| (4) |
Imax(Ω) is measured by adjusting ΦPS with the phase shifter until I(Ω) reaches the maximum. To measure Im{Δp - Δs} from a microarray spot, the phase shifter is initially adjusted such that I(Ω) from the bare glass substrate is set to zero. By moving a microarray-covered region under the same optics, I(Ω) changes from zero to Imax (Ω)Im{Δp – Δs}. Im{Δp - Δs} is deducted from I(Ω)/Imax(Ω).
An OI-RD image is acquired by either a dual-axis mechanical scan or a combination of mechanical scan along x-axis and electronic scan along y-axis. In an “end-point” measurement, an OI-RD image is acquired before and after the microarray is reacted. A non-zero change in the image is a quantitative measure of the reaction. In a dual-axis mechanical scanning microscope, the laser beam is focused to a 5 μm-diameter spot on the glass substrate surface. The reflected beam is detected with a single-element photodiode detector. The microarray-covered glass slide is mounted on a translation stage that moves along the x- and y-axis in a raster pattern. The microarrays in Sections 3.1−3.2 are scanned with a dual-axis mechanical scanning microscope with θinc = 45°. The microarray in Section 3.3 is scanned with a similar microscope but at θinc = 59°. In an OI-RD microscope with a combination of mechanical x-scan and electronic y-scan, the illuminating laser beam is focused to a 16 μm × 2.4 mm line segment along the y-axis on the glass substrate surface at incidence angle θinc = 70°. Passing through a microscope objective, the reflected beam from the line segment forms a magnified image on a 152-element linear photodiode array detector. The y-scan along the 2.4-mm line on the glass surface is achieved by electronically “cherry-picking” the photocurrent outputs from 152 photodiode elements. The OI-RD image of a biomolecular microarray can be obtained at a much higher frame rate with such a hybrid scanning OI-RD microscope as we only need to mechanically move the sample stage along one direction. In Section 3.4 we demonstrate the high-throughput performance of such a hybrid scanning OI-RD microscope. The computer-assisted scan control, image acquisition, and image processing are done with a custom software programmed in LabVIEW (National Instruments, Austin, TX).
Without special surface treatments to increase the number of immobilized targets per unit area by for example using porous polymer scaffolds or to increase the effective substrate optical constant εs from that of a glass by coating the glass slide with high optical constant materials, our OI-RD system has a dynamic range of 102 or better, varying from one microscope to another. The limitation on the dynamic range arises from uncompensated angular drift of the laser beam (i.e., pointing stability) and uncompensated temperature drift in our current microscope configurations. We are in the process of addressing these factors by introducing temperature control and beam-pointing stability control.
2.3. Fabrication of antigen microarrays
Printing
Our first protein microarray consists of four protein targets: mouse IgG, human IgG, rabbit IgG (as antigen targets), and bovine serum albumin (BSA) as the control (all purchased from Jackson ImmunoResearch Laboratories, West Grove, PA). The purity of the three IgG molecules (termed by the manufactured as “ChromPure IgG”) was specified based on immunoelectrophoresis. For the ChromPure rabbit IgG that we purchased and used in the present study, at a concentration of 20 mg/mL of the rabbit IgG, the patter of precipitation against goat anti-rabbit whole serum is the same as the pattern of precipitation against goat anti-rabbit IgG (Fc fragment specific). For the ChromPure human IgG that we purchased ands used in the present study, at a concentration of 20 mg/mL of the human IgG, the pattern of precipitation against goat anti-human whole serum is the same as that against goat anti-human IgG (Fc fragment specific). And no precipitation line was detected against goat anti-human IgM ((Fc5μ fragment specific) or against goat anti-human IgA (α chain specific). For the ChromPure mouse IgG that we purchased and used in the present study, at a concentration of 20 mg/mL of the mouse IgG, the pattern of precipitation against goat anti-mouse whole serum is the same as that against goat anti-mouse IgG (Fc fragment specific). And no precipitation line was detected against goat anti-mouse IgM (μ chain specific) or against goat anti-mouse IgA (α chain specific). The molecular mass for a typical IgG is 150 kDa (1 Da = 1 dalton = 1/12 of the mass of isotope 12C), and is 66 kDa for BSA [21]. Before printing with a robot arrayer, human IgG, mouse IgG, rabbit IgG, and BSA are dissolved in a solution of 1×PBS (phosphate buffer saline, pH 7.4) and 40% (v/v) glycerol [8]. We make a set of solutions for each target with concentrations decreasing successively by a factor of 0.75 from 31 μM down to 0.5 μM (1 μM = 10−6 moles/liter). The solutions are printed in a sequence from the most dilute to the most concentrated to minimize carryover of materials. Microarrays of the four protein targets are printed with a GMS 417 Pin-and-Ring contact-printing robot arrayer (Genetic Microsystems) [3]. During printing, the ring is preloaded with a target solution from a 96-well plate via a capillary action. To print one spot, we deposit a droplet of the target solution to a 150-μm dia. area on an epoxy-coated glass slide (CEL Associates, Pearland, TX) by making the loaded pin gently in contact with the surface three times. The volume of the droplet is reproducible and is in the range of 0.4 ∼ 0.8 nL (1 nL = 10−9 liters). IgG and BSA bind covalently to epoxy groups on the functionalized glass surface through primary amines from the exposed Lysine (or Arginine or Glutamine or Asparagine) residues on the protein surface [25]. The cohesive energy of a primary amine with an epoxy (i.e., the enthalpy for primary amine-epoxy reaction) is between 100 ∼ 120 kJ/mol or 24 ∼ 29 kcal/mol. Because more than one primary amine is available on the surface of a protein such as BSA or IgG, there are many ways that BSA or IgG can bind to an epoxy-functionalized glass. Therefore depending on the condition under which BSA or IgG are introduced to the glass surface, the packing densities and in turn surface mass densities of these two non-spherical protein molecules can be different without forming an overlayer. The difference is made possible by BSA or IgG molecules assuming difference molecular orientations with similar binding energies.
The arrangement of printed spots is shown in Fig. 2(a). The center-to-center separation between spots is 250 μm. The spot diameter is roughly 150 μm. For each concentration of a target, three spots are printed at different locations. The glass slides with printed microarrays are stored in a slide box. The printed spots are completely dried after a few days. The chemical reactivity of the printed microarrays shows no appreciable change after 3 months.
Figure 2.
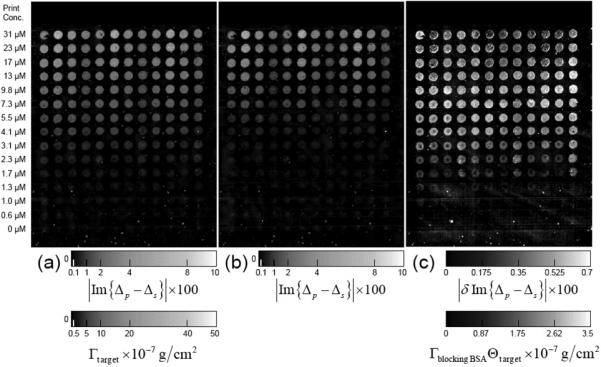
Im{Δp – Δs} images of a target protein microarray. Dilution series of unlabeled human IgG (HM), mouse IgG (MS), rabbit IgG (RB), and bovine serum albumin (BSA) are printed in triplicate. The dashed lines separate the replicates. The optical signals are also converted to the surface mass densities of the targets Γtarget. (a) Im{Δp – Δs} image of the microarray after washing to remove excess unbound protein and buffer precipitates, with the optical signal zeroed on the unprinted part of the surface; (b) Im{Δp – Δs} image of the microarray after the BSA-blocking treatment, with the optical signal zeroed on the originally unprinted but now BSA-blocked part of the surface; (c) The differential image, proportional to Γblocking BSAΘt arg et, obtained by subtracting (b) from (a). The intensity or equivalently target coverage variation within each spot is due to the variation in wetting property of a functionalized glass slide across the spot in combination with the rapid drying process right after printing.
Washing
Before reaction, a microarray-covered glass slide is washed with of 1×PBS solution to remove excess unbound protein and buffer salt precipitates. The washed slide is spun dry in a high-speed microarray centrifuge (TeleChem ArrayIt, Sunnyvale, CA). After the unbound protein and buffer salt are washed off in such a way, the target spots are nominally of one molecular layer in thickness. The washed slide is scanned with a dual-axis mechanical scanning OI-RD microscope before further treatment.
Blocking
After washing, the remaining epoxy groups on the glass slide surface, particularly in the unprinted region, are blocked with bovine serum albumin (BSA) to prevent probe molecules from non-specific binding to the glass during subsequent probe-target reactions. We place a 16 μM solution of BSA in 1×PBS between a cover glass and the glass slide and let the BSA solution to react with the epoxy groups in the glass slide for 150 minutes. Afterward, the cover glass is removed and the slide is washed and spun dry again. BSA-blocked slides are scanned with the same OI-RD microscope before reaction.
Reaction
Unlabeled and Cy3-labeled polyclonal goat IgG antibodies against Fc fragments of human IgG, mouse IgG, and rabbit IgG, are used as protein probes. The goat antibodies were purchased from Jackson ImmunoResearch Laboratories (West Grove, PA). They were affinity-purified by the manufacturer so that for example, the polyclonal goat anti-human antibodies only bind to human IgG in a human serum and not to other proteins present in the same serum. However such a purification process does not exclude the cross reactivity of for example, goat anti-rabbit antibodies with mouse IgG or human IgG. The probe solution is prepared in 1×PBS to a concentration of 0.7 μM (or 0.1 mg/mL). We place the probe solution between a cover glass and the microarray-covered glass slide and allow the reaction to occur at room temperature for 120 min. Afterward, the cover glass is removed and the reacted slide is washed and dried as in the washing step. The reacted glass slide is then scanned with the same OI-RD microscope for changes in OI-RD images. If a Cy3-labeled probe is used, the slide is scanned first with a GMS 418 fluorescence microarray scanner (Genetic Microsystems) before the OI-RD scan to avoid photo-bleaching.
2.4. Fabrication of biotin-BSA conjugate microarrays with control targets
Our second protein microarray consists of human IgG, biotin-BSA conjugates (prepared as described in [6]), and BSA. By conjugating small molecules such as biotin to bovine serum albumin (BSA) through flexible linker molecules, the small molecules can be consistently immobilized (through primary amines on the BSA surface) on a solid support and subsequently studied for reaction with proteins of interest. Each of the three targets in 4.6 μM solution (in 1×PBS with 5% (v/v) glycerol) is printed in triplicate on an epoxy-functionalized glass slide. After printing, the microarray is washed as described in Section 2.3 and then blocked with a 12 μM BSA solution in 1×PBS for 80 minutes. The blocked glass slide is scanned with the dual-axis mechanical scanning OI-RD microscope. It is then reacted with a 0.1 mg/mL solution of unlabeled streptavidin (Sigma-Aldrich, St. Louis, MI) for 150 minutes. The reacted slide is washed and dried before scanned with the same OI-RD microscope.
2.5. Fabrication of an 800-spot BSA microarray for high throughput scan
Our third protein microarray is a microarray with 800 BSA spots for testing the throughput performance of a hybrid scanning OI-RD microscope with a combination of electronic scan along y-axis and mechanical scan along x-axis. We print the 800-spot BSA microarray on an epoxy-functionalized glass slide at a concentration of 4.5 μM in a 1×PBS, 40% (v/v) glycerol solution. The slide is stored in a slide box for 24 hours and then washed and dried using the same method as described in Section 2.3. The BSA microarray is scanned with the hybrid scanning OI-RD microscope.
3. RESULTS AND DISCUSSION
3.1. Surface immobilization of protein targets: OI-RD images of a protein microarray after washing and blocking
In Fig. 2(a) we show Im{Δp – Δs} image of a 4-target protein microarray (see section 2.3) after washing. One may regard an OI-RD image as equivalent of a resonance-angle-shift image in surface-plasmon resonance detection since they arise from same properties of a surface-bound molecular layer. For all four protein targets (human IgG (HM), mouse IgG (MS), rabbit IgG (RB), and BSA), the optical signals increase with printing concentration from 0.5 μM up to 31 μM. In Fig. 3, we plot the spatially averaged Im{Δp – Δs} as a function of printing concentration. Im{Δp – Δs} maintains the sign in the entire range of printing concentration. Since the coverage of the immobilized protein molecules reaches a “full” monolayer, this means that the molecule targets aggregate into monolayer-thick patches so that the optical response is described by Eq. (3) instead of Eq. (2). Otherwise the protein molecules the optical constant εd would change continuously from 1 to 2.51 and at some intermediate printing concentration εd would be equal to that of the glass substrate εs = 2.28, causing Im{Δp – Δs} in Eq. (2) to change the sign. We can rewrite Eq. (3) in terms of surface mass density of the targets given by Γt arg et ≡ Θt arg etdt arg etρt arg et (in units of g/cm2) [21,23-24],
| (5) |
Using εt arg et = 2.51 and ρt arg et = 1.35 g/cm3 (see Appendix A), we solve Eq. (5) for Γt arg et,
| (6) |
Surface mass densities of the targets obtained from Eq. (6) are labeled on the right sides of Fig. 3. Γtarget does not level off at the value for a full monolayer of targets in side-on geometry (2.5×10⁻⁷ g/cm2). Instead it approaches the value consistent with a full monolayer of targets in end-on geometry (see Appendix B). We should point out that if the glass surface remains in contact with the target solution at all time during the optical measurement, Γtarget for the IgG and BSA molecules at a concentration as high as 160 μM does level off to values corresponding to a full side-on monolayer [26-28]. When a microarray is printed in air and inevitably and rapidly dries up, the protein concentration and the buffer salt concentration within the printed spot increase far beyond the original concentrations. Apparently under this condition the printed BSA and IgG reach higher packing densities than that for a side-on monolayer without forming an overlayer (The latter should have been washed away during washing step).
Figure 3.

Averaged Im{Δp – Δs} from the printed targets on the washed microarray versus printing concentrations. The corresponding surface mass density Γtarget is shown on the right side. Each point is the mean of the three replicates. The error bars show the standard deviations of the signals from the replicates (due to the microarray printing process.) The lines are guides for the eyes. The insets illustrate the proposed evolution of the target (IgG and BSA) coverage and orientation, inferred from the surface mass densities.
By blocking the protein microarray with a solution of bovine serum albumin in the subsequent step, we can see more clearly that the surface is already fully covered with the protein targets in tern of foot print at printing concentrations as low as 4 μM, and therefore at higher concentrations only the average thickness dtarget of the target protein layer increases. Fig. 2(b) shows the Im{Δp – Δs} image of the microarray after the un-reacted epoxy groups on the glass surface have fully reacted with BSA. At this point the surface is fully covered with either the protein targets or BSA. With the microscope used in this study the blocking treatment is done with the glass slide taken out of the microscope. When the blocked glass slide is put back into the sample holder for subsequent scan, we zero I(Ω) on the originally unprinted but subsequently BSA-blocked part of the surface. As a result relative to the BSA-blocked surface, Im{Δp – Δs} decreases at the originally printed spots. This is expected as Im{Δp – Δs} from the unprinted region increases due to uptake of a full side-on BSA monolayer while the uptake of BSA on the printed spots is less or none at all. The optical signal from in Fig. 2(b) is given by
| (7) |
where dblocking BSA is the monolayer thickness of the blocking BSA. By subtracting Fig. 2(b) from Fig. 2(a), the difference (as shown in Fig. 2(c)) is given by
| (8) |
where Γblocking BSA = dblocking BSAρblocking BSA is the surface mass density of one monolayer blocking BSA. As in Eq. (6) we can rearrange Eq. (8) to solve for Γblocking BSAΘt arg et,
| (9) |
In Fig. 4, we show the spatially averaged Γblocking BSAΘt arg et in the printed spots vs. printing concentrations. Most interestingly, Γblocking BSAΘt arg et reaches a saturation value of 2.0×10⁻⁷ g/cm2 near 4 μM. Since Γblocking BSA = 2×10⁻⁷ g/cm2 remains unchanged in the entire range of printing concentrations (corresponding to a full monolayer of BSA in side-on geometry [26-28]), this shows that at print concentrations as low as 4 μM, the coverage (foot-print) of the printed protein targets had reached a full monolayer so that Θt arg et = 1 before blocking. When the printing concentration increases further from 4 μM to 31 μM, Θt arg et remains unchanged. Since the surface mass density for a target is given by Γt arg et ≡ Θt arg etdt arg etρt arg et, the continuing increase in surface mass density (as displayed in Fig. 3(a)) must result from increasing dt arg et. Therefore we propose that at printing concentrations beyond 4 μM, more protein molecules are accommodated within the constraint of one full monolayer by an increasing number of the protein molecules taking on the end-on geometry, as illustrated by insets in Fig. 3.
Figure 4.

Surface mass density Γblocking BSA of the BSA-blocking layer multiplied by the target coverage Θtarget versus printing concentration, obtained from Fig. 2(c). Each point is the average of the three replicate spots. The error bars show the standard deviations.
3.2. OI-RD detection of protein-protein reaction: antibody-antigen capture
The BSA-blocked microarray subsequently reacts with a mixture of two probe solutions (see Section 2.3 for procedure): unlabeled goat polyclonal IgG antibody against the Fc fragment of mouse IgG (MS) and Cy3-labeled goat polyclonal IgG antibody against the Fc fragment of human IgG (HM). The available goat IgG probe molecules in the solution mixture far exceed in number the surface-immobilized targets. Figure 5a shows the Im{Δp – Δs} image of the microarray after the reaction by nulling I(Ω) on the BSA-blocked surface. Figure 5b shows the difference, δIm{Δp – Δs}, taken by subtracting Figure 2b from Figure 5a. The surface mass density Γgoat IgG of the captured goat antibodies is computed from δIm{Δp – Δs} as follows,
| (10) |
Clearly the goat IgG antibodies have reacted specifically with the respective targets (MS and HM). The fluorescence scan of the microarray as shown in Figure 5c confirms the reaction of the Cy3-labeled goat IgG anti-human with the human IgG targets.
Figure 5.

Im{Δp – Δs} and fluorescence images of a 4-target microarray after reaction with unlabeled goat antibody against the mouse IgG (MS) and Cy3-labeled goat antibody against the human IgG (HM). (a) Im{Δp – Δs} image of the microarray with the optical signal zeroed on the originally unprinted but subsequently BSA-blocked part of the surface; (b) The differential image, δIm{Δp – Δs}, obtained by subtracting Fig. 2(b) from Fig. 5(a) (the corresponding surface mass density of the captured goat antibody probes computed from δIm{Δp – Δs} is also shown); (c) The Cy3-fluorescence image of the microarray.
In Figure 6 we display Cy3-fluorescence yields and surface mass densities of the captured goat IgG antibodies vs. target printing concentration. The fluorescence yields from reacted human IgG targets show that the binding sites on human IgG targets accessible to Cy3-labeled goat IgG antibodies reach saturation when the printing concentration is above 6 μM. The fluorescence yields from rabbit IgG targets are not zero but a factor of 10 down in intensity, due to cross-reactivity with the Cy3-labeled goat IgG antibodies against human IgG. The fluorescence yield from the BSA-blocked surface is ∼ 100 times weaker in intensity, indicating that the efficiency of the BSA-blocking is more than 99% in terms of covering the reacted or unprinted glass surface. From the OI-RD image and Eq. (10), we can see that the surface mass density Γgoat IgG of the captured goat anti-human IgG from the human IgG target spots also reaches saturation at the printing concentration of 6 μM, in agreement with the fluorescence yield measurement. The saturation value of Γgoat IgG is 1.5×10⁻⁷ g/cm2, ∼ 60% of a full side-on monolayer of goat IgG.
Figure 6.
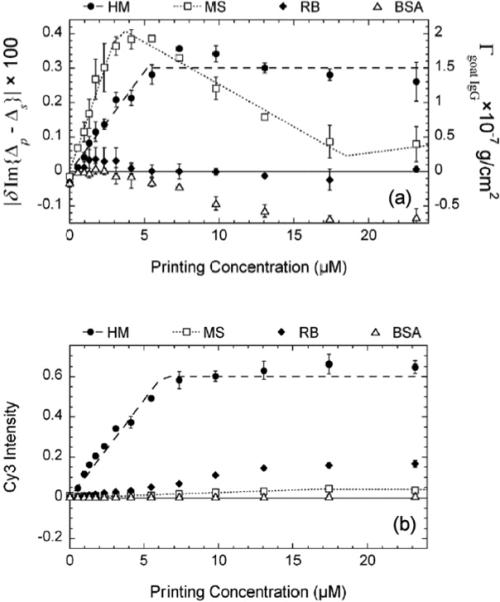
(a) Change in Im{Δp – Δs} and the corresponding surface mass density of the captured goat antibody probes Γgoat IgG vs. target printing concentration (from Fig. 5(b)) after the reactions with unlabeled goat anti-mouse IgG and Cy3-labeled goat anti-human IgG; (b) the Cy3-fluorescence yield after the same reaction (from Fig. 5(c)).
After the reaction of unlabeled goat anti-mouse IgG with the same microarray, |δIm{Δp – Δs}| from the mouse IgG targets vs. printing concentration behaves similarly up to ∼ 6 μM. However at higher concentrations, |δIm{Δp – Δs}| from the mouse IgG targets decreases. At this point we do not understand this unusual behavior. We should note that the rabbit IgG targets and printed BSA control spots also exhibit unexpected reduction after the reaction.
As another example of the OI-RD detection of antibody-antigen capture reactions, we have performed two back-to-back reactions on a separate antigen microarray with only unlabeled probes: the first reaction is with the goat anti-rabbit IgG and the second reaction is with the goat anti-mouse IgG. The microarray consists of four targets printed in a dilution series with concentrations up from 0 to 7 μM. The four targets are human IgG, mouse IgG, rabbit IgG, and BSA. In Figure 7a we show the surface mass density of the captured goat anti-rabbit IgG after the first reaction. In Figure 7b we show the surface mass density of the captured goat anti-mouse IgG after the second reaction. Up to 7 μM, the results in Figure 7 are qualitatively the same as the results shown in Figure 5b. The two back-to-back reactions are highly specific. The average surface mass density of the captured goat antibodies vs. printing concentration is plotted in Fig. 8. The maximum Γgoat IgG captured by their respective antigen targets is close to 2.5×10⁻⁷ g/cm2, roughly a full side-on goat IgG monolayer.
Figure 7.

(a) The differential Im{Δp – Δs} image of a 4-target microarray after a reaction with the unlabeled goat antibodies against the rabbit IgG, obtained by subtracting the Im{Δp – Δs} image taken after the BSA-blocking step from the image taken after the reaction. (b) The differential Im{Δp – Δs} image of the same 4-target microarray after the subsequent reaction with the unlabeled goat antibodies against the mouse IgG (obtained by subtracting the Im{Δp – Δs} image taken after the first reaction from the image taken after the second reaction).
Figure 8.

(a) Surface mass density Γgoat IgG of the captured goat antibody probes against the rabbit IgG vs. target printing concentration, after the first reaction (from Fig. 7(a)). (b) Surface mass density Γgoat IgG of the captured goat antibody probes against the mouse IgG vs. target printing concentration, after the second reaction (from Fig. 7(b)).
3.3. OI-RD detection of protein binding to small molecule microarray – streptavidin reaction with surface-immobilized biotin-BSA complexes
To use the microarray platform in search for small-molecule ligands to proteins, one useful strategy is to conjugate a small molecule candidate to a macromolecular carrier [6] such as BSA (through a flexible linker to keep the chemical property of the small molecule as intact as possible). The small-molecule-BSA conjugates can then be immobilized on a functionalized glass surface through the primary amines on the surface of and form a small-molecule microarray. By reacting the microarray with a protein of interest, one can screen a large number of small molecules for ligands.
To test this strategy on the OI-RD detection platform, we measured the reaction of unlabeled streptavidin with a microarray consisting of biotin-BSA conjugates as ligand targets, human IgG and unmodified BSA as control targets. All targets are printed at concentration of 4.55 μM. Each biotin-BSA conjugate has on average 3 biotin molecules attached to a BSA molecule. After washing, the OI-RD image shows that each printed spot consists of a monolayer of targets in side-on geometry. In Figure 9a, we display the Im{Δp – Δs} image taken after BSA blocking but before the microarray reacts with streptavidin. Figure 9b shows the Im{Δp – Δs} image after the reaction with unlabeled streptavidin. Figure 9c shows the difference δIm{Δp – Δs} taken by subtracting Figure 9a from Figure 9b. The streptavidin only react with the biotin-BSA targets as expected. We have converted the optical signal δIm{Δp – Δs} to the surface mass density of the captured streptavidin Γstreptavidin using the following equation,
| (11) |
With εstreptavidin = 2.51, and ρstreptavidin = 1.35 gm/cm3 (see Appendix A), Eq. (11) is further simplified to
| (12) |
From the result shown in Fig. 9c, we find Γstreptavidin = 1.4×10⁻⁷ g/cm2 on the biotin-BSA targets. If we treat streptavidin as a more or less spherical molecule with a diameter of 5 nm [29,30], a monolayer of streptavidin in square packing geometry has a surface number density of 4×10¹² molecules/cm2 and thus a surface mass density of 4×10⁻⁷ g/cm2. Our experimental Γstreptavidin = 1.4×10⁻⁷ g/cm2 implies that the number of the captured streptavidin on biotin-BSA targets is roughly one streptavidin per one side-on Biotin-BSA conjugate. The latter has a surface number density of 1.8×10¹² molecules/cm2. Knowing that a tetrameric streptavidin molecule is smaller than a biotin-BSA conjugate, our findings of one streptavidin per biotin-BSA conjugate means that either each biotin-BSA conjugate has one biotin target physically accessible to streptavidin or each tetrameric streptavidin molecule is anchored down by multiple biotin targets (enabled by the linker molecule between a biotin target and its BSA carrier).
Figure 9.

(a) Im{Δp – Δs} image of a 3-target protein microarray (i.e., human IgG (HM), biotinylated BSA (biotin-BSA), and unmodified BSA) after BSA blocking treatment. All the targets are printed at the same concentration of 4.55 μM. (b) Im{Δp – Δs} image of the 3-target protein microarray after reaction with streptavidin. (c) The differential image, δIm{Δp – Δs}, obtained by subtracting (a) from (b). The surface mass density of the captured streptavidin is computed from δIm{Δp – Δs} using Eq. (12).
3.4. High-speed OI-RD detection of large protein microarrays
High–throughput detection of biomolecular reactions requires more than just the microarray format. Target and probe preparation, microarray fabrication, and subsequent or simultaneous detection of reactions with the microarray all need to be done efficiently [9]. In our first scanning OI-RD microscope, one “point” (a few microns in diameter) on a sample surface is illuminated at a time and the reflection is imaged onto a single detector for analysis. An OI-RD image of the microarray is obtained by mechanically moving the sample along both x and y-axis along the surface plane (see Fig. 1). In this dual-axis mechanical scanning mode, most of the scan time is spent on moving the sample holder instead of data acquisition. For an 800-spot microarray with the spot diameter of 120 microns and the center-to-center spot separation of 300 microns, it takes 120 minutes to acquire an OI-RD image with the pixel size of 15-micron×15-micron and the data averaging time of 2 ms per pixel. Out of the 120 minutes, just 10 minutes are spent on data averaging while the remaining 110 minutes are spent on moving the sample.
To increase the throughput of our OI-RD detection, we further developed a hybrid scanning OI-RD microscope equipped with a 152-element photodiode linear detector array. With a cylindrical lens, we focus the illumination laser beam into a 2.4-mm line segment along the y-axis on a sample surface and image the illuminated line segment onto the 152-element photodiode detector. Each photodiode detects the reflected light from a 15-micron segment of the illuminated line. By electronically cherry-picking photodiode elements for signal analysis, we achieve the y-scan without moving the sample holder along y direction. This multi-detector, hybrid scanning strategy improves the image acquisition rate dramatically.
In Figure 10, we display an OI-RD image of an 800-spot BSA microarray acquired with the hybrid scanning microscope at a surface pixel size of 15-micron×15-micron. Using the data averaging time of 2 ms per pixel, the image acquisition takes less than 15 minutes, - a factor of 10 reduction in scan time when compared to the acquisition time of the dual-axis mechanical scanning OI-RD microscope. Out of 15 minutes, 10 minutes are spent on signal averaging while only 5 minutes are spent on moving the sample holder along x-axis and on software execution of data acquisition and storage.
Figure 10.

Im{Δp – Δs} image of a 800-spot BSA microarray acquired with a hybrid scanning OI-RD microscope. The image area is 6.5 mm × 12 mm and the pixel size is 15 μm × 15 μm. Averaging for 2 ms at each pixel, the image takes 15 minutes to acquire.
The hybrid scanning microscope also enables real-time measurements of reaction kinetics on a microarray. With a field of view of 2.4 mm for the multi-element photodiode array detector, we can detect 10 microarray spots separated by 250 μm without any mechanical scanning. By electronically switching among 10 photodiode elements, we can follow 10 biochemical reactions simultaneously with a time resolution of 20 ms.
4. CONCLUDING REMARKS
Biomolecular microarrays are powerful enabling platforms in proteomic research. We demonstrated that oblique-incidence reflectivity difference (OI-RD) microscopes are effective optical tools for high-throughput, label-free microarray detection. By detecting the optical dielectric response instead of the fluorescent yield from a surface-bound molecular layer, an OI-RD microscope enables one to track the microarray through all steps of processing including reactions. Using known protein-molecule reactions (antibody-antigen and streptavidin-biotin) as examples, we showed the effectiveness of scanning OI-RD microscopes in end-point detection of protein-protein and protein small-molecule reactions in microarray format. Furthermore we can quantitatively relate the optical reflectivity difference signals, Im{Δp – Δs}, to the surface mass density of the protein layer before and after reactions.
Our current OI-RD microscopes are capable of detecting end-points of a 1000-spot microarray in ∼ 15 minutes. In addition to end-point measurements (as reported in this study), scanning OI-RD microscopes are also capable of monitoring in real time the kinetics of hundreds or even thousands of distinct reactions on a microarray [31].
Acknowledgements
This work was supported by the University of California Biotechnology Research and Education Program under UC-GREAT Grant 2004−09, by the National Science Foundation Center for Biophotonics Science and Technology (CBST) under Cooperative Agreement PHY 0120999, and by National Institutes of Health under NIH-5-R01-HG003827−02. We thank Tian Bao and Kit Lam for providing the biotinylated BSA samples.
Appendix A: Optical dielectric constants and volume mass densities of proteins
To analyze optical reflectivity difference signals in an end-point study, we need to know optical dielectric constants of dry proteins in a printed microarray εd. In the present study we assume that εd is the same as the optical constant of the bulk-phase proteins ε. ε is related to the refractive index n of bulk-phase proteins by ε = n2. One method of finding ε is to measure refractive indices of protein solutions vs. the concentration [25] and extrapolate the result to the bulk-phase (solid-phase) concentration. The optical dielectric constant of a single-component molecular liquid or molecular solid is given by the Clausius-Mossotti relation (in the standard international system of units),
| (A-1) |
where Nb is the number of molecules per unit volume (in units of m−3). It is proportional to the bulk-phase mass density ρ of molecules (in commonly used unit of gm/cm3). γmol is the polarizability of the molecule (in unit of m3) at the optical wavelength λ. When protein molecules dissolve in a buffer solution at a mass concentration c < ρ, the polarizabilities of the dissolved proteins and the buffer are additive. From Eq. (A-1), we expect
| (A-2) |
where is the optical constant of the buffer solution without the protein and is the optical constant of the buffer with the dissolved protein at concentration c. Since the optical constant of the bulk-phase protein is not much larger than that of the buffer, Eq. (A-2) can be approximated by
| (A-3) |
In fact as long as ε – εbuffer < 0.8, Eq. (A-3) agrees with Eq. (A-2) within 1% over the entire range of protein concentration (i.e., 0 < c < ρ). Eq. (A-3) shows that n = nsolution (ρ). Since one cannot have a protein solution with the concentration c equal to the bulk-phase value ρ, we can obtain nsolution (ρ) by extrapolation. Values of refractive indices of protein solution vs. concentration c or dnsolution/dc = (n – nbuffer)/ρ and values of specific volumes 1/ρ have been measured and tabulated for a large number of proteins [21]. Measurements are carried out in an buffer with nbuffer = 1.332. To find nsolution (ρ) ≅ n and in turn ε = n2, we extrapolate the results of these measurements by substituting ρ into Eq. (A-3).
For bovine serum albumin (BSA), dnsolution/dc = 0.185 cm3/g, ρ = 1.36 g/cm3, we find ε = 2.51. For human IgG, dnsolution/dc = 0.189 cm3/g and ρ = 1.35 g/cm3, we arrive at ε = 2.52. These values are representative of globular proteins [21-24]. For the purpose of this report we will use ρ = 1.35 g/cm3 and ε = 2.51 for BSA, biotinylated BSA, immunoglobulin G (IgG), and streptavidin.
We are mindful that the bulk-phase refractive index of a protein obtained through measurements of refractive indices of protein solutions is an approximation to the refractive index for dry proteins immobilized on a solid support. This is because the molecular polarizability γmol, dry of a dry protein molecule is likely to be different from that of a protein in solution γmol, wet due to the solvation effect and potential conformational changes. For surface-immobilized protein molecules inside an aqueous fluid cell, this approximation should work better.
Appendix B: Surface mass densities of proteins determined from geometric sizes of the molecules
Physical methods such as analytical ultracentrifugation, dielectric dispersion, and transient birefringence have been used to measure the hydrodynamic size of proteins, modeled as ellipsoids [32-35]. For BSA the ellipsoid has axis lengths 4.0 nm × 4.0 nm × 14.0 nm [35] and for human IgG 4.4 nm × 4.4 nm × 23.5 nm [33] (which we will take as the representative for IgG from other species). The uncertainty for each length is about 0.5 nm. Though structures of these proteins determined from the crystallography data [37-39] show that shapes of these proteins deviate significantly from ellipsoids, estimates of surface mass densities based upon ellipsoidal models have been shown in reasonable agreement with the observations of adsorbed protein monolayers in a variety of experiments [23, 26-28].
Given the ellipsoidal shape, the surface mass density of a “side-on” monolayer of BSA molecules (with the long axis parallel to the substrate surface) packed in a rectangular lattice is 1.9×10⁻⁷ g/cm2 (1.8×10¹² molecules/cm2). For IgG molecules, a “side-on” monolayer packed in rectangular lattice has a surface mass density of 2.5×10⁻⁷ g/cm2 (1.0×10¹² molecules/cm12). For an “end-on” monolayer of BSA molecules (with the long axis perpendicular to the substrate surface) packed in square lattice, the surface mass density is 6.8×10⁻⁷ g/cm2 (6.3×10¹² molecules/cm12). For IgG molecules, an end-on layer packed in square lattice has a surface mass density of 13×10−7 g/cm2 (5.3×10¹² molecules/cm12). These values are expected to be accurate only to within 30% [25, 27] due to uncertainty in actual shape and packing arrangement of the protein molecules.
REFERENCES
- 1.Kodadek T. Protein microarrays: prospects and problems. Chem. Biol. 2001;8:105–115. doi: 10.1016/s1074-5521(00)90067-x. http://www.sciencedirect.com/science/journal/10745521. [DOI] [PubMed]
- 2.MacBeath G. Protein microarrays and proteomics. Nat. Genet. 2002;32:526–532. doi: 10.1038/ng1037. http://www.nature.com/ng/journal/v32/n4s/index.html. [DOI] [PubMed]
- 3.Schena M. Microarray Analysis. John Wiley and Sons; Hoboken: 2003. [Google Scholar]
- 4.Haab BB, Dunham MJ, Brown PO. Protein microarrays for highly parallel detection and quantification of specific proteins and antibodies in complex solutions. Genome Biology. 2001;2:1–13. doi: 10.1186/gb-2001-2-2-research0004. [DOI] [PMC free article] [PubMed] [Google Scholar]
- 5.Miller JC, Zhou H, Kwekel J, Cavallo JR, et al. Antibody microarray profiling of human prostate cancer sera: Antibody screening and identification of potential biomarkers. Proteomics. 2003;3:56–63. doi: 10.1002/pmic.200390009. [DOI] [PubMed] [Google Scholar]
- 6.Xu Q, Miyamoto S, Lam KS. A novel approach to chemical microarray using ketone-modified macromolecular scaffolds: Application in micro cell-adhesion assay. Mol. Diversity. 2004;8:301–310. doi: 10.1023/b:modi.0000036238.42200.3d. [DOI] [PubMed] [Google Scholar]
- 7.Gygi SP, Rochon Y, Franza BR, Aebersold R. Correlation between protein and mRNA abundance in yeast. Mol. Cell Biol. 1999;19:1720–1730. doi: 10.1128/mcb.19.3.1720. [DOI] [PMC free article] [PubMed] [Google Scholar]
- 8.MacBeath G, Schreiber SL. Printing proteins as microarrays for high-throughput function determination. Science. 2000;289:1760–1763. doi: 10.1126/science.289.5485.1760. [DOI] [PubMed] [Google Scholar]
- 9.Zhu H, et al. Global analysis of protein activities using proteome chips. Science. 2001;293:2101–2105. doi: 10.1126/science.1062191. [DOI] [PubMed] [Google Scholar]
- 10.Landry JP, Zhu XD, Gregg JP, Guo XW. In: Microarrays and Combinatorial Techniques: Design, Fabrication, and Analysis II, Proceedings of SPIE. Nicolau DV, Raghavachari R, editors. Vol. 5328. 2004. pp. 121–128. [Google Scholar]
- 11.Azzam RMA, Bashara NM. Ellipsometry and Polarized Light. North Holland Publishing; Amsterdam: 1987. [Google Scholar]
- 12.Arwin H. In: Physical Chemistry of Biological Interfaces. Baszkin A, Norde W, editors. Marcel Dekker; New York: 2000. pp. 577–607. [Google Scholar]
- 13.Wong A, Zhu XD. An optical differential reflectance study of adsorption and desorption of xenon and deuterium on Ni(111) Appl. Phys. 1996;A 63:1–8. [Google Scholar]
- 14.Zhu XD, et al. Epitaxial growth of SrTiO3 on SrTiO3(001) using an oblique-incidence reflectance-difference technique. Phys. Rev. 1998;B 57:2514–2519. [Google Scholar]
- 15.Thomas P, et al. An oblique-incidence optical reflectivity difference and LEED study of rare-gas growth on a lattice-mismatched metal substrate. Appl. Phys. 2004;A 79:131–137. [Google Scholar]
- 16.Schwarzacher W, Gray J, Zhu XD. Oblique incidence reflectivity difference as an in situ probe of Co electrodeposition on polycrystalline Au. Electrochem. Solid-State Lett. 2003;6:C73–C76. [Google Scholar]
- 17.Landry JP, Zhu XD, Gregg JP. Label-free detection of microarrays of biomolecules by oblique-incidence reflectivity difference microscopy. Opt. Lett. 2004;29:581–583. doi: 10.1364/ol.29.000581. [DOI] [PubMed] [Google Scholar]
- 18.Zhu XD. Oblique-incidence optical reflectivity difference from a rough film of crystalline material. Phys. Rev. 2004;B. 69:115407-1–115407-5. [Google Scholar]
- 19.Landry JP, Gray J, O'Toole MK, Zhu XD. Incidence-angle dependence of optical reflectivity difference from an ultrathin film on solid surface. Opt. Lett. 2006;31:531–533. doi: 10.1364/ol.31.000531. [DOI] [PubMed] [Google Scholar]
- 20.Zhu XD. Comparison of two optical techniques for label-free detection of biomolecular microarrays on solids. Opt. Commun. 2006;259:751–753. [Google Scholar]
- 21.Sober HA, editor. Handbook of Biochemistry. Chemical Rubber Co.; Cleveland: 1970. [Google Scholar]
- 22.Fischer H, Polikarpov I, Craievich AF. Average protein density is a molecular-weight-dependent function. Protein Sci. 2004;13:2825–2828. doi: 10.1110/ps.04688204. [DOI] [PMC free article] [PubMed] [Google Scholar]
- 23.De Feijter JA, Benjamins J, Veer FA. Ellipsometry as a tool to study the adsorption behavior of synthetic and biopolymers at the air-water interface. Biopolymers. 1978;17:1759–1772. [Google Scholar]
- 24.Ball V, Ramsden JJ. Buffer dependence of refractive index increments of protein solutions. Biopolymers. 1998;46:489–492. [Google Scholar]
- 25.Jung LS, et al. Quantitative Interpretation of the Response of Surface Plasmon Resonance Sensors to Adsorbed Films. Langmuir. 1998;14:5636–5648. [Google Scholar]
- 26.Rozenberg BA. Kinetics, Thermodynamics and Mechanism of Reactions Epoxy Oligomers with Amines. In: Dušek K, editor. Epoxy Resins and Composites II, Advances in Polymer Sciences. Vol. 75. Springer-Verlag; Berlin: 1986. pp. 115–165. [Google Scholar]
- 27.Goelander CG, Kiss E. Protein adsorption on functionalized and ESCA-characterized polymer films studies by ellipsometry. J. Colloid Interface Sci. 1988;121:240–253. [Google Scholar]
- 28.Fair BD, Jamieson AM. Studies of protein adsorption on polystyrene latex surfaces. J. Colloid Interface Sci. 1980;77:525–534. [Google Scholar]
- 29.Baszkin A, Lyman DJ. The interaction of plasma proteins with polymers. I. Relationship between polymer surface energy and protein adsorption/desorption. J. Biomed. Mater. Res. 1980;14:393–403. doi: 10.1002/jbm.820140406. [DOI] [PubMed] [Google Scholar]
- 30.Hendrickson WA, et al. Crystal structure of core streptavidin determined from multiwavelength anomalous diffraction of synchrotron radiation. Proc. Natl. Acad. Sci. 1989;86:2190–2194. doi: 10.1073/pnas.86.7.2190. [DOI] [PMC free article] [PubMed] [Google Scholar]
- 31.Weber P, Ohlendorf D, Wendoloski J, Salemme F. Structural origins of high-affinity biotin binding to streptavidin. Science. 1989;243:85–88. doi: 10.1126/science.2911722. [DOI] [PubMed] [Google Scholar]
- 32.Zhu XD, et al. Oblique-Incidence Reflectivity Difference Microscope for Label-Free High-Throughput Detection of Biochemical Reactions in Microarray Format. Appl. Opt. 2007;46:1890–1895. doi: 10.1364/ao.46.001890. [DOI] [PMC free article] [PubMed] [Google Scholar]
- 33.Oncley JL, Scatchard G, Brown A. Physicochemical characteristics of certain of the proteins of normal human plasma. J. Phys. Colloid Chem. 1947;51:184–198. doi: 10.1021/j150451a014. [DOI] [PubMed] [Google Scholar]
- 34.Oncley JL. The investigation of proteins by dielectric measurements. Chem. Rev. 1942;30:433–450. [Google Scholar]
- 35.Wright AK, Thompson MR. Hydrodynamic structure of bovine serum albumin determined by transient electric birefringence. Biophys. J. 1975;15:137–141. doi: 10.1016/s0006-3495(75)85797-3. [DOI] [PMC free article] [PubMed] [Google Scholar]
- 36.Squire PG, Moser P, O'Konski CT. The hydrodynamic properties of bovine serum albumin monomer and dimer. Biochem. 1968;7:4261–4272. doi: 10.1021/bi00852a018. [DOI] [PubMed] [Google Scholar]
- 37.He XM, Carter DC. Atomic structure and chemistry of human serum albumin. Nature. 1992;358:209–215. doi: 10.1038/358209a0. [DOI] [PubMed] [Google Scholar]
- 38.Harris LJ, Larson SB, Hasel KW, McPherson A. Refined structure of an intact IgG2a monoclonal antibody. Biochem. 1997;36:1581–1597. doi: 10.1021/bi962514+. [DOI] [PubMed] [Google Scholar]
- 39.Sugio S, et al. Crystal structure of human serum albumin at 2.5 Å resolution. Protein Eng. 1999;12:439–446. doi: 10.1093/protein/12.6.439. [DOI] [PubMed] [Google Scholar]