

Abstract
The conformation space occupied by different classes of biomolecules measured by ion mobility-mass spectrometry (IM-MS) is described for utility in the characterization of complex biological samples. Although the qualitative separation of different classes of biomolecules on the basis of structure or collision cross section is known, there is relatively little quantitative cross-section information available for species apart from peptides. In this report, collision cross sections are measured for a large suite of biologically salient species, including oligonucleotides (n=96), carbohydrates (n=192), and lipids (n=53), which are compared to reported values for peptides (n= 610). In general, signals for each class are highly correlated, and at a given mass, these correlations result in predicted collision cross sections that increase in the order oligonucleotides<carbohydrates<peptides<lipids. The specific correlations are described by logarithmic regressions, which best approximate the theoretical trend of increasing collision cross section as a function of increasing mass. A statistical treatment of the signals observed within each molecular class suggests that the breadth of conformation space occupied by each class increases in the order lipids<oligonucleotides<peptides<carbohydrates. The utility of conformation space analysis in the direct analysis of complex biological samples is described, both in the context of qualitative molecular class identification and in fine structure examination within a class. The latter is demonstrated in IM-MS separations of isobaric oligonucleotides, which are interpreted by molecular dynamics simulations.
Keywords: Ion mobility, Ion mobility-mass spectrometry, Mass spectrometry, Collision cross section, Conformation space, Oligonucleotides, Carbohydrates, Peptides, Lipids
Introduction
Many contemporary biological studies center on broad-scale “omics” characterization of complex biological systems, e.g., genomics, glycomics, proteomics, lipidomics, and metabolomics. Typically, such studies are performed separately for each biomolecular class and then combined across classes to derive information about a system as a whole with the ultimate aim of incorporating the data into a systems biology understanding or knowledgebase [1]. Although this reductionist methodology is effective, it may underestimate the intricate relationships of the integrated processes [2–5]. For example, when carbohydrates are analyzed separately from their associated glycoconjugates, it can be challenging to assess the interaction between specific moieties and to derive accurate structural information [6]. Although difficult to realize experimentally, all biomolecular classes would ideally be characterized simultaneously to preserve biochemical interdependencies. There are four primary advantages to performing simultaneous omics measurements, including (1) characterizing all biomolecular species simultaneously provides high throughput and rapid analyses (i.e., comprehensive characterization of complex mixtures), (2) the ability to minimize sample losses and sample preparation artifacts from extensive purification procedures (e.g., in tissue imaging, characterizing cell exudates, lysates, etc.), (3) preserving the biomolecular context, such as that encountered with conjugate species (e.g., biomolecular complexes, glycoproteins, and glycolipids, etc.), and (4) ability to observe unpredicted biomolecular interdependencies or correlations.
High-throughput separations on the basis of ion mobility-mass spectrometry (IM-MS) have demonstrated great utility in life sciences research [7–11]. Ion mobility separations are performed on the basis of the ion-neutral collision cross section with a neutral background gas, which is proportional to apparent ion surface area. When coupled with mass spectrometry, IM provides gas-phase separations in one dimension on the basis of structure and in a second dimension by mass-to-charge (m/z), respectively. Structural interpretation is afforded through comparing molecular dynamics simulations with empirically determined collision cross sections. In contrast with atomic structural resolution afforded by methods such as X-ray crystallography or nuclear magnetic resonance, IM coupled with molecular dynamics provides a relatively low-resolution structure consistent with the experimental results. However, IM-MS can provide this information for small quantities of sample (e.g., less than a nanogram) for many analytes directly from complex mixtures. Structural information notwithstanding IM-MS provides extremely rapid 2D gas-phase separations in comparison with condensed-phase separations such as those encountered in LC-MS (microseconds and milliseconds versus minutes to hours, respectively).
Prior studies utilizing IM-MS have focused on the characterization of different biomolecular classes and structural interpretation via computational strategies, for example, in the analyses of carbon clusters [12, 13], polymers [14], peptides [15], proteins [16, 17], carbohydrates [18], and oligonucleotides. [19, 20]. IM-MS has more recently been used for the characterization of massive protein complexes [21], imaging directly from thin tissue sections [22, 23], and performing comprehensive proteomics through combining LC-ESI-IM-MS [24–26]. Importantly, because IM-MS provides separations on the basis of structure, different biomolecular classes can be readily distinguished based on differences in their gas-phase packing efficiencies: lipids<peptides<carbohydrates< nucleotides [11]. In the analysis of complex samples, this results in the separation of chemical noise from the analytes of interest, e.g., the separation of isobaric non-peptidic signals from peptides in proteomics, which results in enhanced signal-to-noise for peptide signals and higher confidence level protein identification. However, this also affords the possibility of performing simultaneous omics or combining the characterization of carbohydrates (i.e., glycomics), peptides (i.e., proteomics), lipids (i.e., lipidomics), etc., into a single analysis.
This report focuses on quantifying the conformation space or structure versus mass space occupied by different biomolecular classes. This was explored by characterizing the conformation space occupied by a suite of biologically relevant species corresponding to oligonucleotides, carbohydrates, lipids, and peptides. A statistical treatment of the data delineates where specific signals are predicted to occur and the breadth of where signals are expected about the specific structure versus mass correlation. To illustrate the information contained in the fine structure of these correlations, an example of using structural data combined with molecular dynamics simulations is provided for isobaric oligonucleotide tetramers.
Experimental
Structural separations by ion mobility
Ion mobility rapidly separates ions on the basis of ion-neutral collision cross section, which in turn is related to the structure of the ion as detailed elsewhere [7–11]. Briefly in this work, ions were produced by matrix-assisted laser desorption/ionization (MALDI) and then introduced into the ion mobility drift cell (13.9 cm) at room temperature (ca. 293 K). It should be noted that MALDI is performed at the pressure of the drift cell, which results in ion collisional cooling and reduced fragmentation in comparison with contemporary high vacuum MALDI. The ions migrate across the drift cell under the influence of a weak electrostatic field (ca. 20–30 V cm−1 Torr−1). As the ions migrate, they are impeded by collisions with a neutral helium drift gas maintained at ca. 4 Torr. Larger ions experience more collisions than smaller ions, which results in a slower velocity through the cell. The time it takes an ion to traverse the drift cell, td, is used to calculate the reduced mobility or rate of migration, K0, at STP by using the equation:
| (1) |
where L is the length of the drift cell, E is the electrostatic field strength, and p and T are the pressure and temperature, respectively.
Assuming hard sphere collisions, the ion-neutral collision cross section or apparent surface area, Ω (Å2), can be calculated from the kinetic theory of gases:
| (2) |
where z is the charge state of the ion, e is elementary charge, mi and mn are the masses of the ion and the neutral drift gas, respectively, and N0 is the gas number density at STP [27]. Following the drift cell, ions are directed into an orthogonal time-of-flight mass spectrometer (TOFMS), where many TOFMS spectra are obtained over the elution profile of the IM separation. Details of the data acquisition strategy used to generate 2D plots of conformation space are analogous to those described elsewhere [10].
Samples and preparation
Oligonucleotides
All oligonucleotide standards, matrix (2,4,6-trihydroxyacetophenone, THAP), and ammonium citrate were purchased from Sigma (St. Louis, MO, USA) and used without further purification. Oligonucleotide standards (1μM, see ESI Table S1 for individual sample details) were initially dissolved in distilled deionized (DDI) water (18 MΩ cm, Millipore). Matrix solutions were prepared fresh daily by mixing 50 mg/mL THAP and 50 mg/mL ammonium citrate at a 9:1 ratio (v/v) in DDI. Samples were then prepared for MALDI by mixing 10 μL (10 nmol) of oligonucleotide solution with 30 μL (10,000 nmol) matrix solution. An aliquot of 3 μL of the mixture was then spotted onto a MALDI plate and vacuum-dried prior to MALDI-IM-MS analysis.
Carbohydrates
Lacto-N-fucopentaoses (LNFP) 1 and LNFP2 from human milk were obtained from Dextra Laboratories (Reading, UK); LNFP3, LNFP5, Lacto-N-difucohexaose (LNDFH) 1, and LNDFH2 were obtained from V Labs (Covington, LA, USA). Synthetic glycans, Gala3-type1, P1, H-type2-LN-LN, P1 antigen-sp, Di-LeA, P1 penta, LNT, Lec-Lec, Tri-LacNAc, GNLNLN, and 3′SLN-Lec were obtained through the Carbohydrate Synthesis/Protein Expression Core of The Consortium for Functional Glycomics. 2,5-Dihydroxybenzoic acid (DHB), NaCl, and all other reagents were purchased from Sigma and used without further purification. The matrix used for MALDI-IM-TOFMS was saturated DHB in 50% ethanol. The matrix and analyte were combined in a 1:1 volume ratio (or 200:1 molar ratio). NaCl was added to make a final concentration of 0.1% for purposes of converting all signals to those corresponding to sodium-coordinated ions. The samples were prepared using the dried droplet method [28].
Lipids
Five lipid extracts in powder form, two sphingolipids—sphingomyelins (porcine brain) and cerebrosides (porcine brain)—and three phospholipids—phosphatidyl-cholines (chicken egg), phosphatidylserines (porcine brain), and phosphatidylethanolamines (chicken egg)—were obtained from Avanti Lipids (Birmingham, AL, USA; see ESI Table S1 for individual sample details). Each of these extracts were individually dissolved in a 2:1 v/v CHCl3/MeOH mixture to yield 2 mM solutions. DHB was dissolved in 50% ethanol to yield a 200 mM solution. The individual lipid extracts were premixed with DHB matrix solution in a 1:10 ratio (v/v) and manually spotted onto a 100-well steel MALDI plate and flash-evaporated under vacuum [28]. Identification of lipid species was aided by information available from Avanti Lipids [29], the LIPIDMAPS database [30], and previously published identification of MALDI lipid spectra [31].
Instrumentation
MALDI-IM-TOFMS measurements were performed with MALDI ionization at the pressure of the drift cell (3.8 Torr) with a frequency-tripled Nd-YLF (349 nm) laser (Explorer, Newport/Spectra-Physics, Mountain View, CA, USA). Once the ionized species traversed the He filled drift cell under the influence of a weak electric field, they were guided by ion optics into the low-pressure region of a TOFMS. Two-dimensional spectra (arrival time versus m/z) of each sample were analyzed and compared using custom visualization software (Ionwerks, Houston, TX, USA) developed on the IDL platform (ITT Visual Information Solutions, Boulder, CO, USA). Mass calibration of the instrument was performed externally using a mixture of C60 and C70. Although not the subject of the present work, the utility of structurally based internal standards is illustrated through the use of carbon clusters [10], where signals regularly occur every 24 Da (corresponding to two carbon atoms) are observed, but in regions of conformation space distinctly removed from those of biologically relevant species.
To confirm the identities of various signals, a MALDI–TOFMS (Voyager DE-STR, Applied Biosystems, Foster City, CA, USA) operated in reflectron mode and a MALDI–TOF/TOFMS (Ultraflex III, Bruker Daltonics, Billerica, MA, USA) operated in reflectron mode with a Smartbeam frequency-tripled Nd-YLF (349 nm) 200 Hz laser were used to obtain high mass accuracy parent ion signals and MS/MS fragmentation data, respectively.
Molecular dynamics simulations
Computer structures of oligonucleotide tetramers were built in LEaP, from the Amber 9.0 [32] suite of programs. Quantum mechanical (QM) minimization and electrostatic potential calculations were performed using Gaussian 2003 [33]. Electrostatic potential output results of the QM minimized structures were used for atom point-charge parameterization using the restrained electrostatic potential algorithm [34]. Molecular dynamics were further performed in Sander (Amber 9.0). Protonated phosphate parameters not available in Amber 9.0 were derived using the molecular dynamics parameters published by Cornell et al. [35]. Mobcal [12, 13] was utilized to determine the collision cross section of oligonucleotide structures generated from molecular dynamics runs. The energy information obtained from molecular dynamics and the collision cross-section information produced by Mobcal were combined, and low-energy structures whose collision cross section matched the experimental value were chosen for cluster analysis. Superposition and clustering programs available and partially developed at the Vanderbilt Center for Structural Biology were used to separate structures into clusters based on conformational similarity [36, 37].
Results and discussion
Studies to date have predominately focused on the utility of IM-MS analyses of isolated molecular classes, such as those encountered in proteomics [38–42], glycomics [43], and metabolomics [44]. The aim of this work is combining such studies in a common platform for performing integrated omics research. Prior research using IM-MS for the structural characterization of oligonucleotides and DNA involved the studies of short single stranded (ss) oligonucleotides [20, 45], short DNA duplexes and helix stability [46, 47], DNA–metal coordination [48], and of the thermodynamics of G-quadruplex formation [49–52]. For carbohydrates, initial studies examined linear oligosaccharides and cyclodextrins to compare gas-phase collision cross sections to those obtained from molecular dynamics simulations [18]. Subsequent investigations have focused on determining stereochemical information for monomeric or small di- and trisaccharide structures [53–58] and, more recently, on investigating the utility of IM-MS in glyco-proteomic studies of urinomics and serum, respectively [43, 59]. However, the preponderance of biological IM-MS research has focused on the study of peptide and protein ion structure [14–17, 38–42]. For example, research has centered on the characterization of peptide and protein misfolding diseases, such as those implicated in Alzheimer’s and Parkinson’s diseases [60–62]. Furthermore, IM-MS studies on the retention of peptide secondary structure [7–9, 63] and characterization of peptide post-translational modifications [10, 64, 65] have been described. Relatedly, lipids have been characterized through the use of profiling and imaging IM-MS of brain lipids (human and rat) [22, 23, 66] and have been shown to have the least gas-phase packing efficiency of all previously studied biomolecules, allowing reliable separation of their signals from peptides and other biomolecular signals [67].
In accumulating a wide collection of the collision cross section versus m/z values for these isolated class systems, it has been observed that each individual biomolecular class, such as oligonucleotides, carbohydrates, peptides, and lipids, occupy a distinct region in the two-dimensional IM-MS plot also referred to as conformation space (i.e., arrival time distribution versus m/z). Understanding the positions and spread of these specific regions should give insights to predictive capabilities that would be utilized for rapid molecular class identification of an unknown signal depending on its position in conformation space. Towards this aim, we have generated a large dataset (ca. 100, 200, and 60 for oligonucleotides, carbohydrates, and lipids, respectively) of the collision cross sections obtained for singly charged species of standard materials in each molecular class. These data were then combined with previously reported values for singly charged peptide species (ca. 600) [68]. A summary of this data is illustrated in Fig. 1. Complementary to previous reports for a limited number of analytes [11, 67], the different molecular classes clearly occupy different regions of conformation space over the m/z range of 200 to 2,000, which is commensurate with what is typically measured in omics experiments. The relative collision cross sections at a particular m/z increase in the order of oligonucleotides<carbohydrates<peptides< lipids. The positions where particular signals occur depend on the prevailing intramolecular folding forces for the particular molecular class. The distinct separation of signals therefore indicates that the average packing density or gas-phase packing efficiency differs for each class. It is important to recognize that for a specific average density, surface area (i.e., collision cross section) scales as length-squared and mass scales as length-cubed. At the limit of high mass, the incremental increase in collision cross section resulting from further increase in mass should approach zero at a decreasing rate. Mathematically, this behavior is best modeled and approximated with collision cross section as a logarithmic function of m/z. The average correlation for each dataset is shown in Fig. 1b for clarity. Representative arrival time distribution IM-MS spectra obtained for model species of all four classes is shown in Fig. 1c.
Fig. 1.

a A plot of collision cross section as a function of m/z for different biologically relevant molecular classes, including oligonucleotides (n=96), carbohydrates (n=192), peptides (n=610), and lipids (n=53). All species correspond to singly charged ions generated by MALDI, where error ±1σ is generally within the data point. Values for peptides species are obtained from a previous study (see Electronic Supplementary Information Table S1 for numerical data) [68]. b A plot of the average collision cross section versus m/z fitted to logarithmic regressions for the data corresponding to each molecular class. The specific equations for each class are as follows: oligonucleotides y=107.45 ln(x)−535.34 (R2=0.96), peptides y=197.4 ln(x)−1,109.8 (R2=0.96), carbohydrates y=103.7 ln(x)−507.22 (R2=0.83), and lipids y=164.59 ln(x)−871.44 (R2=0.70), respectively. c A plot of MALDI-IM-MS conformation space obtained for a mixture of model species representing each molecular class (ranging from seven to 17 model species for each class, spanning a range of masses up to 1,500 Da). Dashed lines are for visualization purposes of where each molecular class occurs in conformation space. Signals in the vicinity of the asterisk arise from limited post-IM fragmentation of the parent ion species
The distribution of cross-section values about each of the average correlations is presented in Fig. 2. Previous studies examining the peak capacity of conformation space for peptides (separated in He) exhibited a residual deviation from a linear regression with ±1σ of ca. 2.5% [69]. In contrast, residuals from a logarithmic regression of ca. 600 peptide signals used in this work resulted in a relative deviation of 7.33% (±1σ). A similar treatment of oligonucleotide, carbohydrate, and lipid signals resulted in deviations of 3.70%, 8.81%, and 2.64%, respectively. A relative ordering of these classes on the basis of increasing breadth of conformation space occupied is, therefore, lipids< oligonucleotides<peptides<carbohydrates. To rationalize the gross separation of these molecular classes, a basic examination of the compositional nature of each species is likely sufficient. For example, the narrowness of the lipid distribution may arise from the limited size of the dataset; however, the structural simplicity of the lipids examined (i.e., all possessing two relatively larger fatty acid moieties and a relatively smaller head group) naturally limits the distinct structural forms that the samples are able to adopt. Likewise, the narrowness of oligonucleotide conformation space can be attributed to these molecules being comprised of a linear polymer with the potential ordering of a limited number (four) of monomeric units. In contrast, peptides and carbohydrates have potentially higher structural diversity arising from the larger number of monomeric units and the potential for significant branching. However, from a fundamental biophysical perspective, it is well understood that the prevailing intramolecular folding forces is what dictates the structural diversity observed for specific species (i.e., relative deviations within a specific class). Therefore, to better understand the structural diversities of a particular molecular class, in-depth molecular modeling studies to complement these data must be performed to assess the relative magnitude of the prevailing folding forces (e.g., van der Waals interactions, hydrogen bonding, π– π interactions, etc.), which are likely quite different both among and within classes, depending on the chemical composition of the molecule.
Fig. 2.

Residual plots of each molecular class for the data shown in Fig. 1a and about the logarithmic regressions provided in Fig. 1b. These plots illustrate the percent relative deviation (±) for all of the species reported. The abscissa axis is ordered by descending values of percent relative deviation. The calculated values of σ indicated in each of the plots are a 3.70, b 8.81, c 7.33, and d 2.64, respectively
Figure 3 illustrates the residuals from each of the regressions grouped as histograms to evaluate the distribution profiles. The two species with the smallest number of samples, oligonucleotides and lipids, appear to have more Gaussian distributions and exhibit the narrowest profiles. Conversely, the broadest profiles are observed for peptides and carbohydrates. Carbohydrates exhibit a larger number of signals of low collision cross section at small m/z values (i.e., 300–800 Da), which result in weighting of a larger number of signals with relatively large negative deviations. Similarly, there is a weighting bias for positive relative deviations in the distribution profile of peptides, i.e., a greater number of peptides occur above the regression line in the lower m/z range (300–700 Da). Thus, although theoretically a logarithmic regression is most appropriate, it overestimates the relative frequency of signals positively deviating from the average correlation for signals in the low m/z range. Fitting of this data to a polynomial expression results in more Gaussian histograms, but fails to capture the theoretical limit of surface area with increasing mass.
Fig. 3.

Histogram plots of the appearance frequency of analyte signals as a function of the percent relative deviation from the logarithmic regressions for each molecular class provided in Fig. 1
Although this data describes the regions of conformation space occupied for the molecular classes presented, caution should be exercised when applying this treatment to biomolecular signals outside the mass range presented. The regression lines are derived only for the range of m/z investigated. Thus, correlations presented can only be extrapolated beyond the limits of this study (<~2 kDa) with caution. Currently, there is a lack of experimental data for the transition region from peptides to well-ordered protein complexes (from 3 kDa<m/z<200 kDa). Therefore, the difference between, for example, peptides (<3 kDam/z) and well-ordered massive protein complexes (>200 kDam/z) has yet to be characterized. It is unclear at this juncture how conformation space appears in this transition region.
Nevertheless, the correlations presented for each molecular class in Figs. 1, 2, 3 provide a guide to characterize unknown signals in the analysis of complex biological samples. Although the histograms in Fig. 3 suggest approximately normal distributions of signals centered about the average correlation, it is important to recognize that specific structural deviations within each class (e.g., retained secondary structure in peptides [7–9, 63], branching ratio and glycosidic linkage variation in carbohydrates [43, 44], backbone and headgroup differences in lipids, etc.) give rise to complex probability distribution profiles. For example, there exist many examples of using IM-MS for separations of isomeric and/or isobaric species. To illustrate the complexity that can arise in the probability distribution profiles, Fig. 4 shows the separation of two oligonucleotides composed of the same four bases, but of permuted sequence (i.e., CGAT and TGCA). Although the ion species are isobaric, they are nearly baseline resolved on the basis of structure in the collision cross-section profile (Fig. 4a). As indicated in Fig. 4b, the average structures that these individual species preferentially adopt are strikingly different, i.e., CGAT adopts a more compact structure dominated by base-stacking, while the structure for TGCA is more extended with extensive hydrogen bonding. Thus, although this study delineates the expected region in which particular signals are predicted to occur, fine structure within these correlations provides a further level of information that can be used. Studies aimed at elucidating specific compositional motifs that give rise to distinct fine structure in conformation space are presently underway in our laboratories.
Fig. 4.
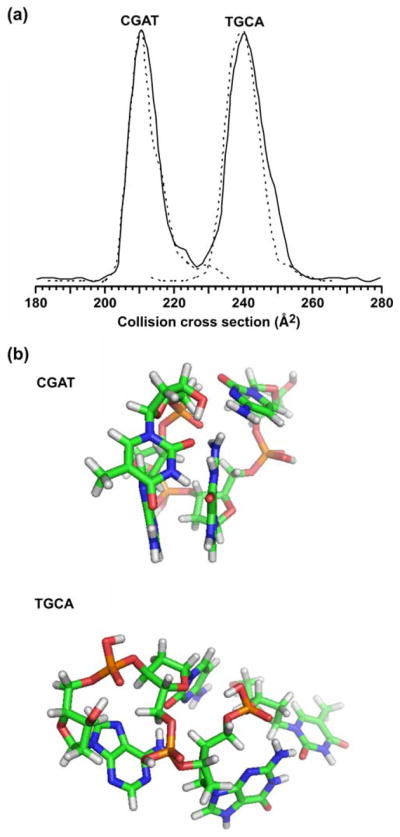
a A plot of the collision cross-section profile obtained in the separation of a mixture of two isobaric tetranucleotide species, CGAT and TGCA, respectively ([M+H]+=1,174.3). The solid line corresponds to a mixture of the two components. Dashed lines correspond to collision cross-section profiles obtained for each ssDNA species analyzed separately with signal intensity normalized to the height of the major feature in the profile for the mixture. b Molecular dynamics simulations for each of the two ssDNA species. For each species, ca. 21,000 structures were obtained that resulted in 666 and 1,405 low-energy structures that correspond to within ±2.5 Å2 of the measured collision cross section for CGAT and TGCA, respectively. Following an RMS analysis of these low-energy structures, the most representative structure is shown
Conclusions
The data presented in this report allow for a broad view of the conformational landscape for different classes of biomolecules. This provides a general metric for assigning signals to particular molecular classes based on where the unknown signals occur in conformation space. Further understanding of the fine structures within conformation space might be achieved through utilizing computational strategies, such as molecular dynamics, to predict where sub-class populations would appear. These sub-class separations could be due to post-translational modifications to peptides, retained secondary structure, preferential folding owing to metal coordination, etc. The characterization of conformation space for complex biological samples opens new avenues for life sciences research, such as rapid and integrated omics analysis necessary for the advancement of fields such as systems biology.
Supplementary Material
Acknowledgments
Financial support for this work was provided by the National Institutes of Health (via NIDA subcontracts HHSN271200800020C, HHSN271200700012C and a subcontract via NCRR grant 5R44RR020238-03 with Ionwerks, Inc.), Vanderbilt University College of Arts and Sciences, Vanderbilt Institute of Chemical Biology, the American Society for Mass Spectrometry (Research award to J.A.M), and the Spectroscopy Society of Pittsburgh. The carbohydrate compounds Gala3-type1, P1, H-type2-LN-LN, P1 antigen-sp, Di-LeA, P1 penta, LNT, Lec-Lec, Tri-LacNAc, GNLNLN, and 3′SLN-Lec were provided by the Carbohydrate Synthesis/Protein Expression Core of the Consortium for Functional Glycomics funded by the National Institute of General Medical Sciences grant GM62116.
Biography
 John A. McLean
is presently an Assistant Professor in the Department of Chemistry at Vanderbilt University and a faculty fellow in the Institute of Chemical Biology and Institute of Integrative Biosystems Research and Education. His recent awards include an American Society for Mass Spectrometry Research Award, a Spectroscopy Society of Pittsburgh Award, an R&D 100 Award, and the Bunsen–Kirchhoff Prize from the GDCh. His research interests focus on the design, conceptualization, construction, and application of technologies for structural mass spectrometry, in particular for studies in structural proteomics, systems biology, and biophysics.
Footnotes
Electronic supplementary material The online version of this article (doi:10.1007/s00216-009-2666-3) contains supplementary material, which is available to authorized users.
References
- 1.Hood L, Heath JR, Phelps ME, Lin B. Science. 2004;306:640–643. doi: 10.1126/science.1104635. [DOI] [PubMed] [Google Scholar]
- 2.Van Regenmortel MHV. EMBO Reports. 2004;5:1016–1020. doi: 10.1038/sj.embor.7400284. [DOI] [PMC free article] [PubMed] [Google Scholar]
- 3.Huang S, Wikswo J. Rev Physiol Biochem Pharma. 2007;157:81–104. doi: 10.1007/112_0602. [DOI] [PubMed] [Google Scholar]
- 4.Peterson R. Nature Chemical Biology. 2008;4:635–638. doi: 10.1038/nchembio1108-635. [DOI] [PubMed] [Google Scholar]
- 5.Simon GM, Cravatt BF. Nature Chemical Biology. 2008;4:639–642. doi: 10.1038/nchembio1108-639. [DOI] [PubMed] [Google Scholar]
- 6.Harvey DJ. Proteomics. 2001;1:311–328. doi: 10.1002/1615-9861(200102)1:2<311::AID-PROT311>3.0.CO;2-J. [DOI] [PubMed] [Google Scholar]
- 7.Hoaglund-Hyzer CS, Counterman AE, Clemmer DE. Chem Rev. 1999;99:3037–3079. doi: 10.1021/cr980139g. [DOI] [PubMed] [Google Scholar]
- 8.Jarrold MF. Annu Rev Phys Chem. 2000;51:179–207. doi: 10.1146/annurev.physchem.51.1.179. [DOI] [PubMed] [Google Scholar]
- 9.Wyttenbach T, Bowers MT. Top Curr Chem. 2003;225:207–232. [Google Scholar]
- 10.McLean JA, Ruotolo BT, Gillig KJ, Russell DH. Int J Mass Spectrom. 2005;240:301–315. [Google Scholar]
- 11.Fenn LS, McLean JA. Anal Bioanal Chem. 2008;391:905–909. doi: 10.1007/s00216-008-1951-x. [DOI] [PubMed] [Google Scholar]
- 12.Mesleh MF, Hunter JM, Shvartsburg AA, Schatz GC, Jarrold MF. J Phys Chem. 1996;100:16082–16086. [Google Scholar]
- 13.Shvartsburg AA, Jarrold MF. Chem Phys Lett. 1996;261:86–91. [Google Scholar]
- 14.Von Helden G, Wyttenbach T, Bowers MT. Science. 1995;267:1483–1485. doi: 10.1126/science.267.5203.1483. [DOI] [PubMed] [Google Scholar]
- 15.Wyttenbach T, von Helden G, Bowers MT. J Am Chem Soc. 1996;118:8355–8364. [Google Scholar]
- 16.Clemmer DE, Hudgins RR, Jarrold MF. J Am Chem Soc. 1995;117:10141–10142. [Google Scholar]
- 17.Mao Y, Ratner MA, Jarrold MF. J Am Chem Soc. 2000;122:2950–2951. doi: 10.1021/ja0030717. [DOI] [PubMed] [Google Scholar]
- 18.Lee S, Wyttenbach T, Bowers MT. Int J Mass Spectrom Ion Processes. 1997;167/168:605–614. [Google Scholar]
- 19.Gidden J, Bushnell JE, Bowers MT. J Am Chem Soc. 2001;123:5610–5611. doi: 10.1021/ja015940d. [DOI] [PubMed] [Google Scholar]
- 20.Koomen JM, Ruotolo BT, Gillig KJ, McLean JA, Russell DH, Kang M, Dunbar KR, Fuhrer K, Gonin M, Schultz JA. Anal Bioanal Chem. 2002;373:612–617. doi: 10.1007/s00216-002-1363-2. [DOI] [PubMed] [Google Scholar]
- 21.Ruotolo BT, Giles K, Campuzano I, Sandercock AM, Bateman RH, Robinson CV. Science. 2005;310:1658–1661. doi: 10.1126/science.1120177. [DOI] [PubMed] [Google Scholar]
- 22.Jackson SN, Ugarov M, Egan T, Post JD, Langlais D, Schultz JA, Woods AS. J Mass Spectrom. 2007;42:1093–1098. doi: 10.1002/jms.1245. [DOI] [PMC free article] [PubMed] [Google Scholar]
- 23.McLean JA, Ridenour WB, Caprioli RM. J Mass Spectrom. 2007;42:1099–1105. doi: 10.1002/jms.1254. [DOI] [PubMed] [Google Scholar]
- 24.Liu X, Plasencia M, Ragg S, Valentine SJ, Clemmer DE. Brief Funct Genomic Proteomic. 2004;3:177–186. doi: 10.1093/bfgp/3.2.177. [DOI] [PubMed] [Google Scholar]
- 25.Valentine SJ, Plasencia MD, Liu X, Krishnan M, Naylor S, Udseth HR, Smith RD, Clemmer DE. J Proteome Res. 2006;5:2977–2984. doi: 10.1021/pr060232i. [DOI] [PubMed] [Google Scholar]
- 26.Liu X, Valentine SJ, Plasencia MD, Trimpin S, Naylor S, Clemmer DE. J Am Soc Mass Spectrom. 2007;18:1249–1264. doi: 10.1016/j.jasms.2007.04.012. [DOI] [PMC free article] [PubMed] [Google Scholar]
- 27.Mason EA, McDaniel EW. Transport Properties of Ions in Gases. Wiley; New York: 1988. [Google Scholar]
- 28.Karas M, Hillenkamp F. Anal Chem. 1988;60:2299–2301. doi: 10.1021/ac00171a028. [DOI] [PubMed] [Google Scholar]
- 29.Avanti Polar Lips, Inc. http://www.avantilipids.com/
- 30.Sud M, Fahy E, Cotter D, Brown A, Dennis EA, Glass CK, Merrill AH, Jr, Murphy RC, Raetz CR, Russell DW, Subramaniam S. Nucleic Acids Res. 2007;35:D527–D532. doi: 10.1093/nar/gkl838. [DOI] [PMC free article] [PubMed] [Google Scholar]
- 31.Jackson SN, Wang H-YJ, Woods AS. J Am Soc Mass Spectrom. 2006;18:17–26. doi: 10.1016/j.jasms.2006.08.015. [DOI] [PubMed] [Google Scholar]
- 32.Case DA, Cheatham TE, III, Darden T, Gohlke H, Luo R, Merz KM, Jr, Onufriev A, Simmerling C, Wang B, Woods RJ. Computat Chem. 2005;26:1668–1688. doi: 10.1002/jcc.20290. [DOI] [PMC free article] [PubMed] [Google Scholar]
- 33.Frisch MJ, Trucks GW, Schlegel HB, Scuseria GE, Robb MA, Cheeseman JR, Montgomery JA, Jr, Vreven T, Kudin KN, Burant JC, Millam JM, Iyengar SS, Tomasi J, Barone V, Mennucci B, Cossi M, Scalmani G, Rega N, Petersson GA, Nakatsuji H, Hada M, Ehara M, Toyota K, Fukuda R, Hasegawa J, Ishida M, Nakajima T, Honda Y, Kitao O, Nakai H, Klene M, Li X, Knox JE, Hratchian HP, Cross JB, Bakken V, Adamo C, Jaramillo J, Gomperts R, Stratmann RE, Yazyev O, Austin AJ, Cammi R, Pomelli C, Ochterski JW, Ayala PY, Morokuma K, Voth GA, Salvador P, Dannenberg JJ, Zakrzewski VG, Dapprich S, Daniels AD, Strain MC, Farkas O, Malick DK, Rabuck AD, Raghavachari K, Foresman JB, Ortiz JV, Cui Q, Baboul AG, Clifford S, Cioslowski J, Stefanov BB, Liu G, Liashenko A, Piskorz P, Komaromi I, Martin RL, Fox DJ, Keith T, Al-Laham MA, Peng CY, Nanayakkara A, Challacombe M, Gill PMW, Johnson B, Chen W, Wong MW, Gonzalez C, Pople JA. Gaussian 03, Revision D.01. Gaussian, Inc; Wallingford CT: 2004. [Google Scholar]
- 34.Bayly CI, Cieplak P, Cornell WD, Kollman PA. J Phys Chem. 1993;97:10269–10280. [Google Scholar]
- 35.Cornell WD, Cieplak P, Bayly CI, Gould IR, Merz KM, Jr, Ferguson DM, Spellmeyer DC, Fox T, Caldwell JW, Kollman PA. J Am Chem Soc. 1995;117:5179–5197. [Google Scholar]
- 36.Smith J. Suppose—superposition software. Vanderbilt University; 2006. [Google Scholar]
- 37.Barton GJ. OC—A cluster analysis program. University of Dundee; Scotland, UK: 1993 2002. www.compbio.dundee.ac.uk/downloads/oc. [Google Scholar]
- 38.Woods AS, Koomen JM, Ruotolo BT, Gillig KJ, Russell DH, Fuhrer K, Gonin M, Egan TF, Schultz JA. J Am Soc Mass Spectrom. 2002;13:166–169. doi: 10.1016/S1044-0305(01)00348-8. [DOI] [PubMed] [Google Scholar]
- 39.Ruotolo BT, Gillig KJ, Stone EG, Russell DH, Fuhrer K, Gonin M, Schultz JA. Int J Mass Spectrom. 2002;219:253–267. [Google Scholar]
- 40.Merenbloom SI, Koeniger SL, Valentine SJ, Plasencia MD, Clemmer DE. Anal Chem. 2006;78:2802–2809. doi: 10.1021/ac052208e. [DOI] [PubMed] [Google Scholar]
- 41.Myung S, Wiseman JM, Valentine SJ, Takats Z, Cooks RG, Clemmer DE. J Phys Chem B. 2006;110:5045–5051. doi: 10.1021/jp052663e. [DOI] [PubMed] [Google Scholar]
- 42.Valentine SJ, Plansencia MD, Liu X, Krishnan M, Naylor S, Udseth HR, Smith RD, Clemmer DE. J Prot Res. 2006;5:2977–2984. doi: 10.1021/pr060232i. [DOI] [PubMed] [Google Scholar]
- 43.Isailovic D, Kurulugama RT, Plasencia MD, Stokes ST, Kyselova Z, Goldman R, Mechref Y, Novotny MV, Clemmer DE. J Prot Res. 2008;7:1109–1117. doi: 10.1021/pr700702r. [DOI] [PMC free article] [PubMed] [Google Scholar]
- 44.Dwivedi P, Wu C, Matz LM, Clowers BH, Siems WF, Hill HH., Jr Anal Chem. 2006;78:8200–8206. doi: 10.1021/ac0608772. [DOI] [PMC free article] [PubMed] [Google Scholar]
- 45.Gidden J, Bowers MT. J Am Soc Mass Spectrom. 2003;14:161–170. doi: 10.1016/S1044-0305(02)00866-8. [DOI] [PubMed] [Google Scholar]
- 46.Gidden J, Ferzoco A, Baker ES, Bowers MT. J Am Chem Soc. 2004;126:15132–15140. doi: 10.1021/ja046433+. [DOI] [PubMed] [Google Scholar]
- 47.Baker ES, Bowers MT. J Am Soc Mass Spectrom. 2007;18:1188–1195. doi: 10.1016/j.jasms.2007.03.001. [DOI] [PubMed] [Google Scholar]
- 48.Baker ES, Manard MJ, Gidden J, Bowers MT. J Phys Chem B. 2005;109:4808–4810. doi: 10.1021/jp0501190. [DOI] [PubMed] [Google Scholar]
- 49.Gabelica V, Baker ES, Teulade-Fichou M-P, De Pauw E, Bowers MT. J Am Chem Soc. 2007;129:895–904. doi: 10.1021/ja065989p. [DOI] [PubMed] [Google Scholar]
- 50.Baker ES, Berstein SL, Gabelica V, De Pauw E, Bowers MT. Int J Mass Spectrom. 2006;253:225–237. [Google Scholar]
- 51.Baker ES, Lee JT, Sessler JL, Bowers MT. J Am Chem Soc. 2006;128:2641–2648. doi: 10.1021/ja0564968. [DOI] [PMC free article] [PubMed] [Google Scholar]
- 52.Baker ES, Bernstein SL, Bowers MT. J Am Soc Mass Spectrom. 2005;16:989–997. doi: 10.1016/j.jasms.2005.03.012. [DOI] [PubMed] [Google Scholar]
- 53.Dwivedi P, Bendiak B, Clowers BH, Hill HH. J Am Soc Mass Spectrom. 2007;18:1163–1175. doi: 10.1016/j.jasms.2007.04.007. [DOI] [PubMed] [Google Scholar]
- 54.Leavell MD, Gaucher SP, Leary JA, Taraszka JA, Clemmer DE. J Am Soc Mass Spectrom. 2005;13:284–293. doi: 10.1016/S1044-0305(01)00362-2. [DOI] [PubMed] [Google Scholar]
- 55.Clowers BH, Dwivedi P, Steiner WE, Hill HH, Jr, Bendiak B. J Am Soc Mass Spectrom. 2005;16:660–669. doi: 10.1016/j.jasms.2005.01.010. [DOI] [PubMed] [Google Scholar]
- 56.Lee D-S, Wu C, Hill HH., Jr J Chromatogr A. 1998;822:1–9. [Google Scholar]
- 57.Liu Y, Clemmer DE. Anal Chem. 1997;69:2504–2509. doi: 10.1021/ac9701344. [DOI] [PubMed] [Google Scholar]
- 58.Gabryelski W, Froese KL. J Am Soc Mass Spectrom. 2003;14:265–277. doi: 10.1016/S1044-0305(03)00002-3. [DOI] [PubMed] [Google Scholar]
- 59.Vakhrushev SY, Langridge J, Campuzano I, Hughes C, Peter-Katalinic J. Anal Chem. 2008;80:2506–2513. doi: 10.1021/ac7023443. [DOI] [PubMed] [Google Scholar]
- 60.Thalassinos K, Slade SE, Jennings KR, Scrivens JH, Giles K, Wildgoos J, Hoyes J, Bateman RH, Bowers MT. Int J Mass Spectrom. 2004;236:55–63. [Google Scholar]
- 61.Baumketner A, Bernstein SL, Wyttenbach T, Bitan G, Teplow DB, Bowers MT. Shea J Protein Sci. 2006;3:420–428. doi: 10.1110/ps.051762406. [DOI] [PMC free article] [PubMed] [Google Scholar]
- 62.Bernstein SL, Liu D, Wyttenbach T, Bowers MT. J Am Soc Mass Spectrom. 2004;15:1435–1443. doi: 10.1016/j.jasms.2004.08.003. [DOI] [PubMed] [Google Scholar]
- 63.Barran PE, Polfer NC, Campopiano DJ, Clarke DJ, Langridge-Smith PRR, Langley RJ, Govan JRW, Maxwell A, Dorin JR, Millar RP, Bowers MT. Int J Mass Spectrom. 2005;240:273–284. [Google Scholar]
- 64.Ruotolo BT, Gillig KJ, Woods AS, Egan TF, Ugarov MV, Schultz JA, Russell DH. Anal Chem. 2004;76:6727–6733. doi: 10.1021/ac0498009. [DOI] [PubMed] [Google Scholar]
- 65.Ruotolo BT, Verbeck GF, IV, Thomson LM, Woods AS, Gillig KJ, Russell DH. J Prot Res. 2002;1:303–306. doi: 10.1021/pr025516r. [DOI] [PubMed] [Google Scholar]
- 66.Jackson SN, Wang H-YJ, Woods AS, Ugarov M, Egan T, Schultz JA. J Amer Soc Mass Spectrom. 2005;16:133–138. doi: 10.1016/j.jasms.2004.10.002. [DOI] [PubMed] [Google Scholar]
- 67.Woods AS, Ugarov M, Egan T, Koomen J, Gillig KJ, Fuhrer K, Gonin M, Schultz JA. Anal Chem. 2004;76:2187–2195. doi: 10.1021/ac035376k. [DOI] [PubMed] [Google Scholar]
- 68.Lei T, McLean JR, McLean JA, Russell DH. J Am Soc Mass Spectrom. 2007;18:1232–1238. doi: 10.1016/j.jasms.2007.04.003. [DOI] [PubMed] [Google Scholar]
- 69.Ruotolo BT, McLean JA, Gillig KJ, Russell DH. J Mass Spectrom. 2004;39:361–367. doi: 10.1002/jms.592. [DOI] [PubMed] [Google Scholar]
Associated Data
This section collects any data citations, data availability statements, or supplementary materials included in this article.