

Abstract
Objective
To describe a refined technique for performing electrical impedance myography (EIM) in the rat and assess its reproducibility, long-term stability, and the effects of sciatic nerve injury.
Methods
EIM at 50 kHz was performed on the gastrocnemius-soleus complex of the rat hind limb in 12 rats, followed from 6 weeks of age for up to 6 months. Eight additional rats underwent sciatic nerve crush and 6 underwent a sham procedure.
Results
The EIM variables of resistance, reactance and phase demonstrated substantial change with growth until approximately 14 weeks of age, at which point the measurements stabilized, giving mean values of 6.0 ± 5.7 ohms, 22.1 ± 2.1 ohms, and 16.5 ± 1.1°, respectively, at 16 weeks of age. Immediate reproducibility of technique was high with an intraclass correlation coefficient of 0.91 and higher for all three parameters. Sciatic crush produced marked reductions in the reactance and phase that reversed over a several week period.
Conclusions
These results support that 50 kHz EIM can be performed effectively in adult rat models of neuromuscular disease with a straightforward experimental technique and that it is sensitive to neurogenic injury.
Significance
EIM can serve as a new approach to the study of neuromuscular disease in the rat.
Keywords: impedance, myography, neuromuscular disease, rat
Introduction
Electrical Impedance Myography (EIM) is a neurophysiologic technique in which high-frequency, low-intensity electrical current is applied via surface electrodes over a muscle or muscle group of interest and the resulting voltage patterns analyzed. (Shiffman et al., 1999; Rutkove et al., 2002). Unlike conventional neurophysiologic methods, such as needle electromyography or nerve conduction studies, EIM does not rely overtly upon the inherent electrophysiologic activity of the muscle, but rather on changes in the composition and structure of the muscle that accompany neuromuscular disease. Such alterations can be detected when applying EIM to human subjects with a variety of conditions including amyotrophic lateral sclerosis, inflammatory myopathy, and radiculopathy (Rutkove et al., 2005; Tarulli et al., 2005; Rutkove et al., 2007). These changes in the EIM signature can be used to assess neuromuscular disease status and thus to track a disease’s progression or remission, making EIM potentially useful in clinical therapeutic trials or in individual patient care (Rutkove et al., 2005; Tarulli et al., 2005; Rutkove et al., 2007). In addition, by specifically assessing the directionality of current flow through a muscle, EIM can also assist in discriminating neurogenic from myopathic disease (Garmirian et al., 2009). A review article providing a comprehensive background on the technique and its potential applications is also available (Rutkove, 2009).
To date, we have mainly applied the EIM techniques to human subjects. However, it is clear that in order to reach a deeper understanding of the mechanisms underlying electrical impedance change in neuromuscular disorders, it is critical that we begin to apply EIM systematically to animal models of disease. This is especially true since disease heterogeneity in human subjects substantially limits our ability to model effectively the observed impedance data. Moreover, studying animal models also gives us the opportunity to evaluate directly the ways in which EIM data relates to muscle pathology—something that would be difficult to achieve in human subjects. Finally, establishing a straightforward methodology would allow others to utilize EIM in animal studies, for example, as a biomarker or outcome measure in preclinical drug studies. Several years ago we completed a small study assessing the feasibility of these measurements in rats (Nie et al., 2006). In this study, we build upon that earlier work by describing in detail a refined methodology for performing EIM on the rat hind limb, assessing its reproducibility, the effects of growth, and changes observed with sciatic nerve injury and recovery.
Methods
Rats and EIM set up
All animal work was approved by the Institutional Animal Care and Use Committee of the Beth Israel Deaconess Medical Center, Boston, MA. Twelve male Wistar Rats were obtained from Charles River Laboratories, Wilmington, MA with an average initial weight of 137 grams at approximately 6 weeks of age and acclimated for 48 hours after arrival at our animal facility. An additional 14 adult animals were obtained at approximately 14-weeks of age (weight 350gms) for use in the sciatic crush work.
After being induced with isolfurane anesthesia, the animals were positioned as shown in Figure 1 lying atop a heating pad with body temperature maintained at 37°C where they continued to receive isoflurane via face mask. For all the rats, we selected the left hind limb for study. First, the leg was shaved and depilatory cream applied for 3 minutes to remove remaining fur. The rat was placed in a prone position with its left leg stretched at approximately a 45° angle away from its body. The rat was kept in this position by a retractor attached to a piece of cloth with a hole which was slipped through the left hind leg. The foot of this leg was place taped down and we made certain that the rat was out of contact with any electrically conductive materials.
Figure 1.

Rat EIM measurement set-up. The small dot in the center of the electrode array represents the tattoo used as a landmark for repeated positioning of the array.
In order to assure that measurements were being performed as accurately as possible, we measured the distance between the midpoint of the lumbar spine and the beginning of the heel pad of each rat and a tattoo was carefully placed on the leg skin at 2/3 of this distance from the spine, a point close to the center of the muscles. This tattoo acted as a landmark for EIM measurement in subsequent weeks.
Ambu Neuroline 700 surface adhesive Ag-AgCl electrodes (Product # 70010-K/C/12, AMBU Inc., Bethesda, Maryland) were used for this procedure. These electrodes were 18 mm in length and 15 mm in width and have an adhesive conducting gel attached to them. Because of the small size of the hind limb and because these electrodes are intended for human use, it was necessary to reduce their size before they could be effectively used. We designed a 2-blade razor cutter with blade separation distance of 3.5mm, which enabled us to cut the electrodes to exactly the same size every time (using the cutter as a press and hammering it into the electrode). The dimension of the electrodes became 18 mm × 3.5 mm after the cut. Four of these electrodes were placed in a line onto the adhesive surface of medical adhesive tape (3M Micropore, 3M Health Care, St. Paul, Minnesota) with an inter-electrode separation distance of 4 mm, with the inactive side of the electrodes adhering to the tape, essentially creating an adhesive 4-electrode array. As is standard in tetrapolar measurement schemes, the middle two electrodes served as voltage electrodes and the outer two electrodes served as the current-injecting electrodes.
EIM measurement
Experiments were performed over a heating pad with constant measurement of body temperature. Gauze, damp with saline, was then lightly dabbed on the leg skin to clean the area. After waiting 30 seconds for excess saline to evaporate, the four electrode adhesive array was placed along the length of the leg, centered about the tattoo (Figure 1). In this way, the distal current electrode was close to the heel and the proximal current electrode was close to knee-joint. All the electrodes were gently pushed downward to conform to the shape of the leg so as to assure complete contact.
A lock in amplifier, Signal Recovery Model 7280, Advanced Measurement Technology Inc., Oak Ridge, TN was used to supply AC currents from its 1V reference output oscillator and the selected voltage was fed to its input terminal through a high impedance and very low capacitance active probe (Model 1103 of Tektronix, Beaverton, OR) as previously described (Esper et al., 2006). Instrument-interfacing software was written in Visual Basic to calculate resistance and reactance and also display and store the recorded impedance data.
Growth and reproducibility studies
For assessment of immediate reproducibility, the electrode array was detached and the animal was removed from the set-up entirely, picked up and taken over to its cage. The animal was then immediately brought back to the testing area and set-up again with a fresh set of electrodes and the measurements repeated.
After the EIM measurements were completed on any day, weight was obtained and the girth of the leg at the tattoo position on the skin was measured with a tape. Data were collected every week for first two months and then biweekly for the following months.
Sciatic Crush and Sham Crush
In the 8 additional animals, an incision was made proximally in the thigh and the sciatic nerve exposed, being careful not to disturb surrounding tissues. The nerve was then crushed using a jeweler’s forceps by applying pressure for approximately 30 seconds. In addition, in 6 animals (the sham crush animals), the sciatic nerve was briefly exposed but no crush was performed and incision was closed. The animals undergoing crush also had limited needle electromyography (EMG) of the lateral gastrocnemius to assess for the presence of fibrillation potentials in the weeks after the crush and during recovery.
Data Analysis
One-way ANOVAs were performed to assess for differences across time. Reproducibility was assessed by calculation of intraclass correlation coefficients. Mann Whitney U tests were performed to compare the sciatic crush and sham animal cohorts. Group measurements are reported as mean +/− standard error.
Results
Basic Data
Mean +/−SD for resistance, reactance, and phase was 126.5 ± 13.5 ohms, 27.6 ± 5.3 ohms, and 12.2 ± 1.2°, respectively, for the animals at 6 weeks of age. Coefficients of variation for these three parameters were 8.4%, 19.2% and 9.8%, respectively. The identical measures for adult rats (taken near the mid-point of the study at 16 weeks of age) were 76.0 ± 5.7 ohms, 22.1 ± 2.1 ohms, and 16.5 ± 1.1° and coefficients of variation for these three parameters were 7.6%, 9.6% and 7.0% for resistance, reactance and phase, respectively.
Effects of rat growth
Although rats are sexually mature at only 6 or 7 weeks of age and continue to grow throughout their lives, there is marked slowing of growth when animals reach about 350 gms or about 12–14weeks of age. It is at this point that animals are typically used for experimentation since changes related to growth can for the most part be ignored. Thus, we chose to separate our measurements into two phases: those on immature (i.e. 6–14 weeks of age) and then on the mature rats (16 weeks of age and over). Figure 2 shows the weight and girth data for the 12 rats over the entire study period.
Figure 2.
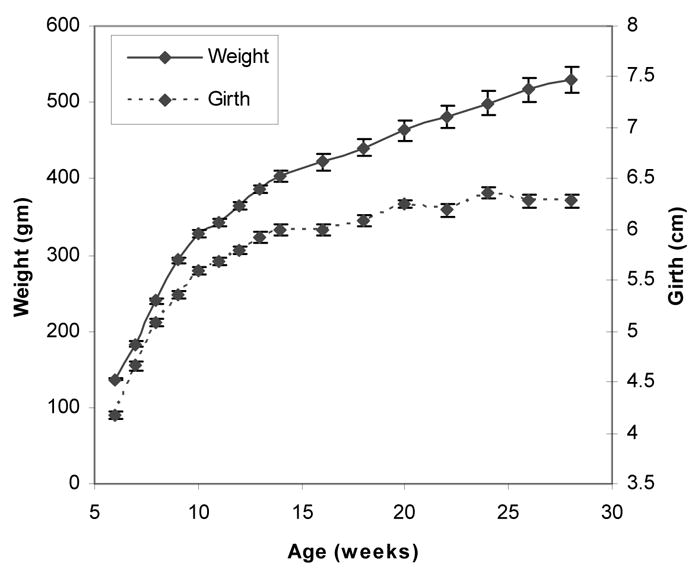
Change of weight and girth at the tattoo position over time.
The average resistance values decreased sharply from 126.5 ohms to 82.8 ohms in the first four weeks of measurements and thereafter decreased at much lower rate reaching 74.6 ohms at the end of fourteenth week (Figure 3(a)). Figure 3(b) shows the change of reactance which also decreased faster in the first few weeks (from 27.6 ohms to 22.9 ohms) of the measurements than the remaining weeks of immaturity. Figure 3(c) shows the calculated phase change. Phase gradually increased (from 12.2° to 16°) with rat growth and became stable after just a few weeks of EIM measurement.
Figure 3.


Resistance (a), reactance (b), and phase (c) data of the rats, from 6 weeks of age onward. Note gradual reduction in reactance and resistance up to approximately 14 weeks of age, followed by excellent stability over the ensuing several months.
Measurements of adult rats
Figure 3(a), 3(b) and 3(c) also provides the resistance, reactance, and phase data respectively over the next several months of study in the adult rats. As can be seen, aside from a very mild reduction in resistance during the first month of study, values remain remarkably consistent for the group as a whole, with mean resistance at 74 ohms, mean reactance at 22 ohms, and mean phase at approximately 17°. One-way ANOVA analysis of all three parameters confirmed that there was no significant difference amongst the time points (p > 0.05), despite the suggestion of a mild decline in resistance during the first month.
Immediate Reproducibility
Figure 4 shows the immediate reproducibility of the resistance, reactance and phase measured at 50 kHz for all 12 adult rats. These data reveal excellent reproducibility with intra-class correlation coefficients of 0.92, 0.95 and 0.91 for resistance, reactance, and phase, respectively.
Figure 4.

Immediate reproducibility of the EIM measurements of resistance (a), reactance (b), and phase (c) for the 12 rats. ICC, intraclass correlation coefficient
Sciatic Crush and Sham Surgery
The 8 adult animals that underwent crush all showed only a subtle elevation in resistance, but a substantial reduction in reactance and the calculated phase, reaching minimum values at approximately 2 weeks after injury (16.6 ±1.19 ohms, and 11.97 ± 1.03°, for reactance and phase, respectively) and than gradually normalizing over time as the animal recovered (Figure 5). These differences for both reactance and phase for the 2 consecutive weeks after the crush were significantly different than those of the sham animals (p < 0.005), and then normalized by the fourth week after injury, mirroring the resolution of all denervating activity on needle electromyography. In comparison, the six animals that underwent sham surgery showed no significant change in their impedance values (Figure 5).
Figure 5.

Resistance (a), reactance (b), and phase (c) data in adult rats undergoing sciatic crush (solid line) and sham surgery (dashed line).
Discussion
These results demonstrate that, using the measurement approach detailed here, once animals reach approximately 350gm or 14 weeks of age the impedance values are remarkably consistent over time. However, during immaturity and the stage of rapid growth, there are major changes in the values of the impedance parameters. The high intraclass coefficients and consistency of measurements in the adult animals supports EIM’s potential as an assessment tool in rat models of neuromuscular disease.
The reductions in resistance and reactance during the growth phase from 6 weeks to about 12 or 14 weeks are to be expected. Increasing girth (as demonstrated in Figure 2) implies a larger muscle volume, resulting in a decreasing resistance and reactance. Still, it is possible that alterations in the intrinsic electrical properties of the muscle itself (i.e. changes in the measured permittivity and conductivity of the tissue) as the animal matures could also contribute to these changes. Separate study of the inherent electrical constants of the tissue is planned. It is also interesting that, despite continued weight gain and some minimal increase in leg girth after 14 weeks, EIM values remained quite stable.
The sciatic crush experiments offer a simple initial measure of the ability of EIM to detect neurogenic injury in the adult rat. In our limited earlier study, we demonstrated a similar change in the EIM data after crush, but we did not perform any sham surgery nor did we follow the time course of deterioration or recovery.(Nie et al., 2006) The changes observed here are consistent with those seen in our human disease work, in which reactance and phase typically decrease, but resistance increases (Rutkove et al., 2002; Rutkove et al., 2007). These changes are likely the result of muscle fiber atrophy. Atrophied muscle fibers have a smaller volume and thus a higher resistance. At the same time, the sarcolemma of individual cells is reduced in size, and thus the membrane’s ability to momentarily store charge is reduced; since capacitance in series adds as the reciprocal of individual capacitances, the overall capacitance of the entire muscle increases; since reactance is inversely proportional to capacitance, the measured reactance decreases. Dedicated histologic studies and mathematical modeling of current flow, however, will be required to assess the validity of these hypotheses.
Our main goal here was in determining EIM’s potential value in assessing neurogenic disease status over time, such as in using EIM to monitor recovery after nerve injury or in drug studies using rodent models of amyotrophic lateral sclerosis We note, however, that the changes observed here in the impedance values should not be interpreted as being specific to neurogenic disease since chronic myopathic disease can also produce reductions in reactance and phase and elevations in resistance (Tarulli et al, 2005). In order to effectively distinguish neurogenic disease from myopathic disease, measurement of the directionality of current flow through the muscle is also necessary, requiring a rotation of the four-electrode array over the muscle. We have performed such measurements successfully in humans (see Garmarian et al, 2009); performing them in the rat will be more difficult given its small size and remains an area of future investigation.
We attempted to devise a methodology that was relatively inexpensive to institute and would still provide repeatable data. Positioning of the animal in a consistent fashion is critical as small variations in the placement of the electrodes or angle of the limb will certainly contribute variation to the data. Although a stereotaxic frame could have been utilized, as is standard in procedures requiring great precision of measurement, such a set-up is costly and inconvenient. Besides positioning, we attempted to reduce all other potential confounding factors by performing measurements as consistently as possible from time to time. This included careful control of temperature, assuring the skin was in an identically hydrated condition when the electrodes were applied (a critical aspect of impedance measurement), and placing the electrode array around the same center point (marked by a tattoo) each time.
Although our goal was to as closely as possible emulate our human studies, given the small size of the animal, by necessity we were required to place the current injecting electrodes in relative close proximity to the voltage electrodes. In much of our previously published work (Rutkove et al., 2005; Tarulli et al., 2005; Aaron et al., 2006; Rutkove et al., 2007) we have placed the current electrodes at a distance from the voltage measuring ones. However, the application of the current electrodes in relatively close proximity to the voltage electrodes in humans subjects may be ultimately useful since it will allow for measurements of muscle anisotropy (not possible with the current electrodes placed a distance)(Garmirian et al., 2009), provide a more specific focus on an individual muscle or muscle group, and eliminate the effects of limb position or joint angle on the acquired data.
It would be helpful to compare these EIM results with other electrophysiologic methods. Motor unit number estimation (MUNE) is perhaps the most appropriate technique with which to compare EIM since both can be used to assess disease status over time. Unfortunately, however, there is no comparable published MUNE data in rats. Still our EIM data are comparable to the data obtained in human subjects where MUNE has shown reproducibility rates in the range of 0.85 to 0.95 and coefficients of variation ranging from 10 to 45% (Shefner, 2001). In the normal mouse, where MUNE has also been studied, although reproducibility specifically has not been reported, the variation amongst the animals appeared very high (Shefner et al., 1999).
In conclusion, EIM can be performed on the rat hind limb using a relatively inexpensive and straightforward measurement set-up. This measurement scheme produces very high reproducibility both for individual adult animals and as a group over time and appears sensitive to neurogenic changes induced by sciatic crush. However, up to approximately 14 weeks of age, impedance parameters change considerably; such changes will need to be taken into account in studies of disease models requiring the use of young animals.
Acknowledgments
This work was funded by grant R01055099 from the National Institutes of Health/National Institute of Neurological Diseases and Stroke. The authors would also like to acknowledge the helpful discussions and input of Drs. Carl Shiffman and Ronald Aaron of Northeastern University.
Footnotes
Publisher's Disclaimer: This is a PDF file of an unedited manuscript that has been accepted for publication. As a service to our customers we are providing this early version of the manuscript. The manuscript will undergo copyediting, typesetting, and review of the resulting proof before it is published in its final citable form. Please note that during the production process errors may be discovered which could affect the content, and all legal disclaimers that apply to the journal pertain.
References
- Aaron R, Esper GJ, Shiffman CA, Bradonjic K, Lee KS, Rutkove SB. Effects of age on muscle as measured by electrical impedance myography. Physiol Meas. 2006;27:953–9. doi: 10.1088/0967-3334/27/10/002. [DOI] [PubMed] [Google Scholar]
- Esper GJ, Shiffman CA, Aaron R, Lee KS, Rutkove SB. Assessing neuromuscular disease with multifrequency electrical impedance myography. Muscle Nerve. 2006;34:595–602. doi: 10.1002/mus.20626. [DOI] [PubMed] [Google Scholar]
- Garmirian LP, Chin AB, Rutkove SB. Discriminating neurogenic from myopathic disease via measurement of muscle anisotropy. Muscle Nerve. 2009;39:16–24. doi: 10.1002/mus.21115. [DOI] [PMC free article] [PubMed] [Google Scholar]
- Nie R, Chin AB, Lee KS, Sunmonu NA, Rutkove SB. Electrical impedance myography: transitioning from human to animal studies. Clin Neurophys. 2006;117:1844–9. doi: 10.1016/j.clinph.2006.03.024. [DOI] [PubMed] [Google Scholar]
- Rutkove SB, Zhang H, Schoenfeld DA, Raynor EM, Shefner JM, Cudkowicz ME, Chin AB, Aaron R, Shiffman CA. Electrical impedance myography to assess outcome in amyotrophic lateral sclerosis clinical trials. Clin Neurophysiol. 2007;118:2413–8. doi: 10.1016/j.clinph.2007.08.004. [DOI] [PMC free article] [PubMed] [Google Scholar]
- Rutkove SB. Electrical Impedance Myography: Background, Current State, and Future Directions. Muscle Nerve. 2009 doi: 10.1002/mus.21362. (in press) [DOI] [PMC free article] [PubMed] [Google Scholar]
- Rutkove SB, Aaron R, Shiffman CA. Localized bioimpedance analysis in the evaluation of neuromuscular disease. Muscle Nerve. 2002;25:390–7. doi: 10.1002/mus.10048. [DOI] [PubMed] [Google Scholar]
- Rutkove SB, Esper GJ, Lee KS, Aaron R, Shiffman CA. Electrical impedance myography in the detection of radiculopathy. Muscle Nerve. 2005;32:335–341. doi: 10.1002/mus.20377. [DOI] [PubMed] [Google Scholar]
- Shefner JM. Motor unit number estimation in human neurological diseases and animal models. Clin Neurophysiol. 2001;112:955–64. doi: 10.1016/s1388-2457(01)00520-x. [DOI] [PubMed] [Google Scholar]
- Shefner JM, Reaume AG, Flood DG, Scott RW, Kowall NW, Ferrante RJ, Siwek DF, Upton-Rice M, Brown RH., Jr Mice lacking cytosolic copper/zinc superoxide dismutase display a distinctive motor axonopathy. Neurology. 1999;53:1239–46. doi: 10.1212/wnl.53.6.1239. [DOI] [PubMed] [Google Scholar]
- Shiffman CA, Aaron R, Amoss V, Therrien J, Coomler K. Resistivity and phase in localized BIA. Phys Med Biol. 1999;44:2409–2429. doi: 10.1088/0031-9155/44/10/304. [DOI] [PubMed] [Google Scholar]
- Tarulli A, Esper GJ, Lee KS, Aaron R, Shiffman CA, Rutkove SB. Electrical impedance myography in the bedside assessment of inflammatory myopathy. Neurology. 2005;65:451–452. doi: 10.1212/01.wnl.0000172338.95064.cb. [DOI] [PubMed] [Google Scholar]