Abstract
In fecal-tagging CT colonography (ftCTC), orally administered positive-contrast tagging agents are used for opacifying residual bowel materials to facilitate reliable detection of colorectal lesions. However, tagging agents that have high radio-density tend artificially to elevate the observed CT attenuation of nearby materials to that of tagged materials on a standard Hounsfield unit (HU) scale due to the pseudo-enhancement effect. We developed an image-based adaptive density-correction (ADC) method for minimizing pseudo-enhancement in ftCTC data. After the correction, we can confidently assume that soft-tissue materials and air are represented by CT attenuations on the standard HU scale, whereas higher CT attenuations indicate tagged materials. The ADC method was optimized for ftCTC by use of an anthropomorphic phantom filled partially with 300 HU, 600 HU, and 900 HU tagging concentrations. The effect of ADC on ftCTC was assessed visually and quantitatively by comparison of the accuracy of computer-aided detection (CAD) without and with the use of the ADC method in two different types of clinical ftCTC databases: 20 laxative ftCTC cases with 24 polyps, and 23 reduced-preparation ftCTC cases with 28 polyps. Visual evaluation suggested that ADC minimizes the observed pseudo-enhancement in phantoms and clinical cases. Quantitative evaluation suggested that ADC yields a significant improvement in the CAD accuracy in clinical databases. The results indicate that ADC is a useful pre-processing method for automated image processing applications in CTC.
Keywords: CT colonography, Pre-processing, Image processing, Computer-aided detection
1 Introduction
Colorectal cancer is one of the leading causes of cancer-related mortality in the United States. In 2007, approximately 153,760 new cases and 52,180 deaths from colorectal cancer were estimated to occur (Jemal et al. (2007)). Although colorectal cancer would be largely preventable by removal of pre-cancerous polyps, only 30% of age-eligible U.S. adults participate in full colorectal examinations (Meissner et al. (2006)). Minimally invasive computed tomographic colonography (CTC; also called virtual colonoscopy) is expected to facilitate the practical large-scale application of cost-effective colorectal screening schemes (Kim et al. (2007)).
The interpretation of a large number of CTC screening cases can be a time-consuming task for a radiologist, who may grow weary of the task and occasionally miss polyps or subtle masses. Therefore, automated image processing tools can be useful in enhancing the interpretation of CTC. For example, computer-aided detection (CAD) can be used for rapidly pointing out suspicious lesions to the radiologist in a reproducible manner (Yoshida and Näppi (2007)).
In fecal-tagging CTC (ftCTC), orally administered positive-contrast tagging agents are used for opacifying residual feces and fluid to facilitate their confident differentiation from colorectal lesions. However, fecal-tagging agents tend to introduce pseudo-enhancement (PEH), which is an artifactual increment of the observed tissue density due to the presence of adjacent high-density tagging agents (Zalis et al. (2005); Prokop and Galanski (2003)). On according to the standard Hounsfield unit (HU) scale, typical soft-tissue materials have CT attenuations of <100 HU, whereas pseudo-enhanced soft tissue may demonstrate unusually high CT attenuations of up to 500 HU. Furthermore, because the density and distribution of the tagging agent can vary considerably, the precise effect of PEH also varies greatly.
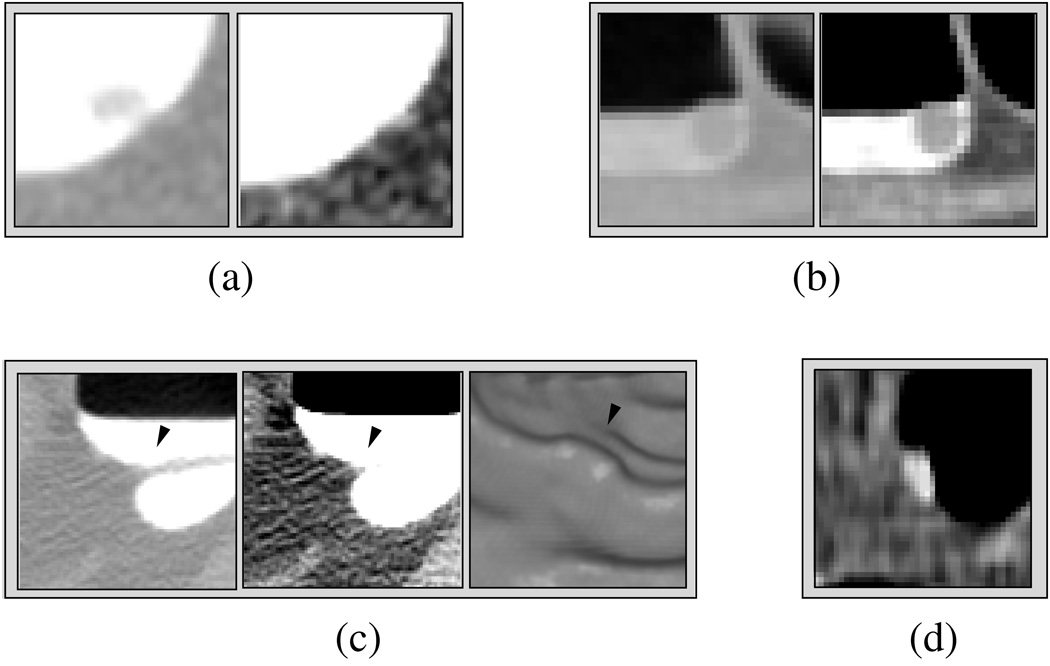
Figure 1 illustrates the problems introduced by the PEH. In (a) and (b), images of two polyps are shown. The polyp in (a) is covered by 800 HU high-density tagging, whereas the polyp in (b) is covered by 200 HU low-density tagging. The left images show the polyps in a lung CT (LCT) display (display range: [−1000, 600] HU), whereas the right images show the polyps in a soft-tissue CT (STCT) display (range: [−200, 200] HU). For extracting the polyps accurately from their surrounding tagged materials, a high threshold value of >600 HU would be required in (a), whereas a low threshold value of <200 HU would be required in (b).
Fig. 1.
Examples of the problems introduced by pseudo-enhancement. (a) A 6-mm polyp that is pseudo-enhanced by the surrounding high-density tagging. The polyp is visible in the LCT display on the left, but it is invisible in the STCT display on the right. (b) A 10-mm polyp covered by low-density tagging. The polyp is not pseudo-enhanced, and therefore it is clearly visible in both LCT and STCT displays. (c) The three images from left to right show a pseudo-enhanced fold (arrowhead) in LCT and STCT displays, and in endoscopic display, respectively. The endoscopic view demonstrates how the fold can generate a pseudo-polyp. (d) Poorly tagged feces seen in STCT display.
The PEH also complicates the identification of non-polyps. In Figure 1(c), a pseudo-enhanced fold (arrowhead) covered by tagged fluid is shown in LCT, STCT, and endoscopic displays, respectively. The LCT display shows the original structure of the fold, whereas the STCT display demonstrates the pseudo-enhancement of the fold. In the endoscopic display, tagged materials have been delineated by use of a 200-HU threshold value, and the degradation of the fold due to pseudo-enhancement has generated a pseudo-polyp. In this case, a high >400 HU threshold value would be required to delineate tagged fluid correctly from the fold. Figure 1(d) shows tagged feces in the STCT display, where the CT attenuation value level of the tagged feces is approximately 175 HU. Unless a low threshold value of <150 HU is used to delineate tagged materials at this location, the feces could be misidentified as a polyp.
In this study, we developed an image-based adaptive density-correction (ADC) method that minimizes the effect of PEH on CTC data. After the application of the ADC, we can assume that soft-tissue materials have CT attenuations of <100 HU, whereas higher CT attenuations indicate only tagged materials.
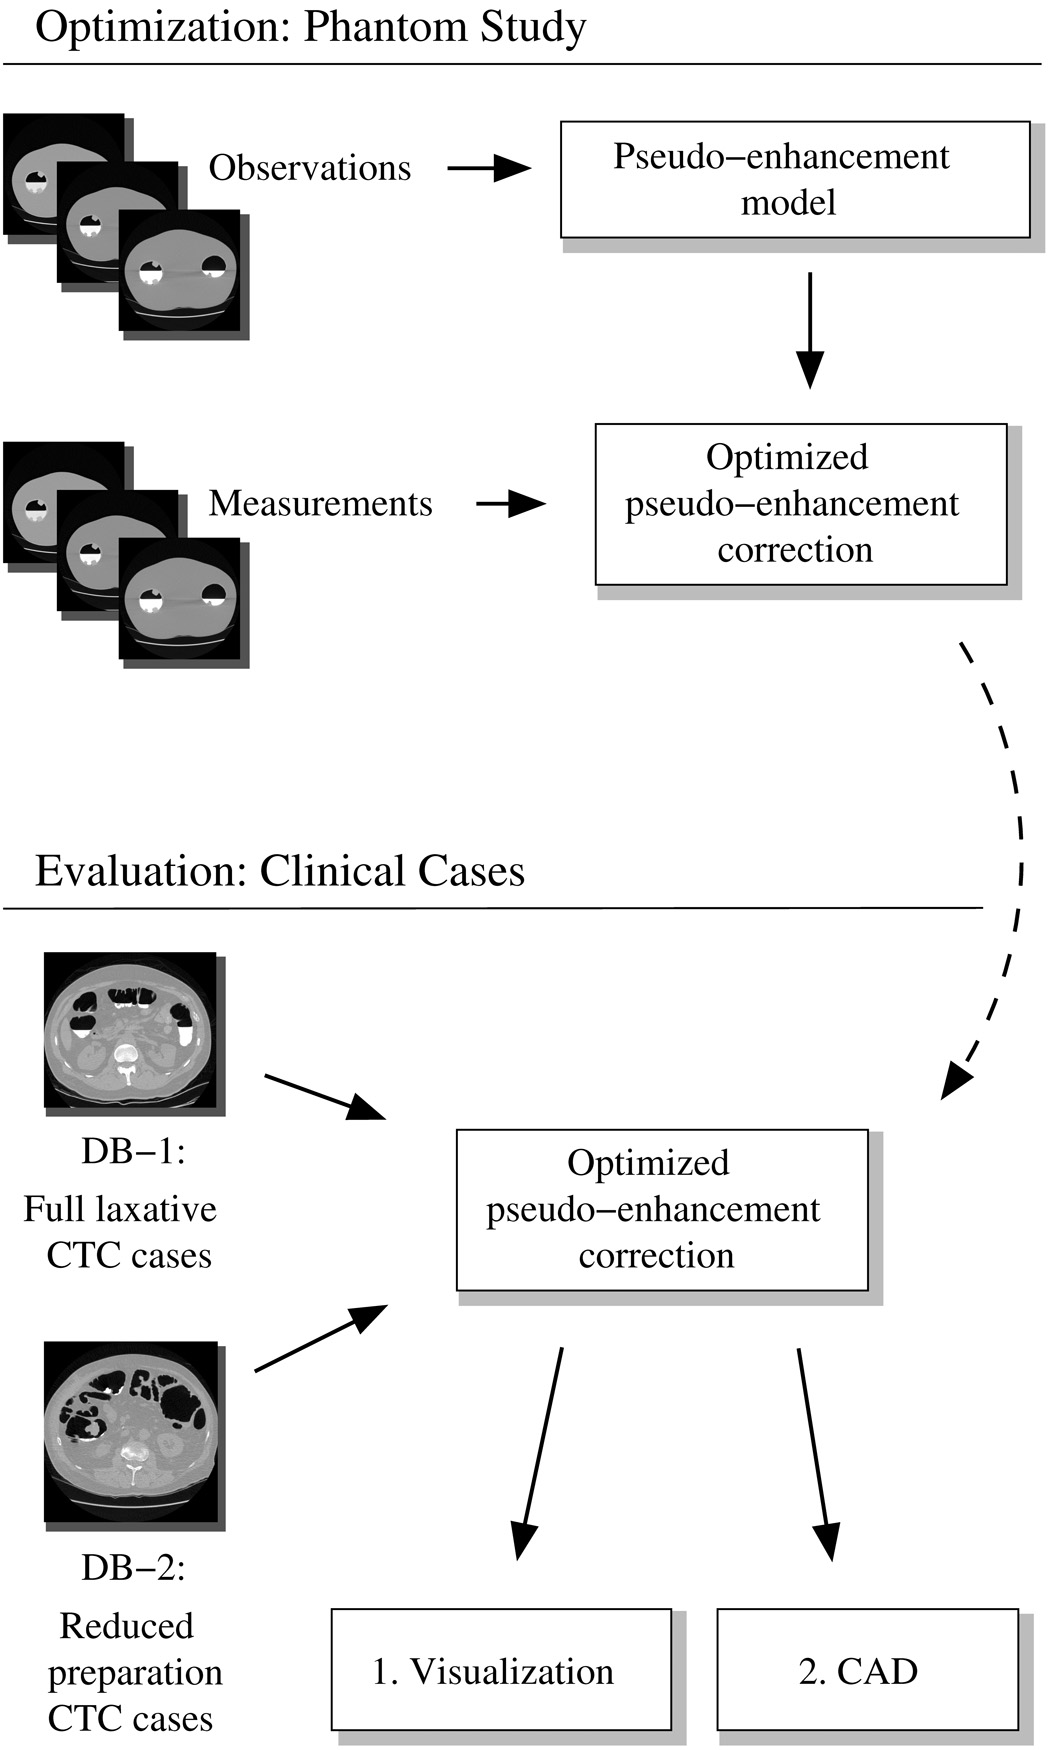
The overall study design is shown in Figure 2. The design of the ADC method is based upon the effects of PEH that we have observed empirically in an anthropomorphic colon phantom. The ADC method was optimized for application in ftCTC by simultaneous minimization of the PEH in the CT data of phantoms that had been filled partially with three different concentrations of a tagging agent. The development of the ADC method is described in Section 2.1.
Fig. 2.
Overview of the study design. The pseudo-enhancement correction model was developed and optimized by use of a phantom study. The effect of the optimized pseudo-enhancement correction method was assessed both visually and quantitatively by use of CAD with two different CTC databases.
To demonstrate the benefit of the ADC method in clinical practice, we evaluated its effect with two different clinical CTC databases. The first database included laxative ftCTC cases with residual fluid, and the second database included reduced-preparation ftCTC cases with both fluid and solid residues. The evaluation was performed visually and quantitatively by characterization of the by-polyp detection sensitivity and specificity of our previously developed CAD system ((Näppi and Yoshida (2007)); see Section 2.2) without and with the ADC. The evaluation materials and methods are presented in Section 2.3.
The results of the evaluation are presented in Section 3. A discussion and conclusions are presented in Section 4 and Section 5, respectively.
2 Methods
2.1 Adaptive Correction of CT Attenuation
2.1.1 Background
In CT imaging, a three-dimensional (3-D) representation of a target volume is reconstructed from measurements that are integrated along the different paths of spatial x-ray probe radiation field f. At a specific time instance, the relationship between f and its projection along the different paths si through the target volume can be expressed as
| (1) |
where Φi denotes the measured value that depends upon the in-plane coordinate of the projection, ρi, the transillumination angle, θ, and the height of a cross-sectional plane of the target volume, z (Buchmann and Mewes (2001)). Superimposition of the measured values yields a tomographic image of the internal sections of materials in the target volume.
In the case of monochromatic x-rays, the x-ray attenuation can be modeled in terms of the observed x-ray intensity I as
| (2) |
where I0 is the intensity of the transmitted x-rays, μ(x, y, z) is a spatially varying absorption coefficient that depends upon the physical properties of the target materials and the wavelength of the radiation, s is the irradiation pathlength, and S is the fraction of x-ray scattering (Joseph and Spital (1982); Buchmann and Mewes (2001)). By incorporation of the attenuation model of Eq. (1), the measured projection can be expressed as
| (3) |
The x-ray scattering is caused by physical interactions of x-rays with the target volume, and it becomes more dominant as the physical density of the target material increases (Buchmann and Mewes (2001); Lipson and Lipson (1969)). In particular, the use of high-density tagging agents in ftCTC increases local x-ray scattering. However, CTC uses polychromatic rather than monochromatic x-rays, and therefore the precise effect of x-ray scattering is more complicated than that depicted above.
The PEH that is observed in ftCTC images can be considered to originate mostly from the effects of x-ray scattering, beam hardening, and their inappropriate correction by CT scanners (Maki et al. (1999)). The beam hardening is caused by the tendency of low-energy x-rays to be attenuated to a greater extent than are high-energy x-rays. Although the resulting increase in tissue penetration characteristics of the x-ray beam is expected to decrease the observed CT attenuation (Brooks and DiChiro (1976)), it has been shown that beam hardening can also increase the observed CT attenuation (Rao and Alfidi (1981)). Furthermore, it also appears that, whereas proprietary internal algorithms of commercial CT scanners probably attempt to correct for known conventional beam-hardening effects, i.e., those between osseous and soft-tissue structures, they fail to correct appropriately for the presence of contrast agents. This is why PEH can introduce significant distortion of reconstructed CT images (Maki et al. (1999)). The above issues are complicated further by the known effects of CT parameters on the CT image reconstruction step (Prokop and Galanski (2003)), and by the fact that the observed CT attenuations and PEH can vary even between different units of the same CT scanner model (Levi et al. (1982)).
Given the above, it appears that optimal modeling and correction for PEH would require access to original CT projection data and proprietary CT scanner algorithms. Nevertheless, several beam-hardening correction algorithms that operate only on reconstructed CT data have been developed (Elbakri and Fessler (2003)). Such post-processing methods are particularly desirable for end users who only have access to the reconstructed CT data. However, the previously developed correction methods have several problems. Because they are based upon mathematical physics-based beam-hardening models, they tend to make simplified assumptions on target objects. Such models do not consider other potential sources of PEH in the CT scanning process, and they have generally been designed for use with a specific CT scanner model that has known imaging characteristics. Furthermore, because most of these methods have been validated only with computational simulation models or with a simple phantom, their practical benefit in a clinical setting is largely unproven. The methods also tend to involve parameters that do not have a systematic estimation method, but require inefficient and time-consuming manual parameter estimation, and it is not always clear whether these methods can be implemented with computationally efficient algorithms.
In this study, we developed a new image-based method for the minimization of the PEH effects on ftCTC data. Unlike the previous approaches, our method is not a physics-based model, but an image-processing method. The parameters of the method are estimated automatically by use of a colon phantom, in which the method is optimized to minimize the observed PEH at known tagging levels. The response of the method to other tagging levels is then derived by interpolation or extrapolation from the optimized levels. Because the correction is performed locally, the optimized correction method is adaptive, and it can correct for local effects of PEH in unseen clinical cases. Because of its simplicity, the implementation of the method is straightforward, therefore resulting in a relatively fast algorithm.
2.1.2 Adaptive density correction (ADC) method
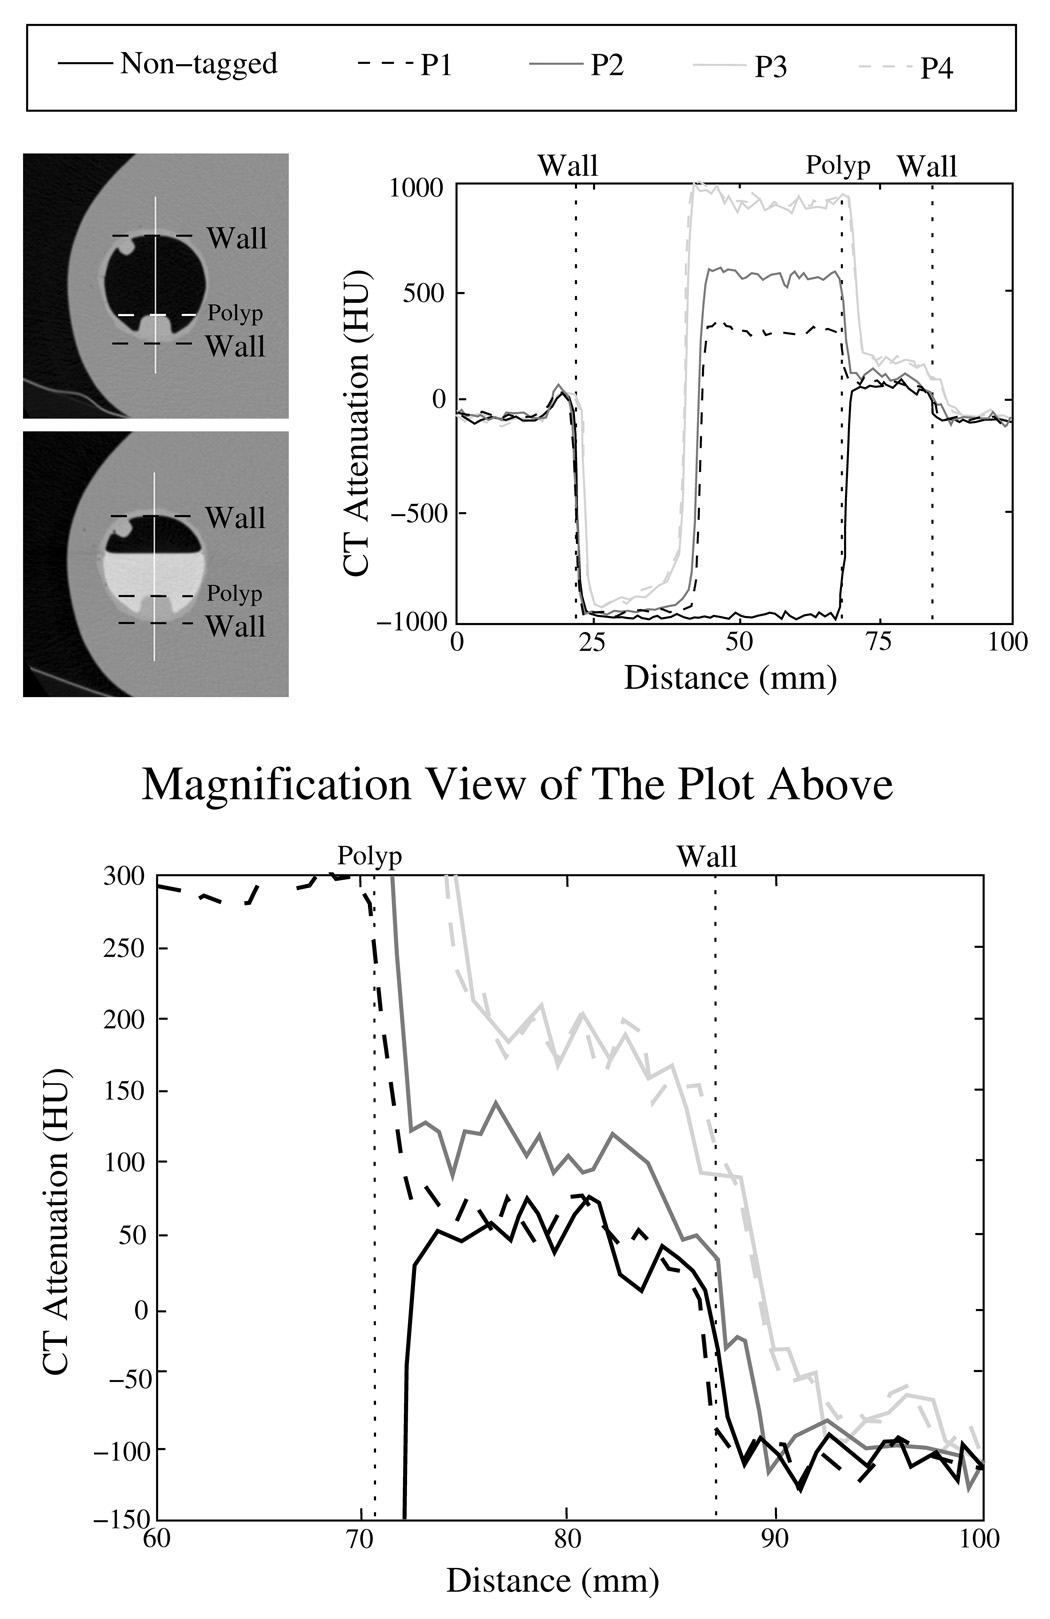
Our design of the ADC method is based upon three empirical observations of the perceived effect of the PEH on axial CTC slices. First, the PEH originates from voxels {pT} representing tagged regions with high CT attenuation. Second, the magnitude of the effect of PEH increases with increasing CT attenuation of the voxels {pT}. Third, the effect of PEH decreases with increasing distance from the voxels {pT}.
Figure 3 demonstrates these observations. The two images at the top left indicate the location of line samples in untagged and tagged phantoms. The line sample plots without and with tagged fluid are shown in the plot on the right. The line labeled ’Non-tagged’ indicates a line sample of the CT acquisition data in the untagged phantom. The plots labeled ’P1’, ’P2’, and ’P3’ indicate line samples in phantoms that were filled partially with 300 HU, 600 HU, and 900 HU concentrations of tagging agent. In these cases, the CT acquisition was performed with a 1.25-mm slice thickness, a 1.25-mm reconstruction interval, and a soft reconstruction kernel. The plot labeled ’P4’ indicates a line sample in a phantom that was filled partially with the 900 HU tagging concentration. In this case, the CT acquisition was performed with a 2.5-mm slice thickness, a 2.5-mm reconstruction interval, and a standard reconstruction kernel.
Fig. 3.
Illustration of the pseudo-enhancement effect in a colon phantom. The two images at top left indicate the location of the line samples that are depicted in the image to the right. In the plots, the line labeled ’Non-tagged’ indicates a line sample without tagging, whereas the lines labeled ’P1’, ’P2’, and ’P3’ indicate samples from phantoms filled partially with 300 HU, 600 HU, and 900 HU tagging concentrations, respectively. In these cases, the CT data were acquired with 1.25-mm slice thickness, 1.25-mm reconstruction interval, and a soft reconstruction kernel. The line ’P4’ indicates another line sample with 900 HU tagging concentration, where the CT data were acquired with 2.5 mm slice thickness, 2.5 mm reconstruction interval, and a standard reconstruction kernel. The lower figure shows a magnified view of the right part of the plot at the upper right corner.
The plots indicate that CT attenuation values next to tagged regions, i.e., in the polyp and air adjacent to the tagging, are elevated artificially as compared with the corresponding regions in the untagged phantom. This effect can be seen more clearly in the bottom plot that shows a magnified view of the 60 – 100 mm distance range of the upper-right plot. Furthermore, the upper-right plots show that the PEH increases in magnitude as the radiodensity of the tagging increases, and that the PEH is reduced as the distance from the tagged region increases. In particular, the CT attenuation levels of all profile plots approximately match at both ends of the plots, indicating that the PEH effect has vanished at these locations. Finally, the lines ’P3’ and ’P4’ almost overlap, indicating that a minor variation in the CT acquisition parameters has little effect on the PEH.
We modeled the PEH as an iterative model that approximates the above effects as an energy distribution originating from high-density regions in CT data. The two major steps of the method are explained in the following. In the first step, the total PEH energies of tagged regions are estimated. In the second step, the distribution of the estimated PEH energy from the tagged regions is estimated as an expanding ’wave front’ with decreasing energy.
Let vp denote the observed CT attenuation at a voxel p, and let v̂p denote the actual CT attenuation of p without the effect of PEH. Then, the observed CT attenuation of p can be represented as
| (4) |
where the additive term vpPEH represents the PEH at p. Therefore, by calibration of the PEH model in such a way that the estimated energy at each voxel approximates vpPEH, we can minimize the PEH effect at p by subtraction of the estimated vpPEH from the observed CT attenuation of p.
To estimate vpPEH, we first calculate the PEH energy at q by
| (5) |
where τq ∈ R is a thresholding parameter. The PEH energy model is based upon the observed density of the target material, and it is distributed to the region of neighboring voxels of p according to a Gaussian function. The initial pseudo-enhancement energy received at a voxel p from the voxel q≠p is represented by
| (6) |
where σ1(vq) determines the Gaussian spread of the energy as a function of the observed CT attenuation of q, and D(p, q) indicates distance between voxels q and p. Thus, the total PEH energy received by p from voxels q is represented by
| (7) |
In practice, the energy received directly from voxels far away from p is negligible, and thus we can implement Eq. (7) simply by distributing the local energy calculated at voxels q cumulatively to their neighboring voxels within 1 + ⌈2σ1(vq⌈ voxels from q.
Next, we redistribute the total energy received at voxel p in Eq. (7) iteratively to the neighboring voxels. These iterations account for the perceived cumulative widening of the region affected by the PEH with increasingly high observed CT attenuation levels. At each iteration, only the residual energy received during the previous iterations is redistributed, i.e., at iteration n≥1, the energy redistributed by a voxel p is rn−1(p). Thus, the total residual energy received by p at iteration n can be obtained from Eq. (6) and Eq. (7) as
| (8) |
where σ2(rn−1(q)) represents the Gaussian spread of the redistributed residual energy at q. The iteration over Eq. (8) terminates when the redistributable energy becomes negligible.
Finally, we estimate the effect of PEH at p as a sum of the total distributed energy; therefore, the actual CT attenuation of p can be approximated by
| (9) |
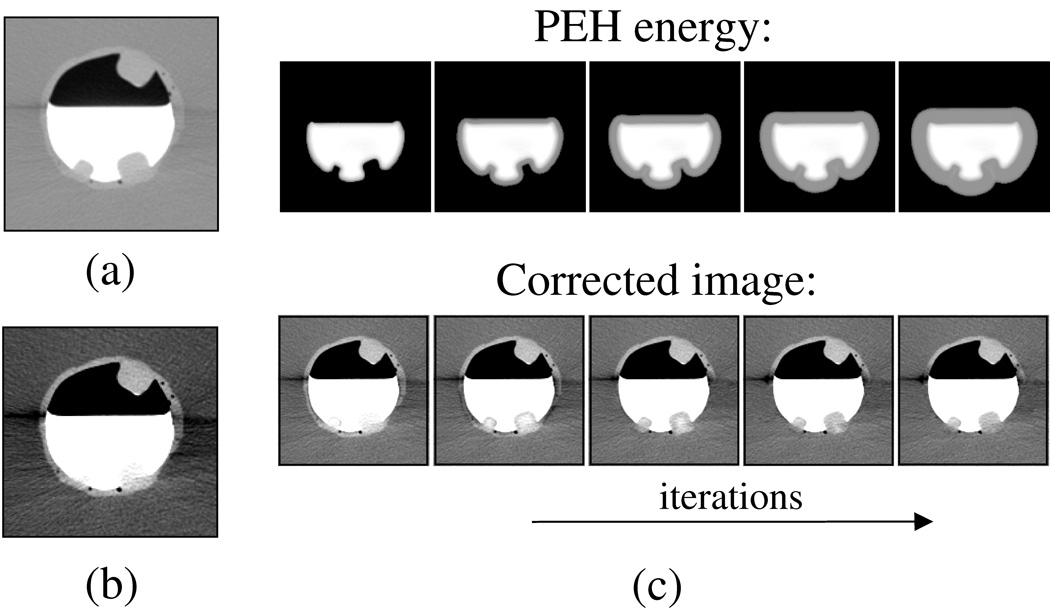
Figure 4 illustrates the iterative process of the algorithm. In (a) and (b), a region of interest with three polyps is shown in a phantom in LCT and STCT displays, respectively. The two polyps covered by tagged fluid that are pseudo-enhanced are hardly visible in the STCT display. However, after the application of the correction, the submerged polyps become visible also in the STCT display. The images in (c) demonstrate the first step and four subsequent iterations of the second step of the algorithm. The top images show the estimated PEH energy at each iteration, and the bottom figures show what the corrected image looks like at each iteration. As shown in the leftmost figure, the first step that establishes the total energy of the tagged region performs an energy estimation only at or near the tagged region. The subsequent iterations then extend the estimated correction like a ’wave’ from the initially estimated region.
Fig. 4.
Illustration of the effect of the pseudo-enhancement correction on a region of interest in the phantom. (a) LCT display of the original data. (b) STCT display of the original data. (c) Top figures show the estimated pseudo-enhancement energy at subsequent iterations, and the bottom figures show the corresponding density-corrected images.
To implement the ADC method, we use a global threshold value, τq = 100 HU, for all voxels q in the CTC data in Eq. (5). The use of a low threshold value is important for differentiating poorly tagged feces precisely from soft-tissue regions. The use of threshold values lower than 100 HU is not desirable, because they tend to be associated with soft-tissue regions. Further discussion of the selection of this particular threshold value is provided in (Näppi and Yoshida (2007)).
Although the ADC method can be implemented in arbitrary-dimensional Euclidian space, including the 3-D CT volumes of this study, we computed the effect of PEH only by use of in-plane voxels to reduce the computation time, thereby assuming that the PEH effects between axial CT slices can be considered to be negligible. The latter simplification is based on the observation that the distortion of CTC data by metallic artifacts has a limited effect in the longitudinal direction, even if severe in-plane distortion is observed ((Prokop and Galanski, 2003, p. 996)). Therefore, for the Euclidian distance between two voxels, p and q, in Eqs. (6) and (8), D(p, q) is represented by where (xp, yp) and (xq, yq) are the in-plane coordinates of voxels p and q, respectively. The iteration over Eq. (8) is terminated when the additive effect of the remaining redistributable energy becomes less than 10 HU.
2.1.3 Parameter estimation
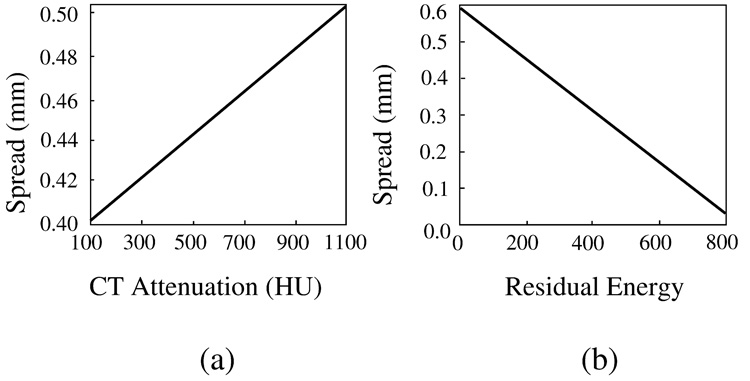
The ADC method requires the estimation of two spread functions, σ1 and σ2 in Eq. (6) and Eq. (8)), respectively. In this pilot study, we approximated these functions as linear functions that facilitate fast optimization of the ADC method:
| (10) |
We optimized the method by using an anthropomorphic colon phantom (Phantom Laboratory, Salem, NY, USA). The materials of the phantom were designed to resemble features observed in human CTC scans (Zalis et al. (2005)). In particular, the simulated soft-tissue materials had CT attenuations <100 HU, and the simulated polyps had an average CT attenuation of 50 HU.
To estimate the effect of PEH on soft-tissue materials for various tagging regimens, we filled the phantom partially with three different concentrations of Oxilan (Guerbet, Bloomington, IN, USA). We then scanned the phantom by use of an eight-channel CT scanner (Lightspeed Plus, GE Medical Systems, Milwaukee, WI, USA). The CT parameters were similar to those used routinely with clinical cases at the Massachusetts General Hospital: 2.5 mm collimation, a 1.8 mm reconstruction interval, a current of 50 mA, and a voltage of 140 kVp. The three resulting CT scans represented the phantom with uniform taggings of retained fluid at 300 HU, 600 HU, and 900 HU. As expected, the perceived effect of PEH was low at 300 HU, moderate at 600 HU, and high at 900 HU. For example, at 300 HU, the CT attenuation of untagged regions was elevated only in the immediate vicinity of tagged fluid, and the observed increment was small (<50 HU). At 900 HU, the CT attenuations of untagged regions could be elevated over wide regions with increments of up to 500 HU.
To optimize the ADC method, we extracted an 80×80×80-mm region of interest (ROI) from a same location in the three CT scan volumes by use of a semi-automated method. The use of an ROI facilitated fast sampling of a homogeneous region of the underlying materials for the time-consuming optimization step of the method. The selected ROI included regions of air, tagged fluid, the colonic wall, and five simulated polyps ≥8 mm. The results of the optimization are described in Section 3.1.
The ADC was optimized by use of a brute-force algorithm to reduce the highest observed CT attenuation within the soft-tissue regions to the range of 50 – 100 HU in all phantoms. First, an initial parameter vector V0 = (a0, b0, c0, d0) was estimated by manual calculation of the expected correction at the three tagging levels, and by confirming visually that the estimated parameter vector V0 reduced the pseudo-enhancement in the phantom scans. Next, we used a brute-force search algorithm for determining an optimal parameter vector. The search domain was defined as a discrete value range in a neighborhood of the initially estimated parameter values.
Let u represent the highest CT attenuation value over soft-tissue regions, and let t represent the lowest CT attenuation value over tagged regions, respectively. The objective function
| (11) |
was designed to penalize corrected values of u that deviate from the ideal 50 HU soft-tissue level, and to penalize corrected values of t that are reduced to less than 250 HU. Thus, the resulting optimized parameter vector minimizes the PEH of soft-tissue CT attenuation values while retaining the tagging level at > 200 HU in all phantoms.
2.2 CAD for ftCTC
Our fully automated CAD system for polyp detection in ftCTC has been described previously by (Näppi and Yoshida (2007)). Therefore, here we provide only a brief overview of the CAD system. The parameters of the CAD system were established previously from CTC cases without fecal tagging (Yoshida and Näppi (2001)).
The detection of polyps is based upon the application of two volumetric rotation-invariant features: the shape index (SI) and the curvedness (CV). The SI characterizes the topologic 3-D shape of an iso-intensity surface patch in the vicinity of a voxel, and the CV indicates the flatness of the shape characterized by the SI. Figure 5 shows an example of automated detection of a 6-mm polyp.
Fig. 5.
Example of automated detection of a 6-mm polyp located next to the interface region between air and tagged fluid. The region of interest is visualized in cut-plane view by use of an LCT display. (a) Original region. (b) Output of ADC. (c) Result of density mapping (Näppi and Yoshida (2007)) to the output of ADC. (d) The automatically extracted region of the polyp is shown in white color.
The region of the colon is extracted automatically for polyp detection by use of a lumen-tracking method (Näppi and Yoshida (2007)). Polyp candidates are detected by use of hysteresis thresholding based on the SI and CV values (Yoshida and Näppi (2001)), and the complete regions of the polyp candidates are extracted by use of conditional morphologic dilation (Näppi and Yoshida (2003)). False-positive (FP) polyp candidates are reduced by the application of a Bayesian neural network (Kupinski et al. (2001)) with a set of shape- and texture-based input features. The output of the neural network determines the final polyp candidates detected by the CAD system.
2.3 Evaluation
Materials
To demonstrate the effect of bowel preparation on the CTC outcome, we implemented the evaluation with two different kinds of clinical databases. The basic characteristics of the databases are summarized in Table 1. The selection criteria were that each CTC case had been scanned in both supine and prone positions, that there was at least one colonoscopy-confirmed retrospectively visible polyp ≥6 mm, and that we were able to resolve the ground truth conclusively with reference to colonoscopy reports, CTC reports, and pathology reports.
Table 1.
Summary of the databases (DBs) used in the evaluation.
| DB-1 | DB-2 | |
|---|---|---|
| patients | 20 | 23 |
| fecal tagging | yes | yes (dietary) |
| type of cleansing | laxative | reduced preparation |
| polyps 6–9 mm | 18 | 17 |
| polyps ≥10 mm | 6 | 11 |
Database 1 (DB-1) included 20 laxative ftCTC cases. The patients were prepared with oral administration of 90 mL sodium phosphate and 10 mg bisacodyl. Fecal tagging was performed with 500 mL barium and 120 mL diatrizoate meglumine and diatrizoate sodium (Pickhardt et al. (2003)). The patients were scanned by use of two multi-channel CT scanners (GE Light-speed and GE Lightspeed Ultra; GE Medical Systems, Milwaukee, WI, USA) with 1.25 – 2.5 mm collimations, a 1 mm reconstruction interval, and a 100 mA current with 120 kVp voltage.
Database 2 (DB-2) included 23 reduced-preparation ftCTC cases. The patients were prepared with a low-residue diet and reduced colon cleansing by oral administration of 16.5 g magnesium citrate and a ducolax suppository (LoSo Prep, E-Z-EM, Lake Success NY, USA). Fecal tagging was performed with a reduced 60 – 80 ml volume of Tagitol V (E-Z-EM) (Lefere et al. (2005)). The patients were scanned with six multi-channel CT scanners (LightSpeed16, LightSpeed Ultra, Discovery ST; GE Medical Systems, Milwaukee, WI, USA; Volume Zoom, Sensation 64; Siemens Medical Solutions, Malvern, PA, USA; Brilliance 16P, Philips Medical Systems, Andover, MA, USA) with 0.6 – 3.0 collimations, 0.3 – 1.5 mm reconstruction intervals, and 29 – 140 mA currents with 120 kVp voltage.
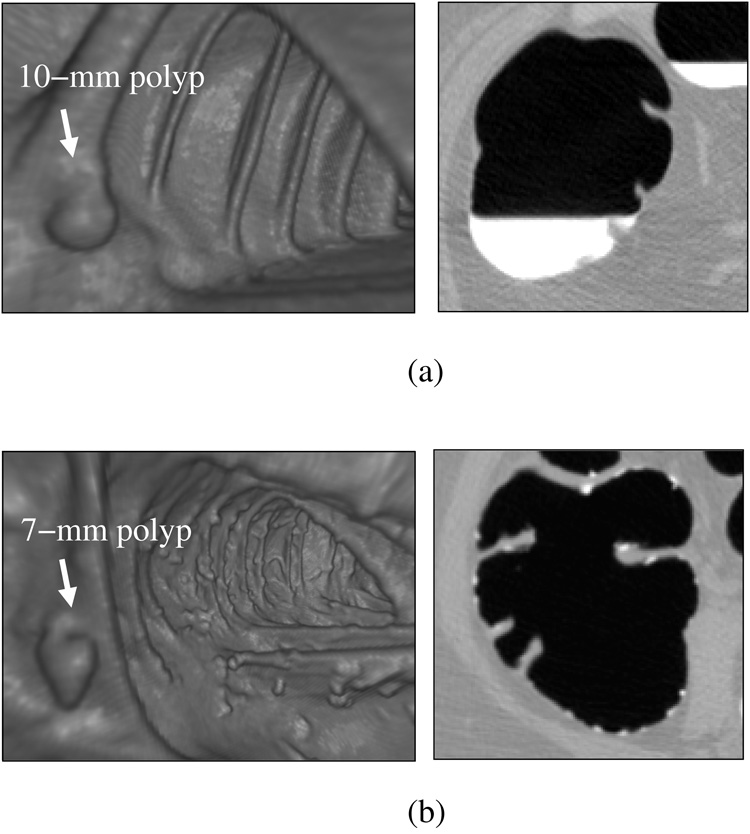
Figure 6 illustrates the difference between the databases. In database DB-1, an example shown in 6(a), the cases had a very uniform quality in terms of the CT acquisition parameters and bowel preparation. Although the colons had large amounts of residual fluid, polyps covered by the fluid were clearly visible because of the high radiodensity of the tagging agent. Because most residual materials appeared as uniformly tagged fluid, in these cases the fecal tagging merely facilitated the detection of polyps that were covered by fluid. In database DB-2, depicted in (b), the colon appearance was more variable than that of DB-1. The residual materials appeared often in solid form, and the density and the distribution of the tagging agent were quite variable. A particular challenge of automated image processing with this type of bowel preparation and tagging is that tagged materials need to be differentiated very precisely from soft-tissue structures, so that solid and semisolid fecal materials that tend to imitate polypoid lesions are not identified erroneously as polyps.
Fig. 6.
Endoscopic and cut-plane example images illustrating differences between the two databases. (a) DB-1: laxative cleansing with fecal tagging. The detection of polyps is straightforward. (b) DB-2: reduced cleansing with fecal tagging. The detection of polyps is complicated by the presence of solid feces imitating polyps.
We estimated the number of polyps that were covered by tagged materials in the databases. In DB-1, approximately 63% of the polyps were touching tagged materials, and 52% were covered by tagging. In DB-2, approximately 25% of the polyps were touching tagged materials, and 8% were covered by tagging.
Methods
We assessed the effect of the ADC both visually and quantitatively.
For quantitative evaluation, we estimated the by-polyp detection sensitivity and FP rate of our CAD system without and with ADC. In by-polyp detection, a polyp is considered detected correctly as a true-positive (TP) detection if it is detected correctly in either or both supine and prone scans of a patient. We considered a CAD polyp candidate as a TP detection if the distance between the centers of the polyp candidate and a known colonoscopy-confirmed polyp ≥6 mm was within the colonoscopy-measured size of the polyp. Otherwise, the polyp candidate was considered an FP detection.
Because of the relatively small number of cases and polyps in each database, we estimated the by-polyp detection sensitivity and the average number of FP detections per patient (supine and prone CT scans combined) by use of a leave-one-patient-out (LOPO) evaluation. In a LOPO evaluation for n cases, we train the neural network of the CAD system with the scans of n − 1 cases, and we test the trained network with the nth unseen case that was excluded from the training. After the testing of each case in this manner, the test results are combined to yield the final detection result. The basic advantage of the LOPO method is that almost all available data can be used for the evaluation while separating the training and testing data, without sacrificing the statistical significance of the results (Tourassi and Floyd (1997)). The LOPO method is also known to provide an unbiased estimate of the generalization performance more accurately than cross-validation or hold-out methods (Li and Doi (2007)). To avoid overfitting (Geman et al. (1992); Astion et al. (1993)), we trained and tested the neural network of the CAD system with only three input features: the variance of the CT attenuation, the variance of the CV, and the mean value of the SI. These features are among those that have previously yielded satisfactory results in our CAD system for CTC cases without fecal tagging (Näppi and Yoshida (2002); Näppi et al. (2004)).
For quantitative assessment of the effect of ADC on the CAD performance, we characterized the detection accuracy of the CAD system in terms of free-response receiver operating characteristic (FROC) curves. For statistical analysis, the CAD accuracy was characterized by calculation of the normalized partial area under FROC curve (AUC). Bootstrapping was performed for determining AUC values with 1000 random replications of the original sample cases with replacement, and the statistical significance of the differences in CAD accuracy was estimated by use of the two-sided paired Wilcoxon test. Because we are mainly interested in CAD performance within a clinically acceptable low FP detection rate, we evaluated the AUC values within the range of 0 – 10 FP detections per patient (for supine and prone CT scans combined).
The CAD accuracy was assessed in terms of three different schemes as follows. In ’ADC+T100’, the CTC scan data are first preprocessed by the ADC method, and then the tagged materials are delineated at a 100 HU threshold. In ’T100’, the tagged materials are delineated at the 100 HU threshold without preprocessing by the ADC. In ’T276’, the tagged materials are delineated at a 276 HU threshold value as used in a previous CAD approach for ftCTC (Summers et al. (2005)).
3 Results
3.1 Optimization of ADC
Figure 7 shows plots of the parameter functions σ1 and σ2 that were optimized as described in Section 2.1.3. In (a), the plot of σ1 indicates that voxels with high observed CT attenuation have a higher PEH energy than do voxels with low CT attenuation. In (b), the plot of σ2 indicates that, during iteration, high residual energies have a lesser effect than do low residual energies. Although this may seem counter-intuitive, it should be noted that the purpose of the iterations is to expand the ’wave front’ of the correction (Figure 4) over the surrounding region. Because the initial PEH energy of the tagged region is established during the first step, successive iteration on that region would only have the effect of reducing the tagging level of the region.
Fig. 7.
Plots of the optimized parameter functions of the ADC. (a) σ1. (b) σ2.
Whereas the optimization of the ADC method with a brute-force algorithm is time-consuming, the application of the ADC is relatively fast. We did not optimize our implementation for speed, but used serial computation with floating-point arithmetic. The precise computation time depends on the amount and density of the tagged regions in the CTC data. In CTC cases that do not have fecal tagging, the computation time is usually less than a second. In cases with large amounts of high-density tagging, the computations can take up to a minute.
3.2 Visual assessment
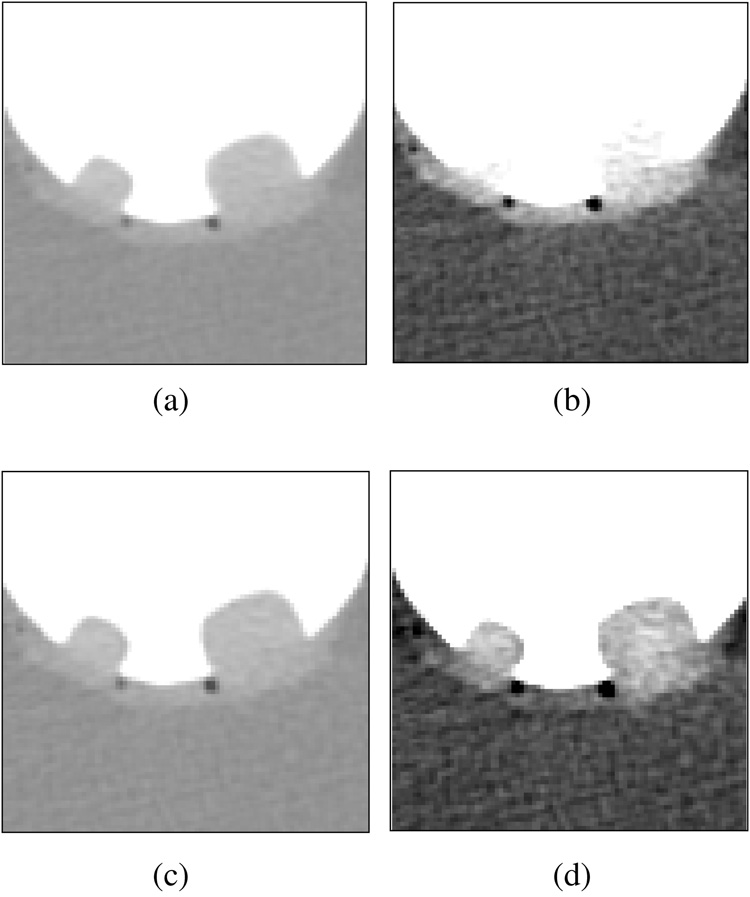
Figure 8 shows an example of the application of the optimized ADC to a phantom filled with a high-density 900-HU tagging concentration. In (a) and (b), 8-mm and 12-mm pseudo-enhanced polyps are shown with LCT and STCT displays, respectively. The PEH distortion of the polyps is particularly noticeable with the STCT display. In (c), the corrected result is shown with the LCT display, where the perceived effect of the correction is negligible, as expected. In (d), the result of the application of ADC is seen with the STCT display. The pseudo-enhanced CT attenuations have been restored to the soft-tissue range, and the perceived shapes of the polyps demonstrate significantly less distortion than do those of (b).
Fig. 8.
Cut-plane views of simulated 8-mm and 12-mm polyps submerged within 900-HU tagging concentration, seen before and after the application of the optimized ADC. (a) Original data in LCT display. (b) Original data in STCT display. (c) After ADC, in LCT display. (d) After ADC, in STCT display.
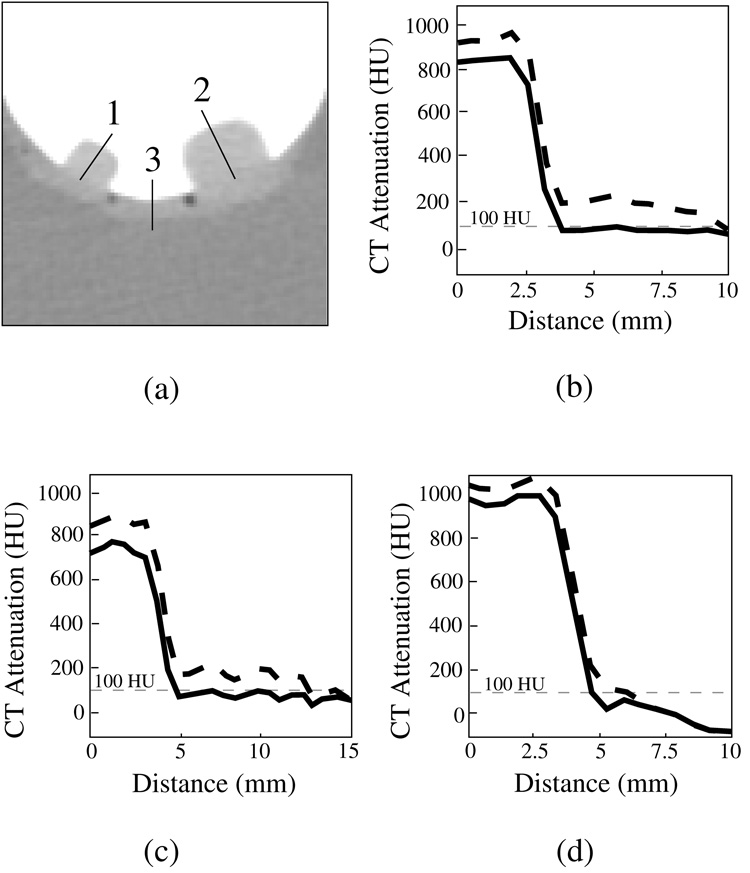
Figure 9 shows profile plots of the simulated polyps and colonic wall without and with ADC. The sampled locations are shown in (a), and the corresponding profile plots are shown in (b) – (d). The dotted and solid curves are the profile plots before and after the application of the ADC, respectively. As expected, after the application of the ADC, the CT attenuation values of soft tissue have been reduced to less than 100 HU.
Fig. 9.
Profile plots of simulated 8-mm and 12-mm polyps and colonic wall submerged within a 900 HU tagging solution, before (dotted line) and after (solid line) the application of ADC. (a) The location of the lines along which the profiles were calculated. (b) Profile plot 1 (small polyp). (c) Profile plot 2 (large polyp). (d) Profile plot 3 (wall region). In each case, ADC has reduced the CT attenuation values within the simulated soft-tissue region to <100 HU.
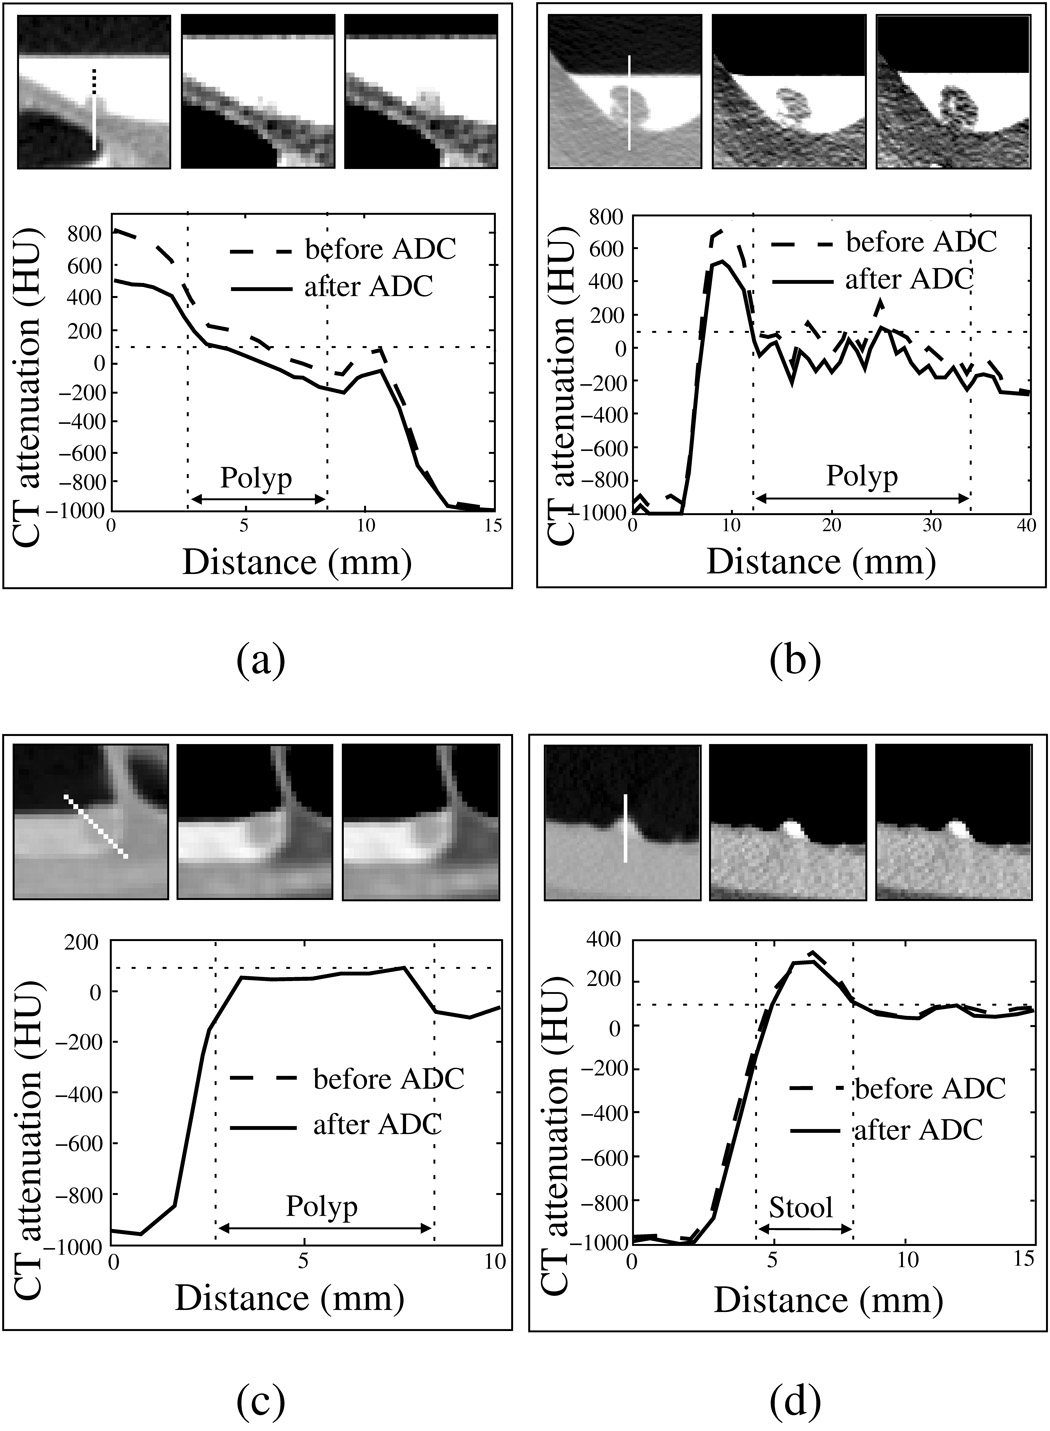
Figure 10 shows four examples of the application of the ADC to clinical cases. In (a)–(d), the three top figures show a cut-plane view of a region of interest in LCT and STCT displays before the application of the ADC, and in the STCT display after the application of ADC, respectively. In each example, the plots depict the CT attenuation along a sample line that is indicated in the first figure before (dotted line) and after (solid line) the application of the ADC. In (a) and (b), 6-mm and 12-mm pseudo-enhanced polyps are covered by high-density tagging. The ADC minimizes PEH, thereby facilitating the precise delineation of the polyp and surrounding soft-tissue structures from the tagged region with the low 100 HU CT attenuation threshold. In (c), a 10-mm polyp is covered by low-density tagging. The effect of PEH is minimal, and thus the ADC has a negligible effect on the region. This facilitates precise delineation of the polyp and soft-tissue regions from low-density tagging with the 100 HU CT attenuation threshold. In (d), solid stool with a polypoid shape is tagged with a CT attenuation of approximately 300 HU. Because of the marginal correction by the ADC, the tagging level remains higher than 100 HU, and therefore the stool can be delineated precisely with the 100 HU CT attenuation threshold.
Fig. 10.
Four examples of the application of ADC to clinical cases. In each example, the top three figures show a region of interest with LCT (left) and STCT displays (middle), and the result of the application of ADC in the STCT display (right). The plots show the CT attenuation before (dotted line) and after (solid line) the application of ADC along the line sample shown in the leftmost top image. The 100 HU CT attenuation level is shown by a thin horizontal dashed line in the plots. (a) 6-mm polyp covered by high-density tagging. (b) 12-mm polyp covered by high-density tagging. (c) 10-mm polyp covered by low-density tagging. The two line-sample plots overlap, because the effect of ADC is negligible in this case. (d) Solid stool with polypoid shape labeled with moderate-density tagging.
3.3 Effect of ADC on CAD
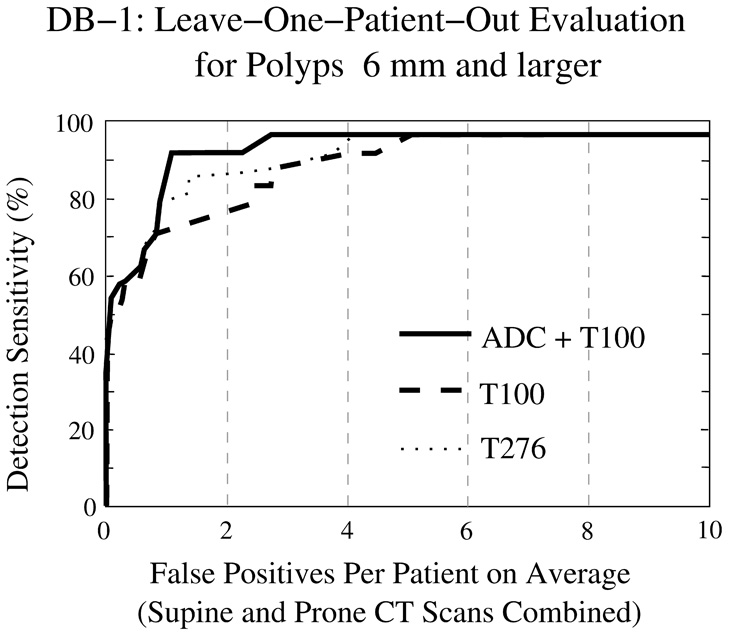
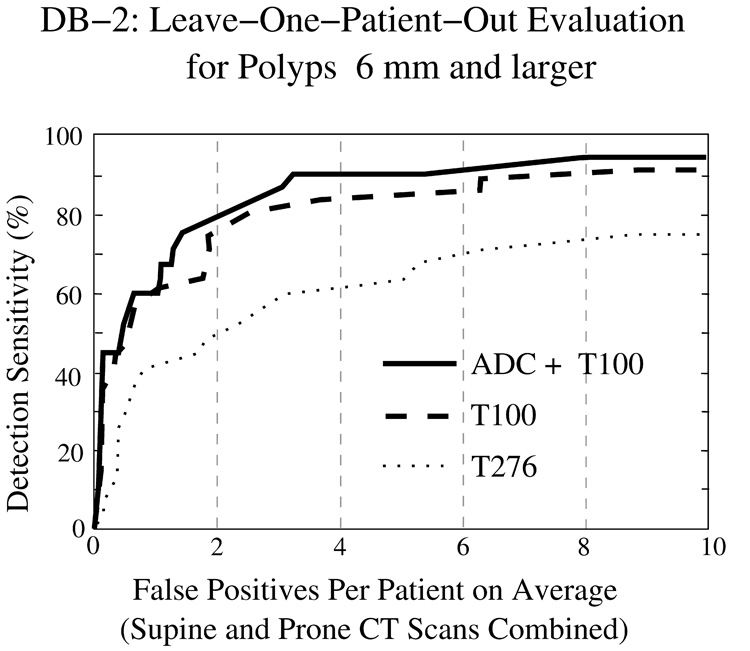
Figure 11 and Figure 12 show FROC curves representing the LOPO performance of the CAD system in the detection of polyps ≥6 mm from the two clinical databases. In both figures, the y axis indicates the by-polyp detection sensitivity of the CAD system, and the x axis indicates the average number of FP polyp candidates per patient (supine and prone CT scans combined). The three lines indicate the CAD accuracy with the three schemes for identifying tagged materials: the solid line shows the outcome of our proposed ADC + T100 scheme, the dashed line shows the outcome of the T100 scheme (i.e., without ADC), and the dotted line shows the outcome of the more conventional T276 scheme. The plots indicate that the use of ADC + T100 provides the highest accuracy in both clinical databases. As expected, the T276 scheme is more effective than T100 in DB-1, whereas the T100 scheme is much more effective than T276 in DB-2.
Fig. 11.
LOPO performance of CAD on database DB-1 for polyps ≥6 mm.
Fig. 12.
LOPO performance of CAD on database DB-2 for polyps ≥6 mm.
Table 2 presents the AUC values for the three schemes in DB-1 and DB-2. The difference in CAD accuracy between any two of the three schemes is statistically significant. The significance level is generally p < 0.01; however, in DB-1, the significance of the difference between T100 and T276 is more marginal (p = 0.02085).
Table 2.
Normalized areas under FROC curve (AUC) for 0 – 10 FP detections per patient (supine and prone CT scans combined) on average. The 95% confidence intervals are shown in brackets. All measured differences are statistically significant (p < 0.05).
| ADC+T100 | T100 | T276 | |
|---|---|---|---|
| DB-1 | 0.91 [0.89 – 0.93] | 0.82 [0.79 – 0.85] | 0.84 [0.82 – 0.86] |
| DB-2 | 0.80 [0.77 – 0.83] | 0.77 [0.74 – 0.80] | 0.57 [0.55 – 0.59] |
4 Discussion
Previous studies on automated image processing methods for ftCTC have focused on laxative ftCTC, with outcomes similar to those of database DB-1 of our study. Although the use of laxative ftCTC cases may provide excellent conditions for the application of automated image-processing methods, the requirement of laxative bowel cleansing is also considered to be one of the major barriers for patient adherence to colorectal cancer screening guidelines (Gluecker et al. (2003); Beebe et al. (2007)). Efforts to minimize this burden are under investigation and include, for example, structured low-fiber diets and complete elimination of the laxative dose (Lefere et al. (2002); Zalis et al. (2003); Iannaccone et al. (2004)). It is important to note that the CTC outcome of these protocols can vary greatly, and that automated image-processing methods that have been designed to rely on the special characteristics of a specific type of bowel preparation may fail with other types of clinical cases. Our approach represents an effort toward a fully automated preparation-independent interpretation of CTC cases, where image-processing methods would adapt automatically to bowel preparation.
As we noted in the Introduction, previously developed image-processing methods have not addressed the important problem of resolving the ambiguity between tagged materials and pseudo-enhanced native bowel materials. The ADC method that we developed presents a possible solution to this problem. Pseudo-enhanced CT attenuation values of soft-tissue regions are reduced to <100 HU by the ADC method, because they were elevated by adjacent high-density tagging agents that initiate the ADC method. On the other hand, poorly tagged regions retain their CT attenuation value, because there were no adjacent high-density materials that would initiate the ADC method. Furthermore, because the ADC method does not affect regions that are not tagged, it can be used as a universal preprocessing step in CTC.
It should be noted that pseudo-enhancement is different from the partial-volume effect (PVE). In PVE, the CT attenuation value of a voxel is an average of the CT attenuations of the different material fractions that occupy the same voxel. However, because the PEH distorts the observed CT attenuation values, it also distorts the observed PVE. Therefore, the application of ADC also corrects for observed material fractions with the PVE.
The optimization step was implemented as a brute-force approach with constraints that were based upon the physical design specifications of the anthropomorphic phantom. Alternatively, one could implement the optimization step by comparing the corrected CT data with the CT data from the untagged phantom. However, the latter approach would be more complicated to implement for several reasons. For example, the different CT images of the phantom do not match precisely because, in order to cleanse and refill the phantom with different tagging solutions, it is necessary to replace the phantom multiple times in the CT scanner.
We implemented the pseudo-enhancement correction as an in-plane method that processes each CT image independently. This approach has the advantage that the method is readily parallelizable by distribution of the CT images among available processors.
Our study has some limitations. First, the ADC method was optimized by use of only three phantom CT scans acquired by a single CT scanner. Although the resulting method was shown to be effective in clinical cases that were acquired with multiple CT scanners and a variety of CT parameters, the optimization of the method for specific scanners and parameter values is expected to provide more accurate results. In particular, improved accuracy might be necessary for restoring the CT attenuation values of pseudo-enhanced softtissue structures precisely to those observed in CT scans that do not include a tagging agent. Second, the number of cases used in this study was relatively small. However, all cases included one or more clinically significant polyps, the evaluation bias of CAD accuracy was minimized by use of the LOPO method, and overfitting of the CAD was minimized by use of only three polyp features in the FP reduction step. Furthermore, the parameters of the CAD system had been established previously from CTC cases not used in this study, and the parameters of the ADC method were established from a colon phantom. Third, in this study we only considered the problem of PEH in ftCTC. There are also other potential problems in ftCTC. For example, although PVE is not a problem for our CAD system in ftCTC (Näppi and Yoshida (2007)), the effects of PVE may need to be addressed, for example, in electronic stool subtraction applications. However, such problems are outside the scope of this study and will be investigated elsewhere.
5 Conclusion
We developed an adaptive image-based correction method for minimizing the effects of pseudo-enhancement in ftCTC data. The method can be used as a universal preprocessing step for the application of image-processing methods in CTC. The effect of the ADC was evaluated visually and quantitatively by the estimation of the LOPO performance of our CAD system in the detection of polyps ≥6 mm with full laxative and reduced-preparation clinical databases. Visual evaluation indicated that the ADC minimizes the effect of PEH on soft-tissue regions. The quantitative evaluation indicated a significant improvement in CAD accuracy with the ADC. These results indicate that the ADC has the potential to improve the consistency of automated image-processing methods when applied to different types of clinical patient databases in CTC.
Acknowledgment
This study was supported by grant no. CA095279 from the U.S. Public Health Service. The authors thank the CT colonography research group of the Massachusetts General Hospital (Boston, MA, USA) for useful discussions and Dr. Michael Zalis (Massachusetts General Hospital) for providing the anthropomorphic-phantom CT data for the study. Furthermore, the authors would like to thank Dr. Richard Choi (Virtual Colonoscopy Center, Walter Reed Army Medical Center, Washington, DC, USA) and Dr. Philippe Lefere (Stedelijk Ziekenhuis, Roeselare, Belgium) for providing the CTC cases for this study.
Footnotes
Publisher's Disclaimer: This is a PDF file of an unedited manuscript that has been accepted for publication. As a service to our customers we are providing this early version of the manuscript. The manuscript will undergo copyediting, typesetting, and review of the resulting proof before it is published in its final citable form. Please note that during the production process errors may be discovered which could affect the content, and all legal disclaimers that apply to the journal pertain.
References
- Astion M, Wener M, Thomas R, Hunder G, Bloch D. Overtraining in neural networks that interpret clinical data. Clin Chem. 1993;39:1998–2004. [PubMed] [Google Scholar]
- Beebe T, Johnson C, Stoner S, Anderson K, Limburg P. Assessing attitudes toward laxative preparation in colorectal cancer screening and effects on future testing: potential receptivity to computed tomographic colonography. Mayo Clinic Proc. 2007;82:666–671. doi: 10.4065/82.6.666. [DOI] [PubMed] [Google Scholar]
- Brooks R, DiChiro G. Beam hardening in x-ray reconstruction tomography. Phys Med Biol. 1976;21:390–398. doi: 10.1088/0031-9155/21/3/004. [DOI] [PubMed] [Google Scholar]
- Buchmann M, Mewes D. Ch. Tomography. Berlin, Germany: Springer-Verlag; 2001. Optical measurements: techniques and applications; pp. 297–335. [Google Scholar]
- Elbakri I, Fessler J. Segmentation-free statistical image reconstruction for polyenergetic x-ray computed tomography with experimental validation. Phys Med Biol. 2003;48:2453–2477. doi: 10.1088/0031-9155/48/15/314. [DOI] [PubMed] [Google Scholar]
- Geman S, Bienenstock E, Doursat R. Neural networks and the bias/variance dilemma. Neural Computation. 1992;4:1–58. [Google Scholar]
- Gluecker T, Johnson C, Harmsen W, Offord K, Harris A, et al. Colorectal cancer screening with CT colonography, colonoscopy, and double-contrast barium enema examination: prospective assessment of patient perceptions and preferences. Radiology. 2003;227:378–384. doi: 10.1148/radiol.2272020293. [DOI] [PubMed] [Google Scholar]
- Iannaccone R, Laghi A, Magniapane F, Lamazza A, Schillaci A, et al. Computed tomographic colonography without cathartic preparation for the detection of colorectal polyps. Gastroenterology. 2004;127:1300–1311. doi: 10.1053/j.gastro.2004.08.025. [DOI] [PubMed] [Google Scholar]
- Jemal A, Siegel R, Ward E, Murray T, Xu J, Thun M. Cancer statistics, 2007. CA Cancer J Clin. 2007;57:43–66. doi: 10.3322/canjclin.57.1.43. [DOI] [PubMed] [Google Scholar]
- Joseph P, Spital R. The effects of scatter in x-ray computed tomography. Med Phys. 1982;9:464–472. doi: 10.1118/1.595111. [DOI] [PubMed] [Google Scholar]
- Kim D, Pickhardt P, Taylor A, Leung W, Winter T, Hinshaw J, Gopal D, Reichelderfer M, Hsu R, Pfau P. CT colonography versus colonoscopy for the detection of advanced neoplasia. N Engl J Med. 2007;357:1403–1412. doi: 10.1056/NEJMoa070543. [DOI] [PubMed] [Google Scholar]
- Kupinski M, Edwards D, Giger M, Metz C. Ideal observer approximation using Bayesian classification neural networks. IEEE Trans Med Imaging. 2001;20:886–899. doi: 10.1109/42.952727. [DOI] [PubMed] [Google Scholar]
- Lefere P, Gryspeerdt S, Dewyspelaere J, Baekelandt M, Van Holsbeeck B. Dietary fecal tagging as a cleansing method before CT colonography: initial results - polyp detection and patient acceptance. Radiology. 2002;24:393–403. doi: 10.1148/radiol.2241011222. [DOI] [PubMed] [Google Scholar]
- Lefere P, Gryspeerdt S, Marrannes J, Baekelandt M, Van Holsbeeck B. CT colonography after fecal tagging with reduced cathartic cleansing and a reduced volume of barium. Am J Roentgenol. 2005;184:1836–1842. doi: 10.2214/ajr.184.6.01841836. [DOI] [PubMed] [Google Scholar]
- Levi C, Gray J, McCullough E, Hattery R. The unreliability of CT numbers as absolute values. Am J Roentgenol. 1982;139:443–447. doi: 10.2214/ajr.139.3.443. [DOI] [PubMed] [Google Scholar]
- Li Q, Doi K. Comparison of typical evaluation methods for computer-aided diagnostic schemes: Monte Carlo simulation study. Med Phys. 2007;34:871–876. doi: 10.1118/1.2437130. [DOI] [PubMed] [Google Scholar]
- Lipson S, Lipson H. Optical physics. Cambridge, Great Britain: Cambridge University Press; 1969. [Google Scholar]
- Maki D, Birnbaum B, Chakraborty D, Jacobs J, Carvalho B, Herman G. Renal cyst pseudoenhancement: beam-hardening effects on CT numbers. Radiology. 1999;213:468–472. doi: 10.1148/radiology.213.2.r99nv33468. [DOI] [PubMed] [Google Scholar]
- Meissner H, Breen N, Klabunde C, Vernon S. Patterns of colorectal cancer screening uptake among men and women in the United States. Cancer Epidemiol Biomarkers Prev. 2006;15:389–394. doi: 10.1158/1055-9965.EPI-05-0678. [DOI] [PubMed] [Google Scholar]
- Näppi J, Frimmel H, Dachman A, Yoshida H. A new high-performance CAD scheme for the detection of polyps in CT colonography. In: Fitzpatrick J, Sonka M, editors. SPIE Medical Imaging 2004. Vol. 5370. 2004. pp. 839–848. [Google Scholar]
- Näppi J, Yoshida H. Automated detection of polyps in CT colonography: evaluation of volumetric features for reduction of false positives. Acad Radiol. 2002;9:386–397. doi: 10.1016/s1076-6332(03)80184-8. [DOI] [PubMed] [Google Scholar]
- Näppi J, Yoshida H. Feature-guided analysis for reduction of false positives in CAD of polyps for CT colonography. Med Phys. 2003;30:1592–1601. doi: 10.1118/1.1576393. [DOI] [PubMed] [Google Scholar]
- Näppi J, Yoshida H. Fully automated three-dimensional detection of polyps in fecal-tagging CT colonography. Acad Radiol. 2007;25:287–300. doi: 10.1016/j.acra.2006.11.007. [DOI] [PMC free article] [PubMed] [Google Scholar]
- Pickhardt P, Choi J, Hwang I, Butler J, Puckett M, Hildebrandt H, Wong R, Nugent P, Mysliwiec P, Schindler W. Computed tomographic virtual colonoscopy to screen for colorectal neoplasia in asymptomatic adults. N Engl J Med. 2003;349:2191–2200. doi: 10.1056/NEJMoa031618. [DOI] [PubMed] [Google Scholar]
- Prokop M, Galanski M. Spiral and multislice computed tomography of the body. Ludwigsburg, Germany: Thieme Verlag; 2003. [Google Scholar]
- Rao P, Alfidi R. The environmental density artifact: a beam-hardening effect in computed tomography. Radiology. 1981;141:223–227. doi: 10.1148/radiology.141.1.7291529. [DOI] [PubMed] [Google Scholar]
- Summers R, Franaszek M, Miller M, Pickhardt P, Choi J, et al. Computer-aided detection of polyps on oral contrast-enhanced CT colonography. Am J Roentgenol. 2005;184:105–108. doi: 10.2214/ajr.184.1.01840105. [DOI] [PubMed] [Google Scholar]
- Tourassi G, Floyd C. The effect of data sampling on the performance evaluation of artificial neural networks in medical diagnosis. Med Decis Making. 1997;17:186–192. doi: 10.1177/0272989X9701700209. [DOI] [PubMed] [Google Scholar]
- Yoshida H, Näppi J. Three-dimensional computer-aided diagnosis scheme for detection of colonic polyps. IEEE Trans Med Imaging. 2001;20:1261–1274. doi: 10.1109/42.974921. [DOI] [PubMed] [Google Scholar]
- Yoshida H, Näppi J. CAD in CT colonography without and with oral contrast agents: progress and challenges. Comp Med Imag Graph. 2007;31:267–284. doi: 10.1016/j.compmedimag.2007.02.011. [DOI] [PubMed] [Google Scholar]
- Zalis M, Perumpillichira J, Del Frate C, Hahn P. CT colonography: digital subtraction bowel cleansing with mucosal reconstruction - initial observations. Radiology. 2003;226:911–917. doi: 10.1148/radiol.2263012059. [DOI] [PubMed] [Google Scholar]
- Zalis M, Perumpillichira J, Kim J, Del Frate C, Magee C, Hahn P. Polyp size at CT colonography after electronic subtraction cleansing in an anthropomorphic colon phantom. Radiology. 2005;236:118–124. doi: 10.1148/radiol.2361040231. [DOI] [PubMed] [Google Scholar]


