Summary
Both the swimbladder and sonic muscles of the oyster toadfish Opsanus tau (Linnaeus) increase in size with fish growth making it difficult to distinguish their relative contributions to sound production. We examined acoustics of the swimbladder independent of the sonic muscles by striking it with a piezoelectric impact hammer. Amplitude and timing characteristics of bladder sound and displacement were compared for strikes of different amplitudes. Most of the first cycle of sound occurred during swimbladder compression, indicating that the bladder rapidly contracted and expanded as force increased during the strike. Harder hits were shorter in duration and generated a 30 dB increase in amplitude for a 5-fold or 14 dB range in displacement. For an equivalent strike dominant frequency, damping, bladder displacement and sound amplitude did not change with fish size, i.e. equal input generated equal output. The frequency spectrum was broad, and dominant frequency was driven by the strike and not the natural frequency of the bladder. Bladder displacement decayed rapidly (ζ averaged 0.33, equivalent to an automobile shock absorber), and the bladder had a low Q (sharpness of tuning), averaging 1.8. Sound output of an acoustic source is determined by volume velocity (surface area × velocity), and bladder surface area, muscle dimensions and contraction amplitude increase with fish size. Therefore, larger fish will be capable of producing more intense sound. Because the bladder is a low Q resonator, its output will follow muscle contraction rates independent of its size and natural frequency.
Keywords: acoustics, communication, sound production, courtship, swimbladder, resonance
INTRODUCTION
The acoustics of the teleost swimbladder is of interest to diverse fields, including fish sound production and hearing, passive acoustics, sonar and deep scattering layers, and natural and anthropocentric noise on fish communication. Since at least the 1960s the swimbladder has been modeled as an underwater resonant bubble, an acoustic monopole that radiates sound omnidirectionally (Bergeijk, 1964; Harris, 1964). The resonant frequency of a swimbladder therefore should be inversely proportional to its size, e.g. a larger toadfish with a larger swimbladder (Fine et al., 1990) should produce lower frequency sounds (Weston, 1967). Findings inconsistent with this model such as a low Q (a quality factor that indicates sharpness of tuning) and rapid damping have been dismissed as damping by surrounding fish tissue rather than a property of the bladder itself (Batzler and Pickwell, 1970; McCartney et al., 1970; Weston, 1967).
Work with the oyster toadfish Opsanus tau (Fine et al., 2001), the weakfish Cynoscion regalis (Connaughton et al., 2002) and the croaker Micropogonias undulatus (Fine et al., 2004) has suggested an alternative paradigm in fishes that utilize fast sonic muscles to vibrate the swimbladder for sound production. Sound frequencies, rather than being produced by the resonant frequency of the swimbladder, are driven as a forced response to muscle contraction, i.e. the muscle contraction rate will generate the dominant frequency in the case of a continuous tonal sound, as in the toadfish boatwhistle, or the peak frequency in pulsed sounds produced by a single muscle twitch, as in weakfish and croaker.
The oyster toadfish has long been a model for fish sound production (Tavolga, 1958; Fish, 1972; Winn, 1972; Fine and Thorson, 2008). Males produce a long-duration tonal advertisement boatwhistle call (Fine, 1978) and both sexes produce a short-duration, highly variable, agonistic grunt (Waybright et al., 1990; Maruska and Mensinger, 2009). Sounds are produced by extremely fast sonic muscles (Feher et al., 1998; Fine et al., 2001; Rome, 2006) that line the sides of the heart-shaped swimbladder (Barimo and Fine, 1998). The muscle contraction rate generates the fundamental frequency of the call (Skoglund, 1961), and the muscles can follow an electrical stimulus one-for-one at 400 Hz without tetanizing (Fine et al., 2001). Both the mass and linear dimensions of the swimbladder and sonic muscles increase with fish size, and both the muscles and the bladder are larger in males than females (Fine et al., 1990; Fine et al., 1993). Sounds are produced by a combination of the muscles and the bladder. In order to characterize the acoustic properties of the swimbladder independently from the sonic muscles, we excited it with a miniature modal analysis impact hammer and measured its output with a laser vibrometer and probe-tube microphones.
MATERIALS AND METHODS
Toadfish were collected in the York River, Virginia, USA and maintained in 20‰ seawater. Fish were anesthetized with 200 mg l–1 MS-222 in aerated seawater, weighed and measured for total length. Experimental and animal care protocols were approved by Virginia Commonwealth University's Institutional Animal Care and Use Committee and followed all relevant laws of the United States.
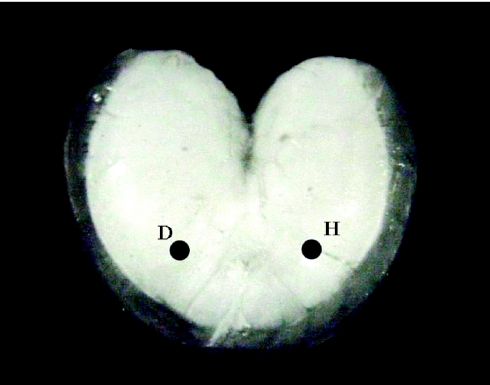
A fish was placed upside down in a dissecting tray, which was supported on a foam pad within a sound-proof booth (Industrial Acoustics, Bronx, NY, USA). We made a medial incision and retracted the body cavity to expose the entire ventral surface of the swimbladder. The dorsal surface maintained normal contact with the body wall. A retro-reflective laser disc was placed on the right ventral surface of the bladder about halfway between the midline and edge of the sonic muscle and about two thirds of the way back on the anterior–posterior axis (Fig. 1). This part of the swimbladder is relatively horizontal, sits above the largest region of the gas cavity within the bladder and avoids the rostral surface, which is damped by a `pillar' at the confluence of the two anterior chambers (see Barimo and Fine, 1998).
Fig. 1.
Ventral view of the heart-shaped swimbladder of the oyster toadfish. H indicates the site struck with the impact hammer, and D is the laser target disc where displacement and sound were measured. The rostral edge of the swimbladder faces upward.
A laser vibrometer (Brüel & Kjaer, Yorba Linda, CA, USA, model 3544; sensitivity 1 V mm–1) was aligned to the retro-reflective disc, and an Etymotics ER-7C probe tube microphone (Elk Grove Village, IL, USA, +20 dB amplification) was positioned 1 cm above the disc. The microphone is rated within ±2 dB between 200 Hz and 10 kHz and is likely to fall off about 3 dB per octave below 200 Hz. Sound amplitude was calibrated with a test tone through a port in the microphone power supply and converted to sound pressure level (SPL) in dB re: 20 μPa (hereafter `dB'). The swimbladder was stimulated with a miniature modal analysis hammer (PCB model GK291M52, Depew, NY, USA; X10 setting; with a vinyl tip cover, transducer sensitivity 15.9 mV N–1). An equivalent position on the opposite side of the bladder from the laser and sound recording (Fig. 1) was struck with a series of hits of increasing amplitude.
All analog data were captured, digitized (2 kHz sampling rate) and analyzed using a data acquisition/analysis system (Biopac Systems Inc., Goleta, CA, USA, MP100 WorkStation version 3.4).
Amplitude and duration were measured for each quarter cycle of the sound, displacement and hammer force traces for each fish. Sound and displacement data were plotted against amplitude and displacement using Graph Pad Prism (La Jolla, CA, USA). The pattern of change in sound pressure and displacement with hammer force was somewhat variable, and there was increasing variance with larger hits. Therefore both variables were log transformed and fit with linear equations. These regressions were plotted on linear coordinates. Sound amplitude was also regressed against displacement over a middle range of stimuli. The weakest hits were not usable because the resulting sound was lost in the background noise, and the most powerful hits were likewise excluded because of a distorted laser waveform. At least some of the distortion resulted from lateral movement of the bladder, which would not be fully registered in the vertical plane by the laser.
Because displacement and SPL covaried with hammer force, comparison across fish utilized the value calculated from the regression for a 10 mV (0.63 N) strike. The value was chosen because it was in the middle of the amplitude range of hammer strikes well before distortions were evident. Sound and displacement parameters were plotted against fish mass. Stiffness was calculated as hammer force divided by displacement and converted to Newtons per meter (N m–1).
Frequency spectra were measured for small, medium and large fish (173, 432 and 765 g, respectively). Hammer, displacement and sound trace data from light (∼4 mV, 0.25 N), medium (∼10 mV, 0.63 N) and hard (∼14 mV, 0.88 N) hammer strikes were transformed with a Fast Fourier Transform (FFT) (256 point sample, Hanning window).
Damping was so rapid that the standard equation for damping ratio, ζ (zeta), (Steidel, 1989) was modified to use the rate of amplitude decay in half-cycles rather than full cycles (first positive, P1, and second negative, N2, wave amplitude):
Figure 2.
ζ was also calculated for sounds from 10 fish from a previous study produced by single muscle twitches evoked by stimulating the sonic nerve with 0.1 ms pulses (Fine et al., 2001).
Q was calculated from the damping ratio by:
 |
(2) |
Q was also calculated from the sound spectra, of the small, medium and large fish, using:
 |
(3) |
where fmax is the dominant frequency and Δf–3 dB is the bandwidth of the `half-power points' on either side of fmax whose amplitudes are 3 dB lower than the amplitude at fmax.
RESULTS
Twenty toadfish ranging between 22.5 cm and 37.4 cm in total length and 173 g and 825 g in mass were examined. Eighteen of the fish were male, and two were female. The waveforms and quantitative effects of increasing hammer force were generally similar among fish although there was individual variation.
Waveforms
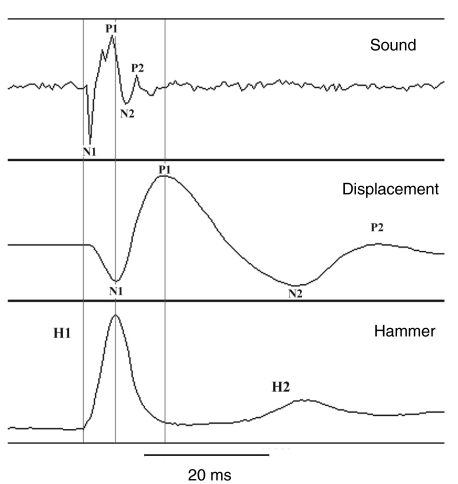
A typical hammer strike and the induced swimbladder displacement and sound waveforms are represented in Fig. 2 for a 432 g male toadfish. The hammer waveform was an asymmetrical half-cycle with a shorter rise than fall time (5 ms and 7 ms, respectively, in Fig. 2). The rise time represents the period in which the hammer was transferring energy to the bladder. It started with a relatively slow force as pressure inside the bladder increased and then continued with a steeper slope. The fall time represents the time when the hammer bounced back from the swimbladder surface. The slope of the fall time decreased just before return to the baseline, and we believe the apron indicated the time when the hammer lost contact with the swimbladder. The first strike (H1) was usually followed by a second weaker hit (H2). H2 appeared to have a minor interaction with the decay of swimbladder vibration that could, if anything, cause a slight underestimation of damping because it overstates the energy stored in the bladder (ζ represents the fraction of energy dissipated per cycle). It occurred well after termination of the sound waveform and did not therefore cause a major problem with interpretation of the results.
Fig. 2.
Waveform of a hammer strike and induced swimbladder displacement and sound for a male 432 g toadfish. Note that after the first hit H1, the hammer administered a second much weaker strike H2. Displacement occurred over two cycles: an initial compression of the swimbladder (negative or N1 wave) followed by an expansion (positive or P1 wave) and a greatly attenuated second cycle exhibiting rapid damping. The sound waveform also exhibited two cycles (N1 and P1 followed by N2 and P2). Cursors mark the beginning, peak and end of the hammer strike. Note that the first cycle of the sound waveform is largely complete by the peak of the hit, which occurs at P1 of displacement, and that sound is complete before the second hit. The space after the beginning vertical line on the displacement waveform indicates a 1.5 ms delay in the movement of the bladder at the measurement site.
Displacement followed a sinusoidal pattern of 1.5–2 cycles and began with a negative deflection (N1), indicating that the bladder was pushed in (Fig. 2), i.e. away from the laser sensor. It was followed by a longer positive peak (P1) of greater amplitude. The pronounced slowing from P1 to N2 indicated that the swimbladder rapidly lost velocity. The signal decayed so rapidly that the second positive rebound (P2) was not always clearly visible.
The sound waveform began with a negative peak of acoustical pressure (N1) followed by a positive peak (P1). P1 had a compound waveform, generally composed of two subpeaks (63%) but ranged from one (25%) to three (12%). The decay waveform included an additional but much diminished negative deflection (N2), which was sometimes followed by a positive deflection (P2).
Comparison of hammer, displacement and sound traces indicated that displacement exhibited a latency of ∼1.5 ms from the onset of the hammer strike; the onset of the hammer and sound trace corresponded closely (Fig. 2). The slight pause before the negative deflection in acoustic pressure corresponded to the initial shoulder of the hammer strike. The peaks of the hammer trace and N1 of displacement were closely aligned, and the end of the rebound of the hammer trace coincided with the peak of P1 displacement, suggesting that the expanding bladder was pushing the hammer back. Most of the first cycle of the sound waveform, including N1 and the peak of P1 occurred within the rise time of the hammer hit as the bladder membrane was compressed. As the force of the hammer declined and the bladder expanded, the positive acoustic pressure of the signal declined. The second cycle of the sound waveform occurred between displacement N1 and P1, and the sound decayed to background levels before the P1 peak in displacement. The decay cycle of displacement (N2 and P2) did not result in audible sound. Therefore, an almost complete cycle of the sound waveform occurred during a quarter cycle of the displacement waveform, and the high frequency components of the sound did not track the displacement as measured at the laser target.
Quantitative effect of increasing hammer force
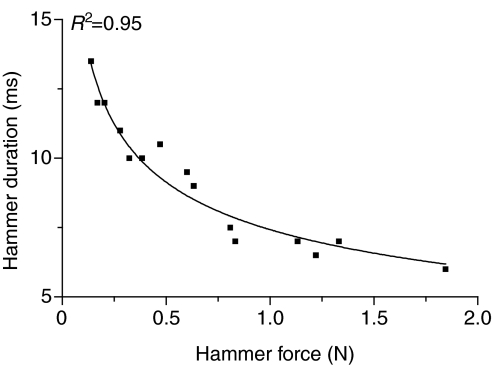
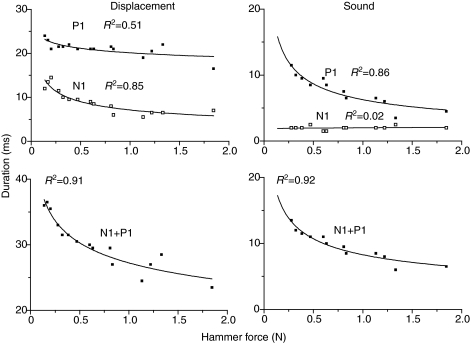
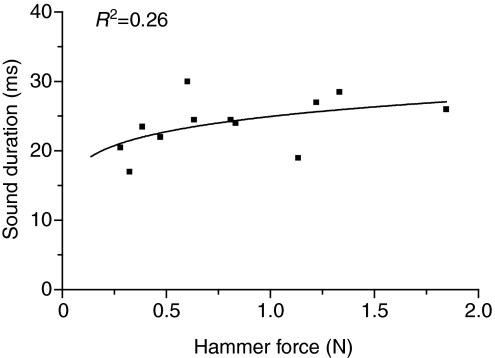
Changes in hammer force, i.e. harder hits, caused changes in hammer duration and swimbladder displacement and sound parameters (Figs 3 and 4). The rise time of the hammer waveform decreased non-linearly from 13.5 ms to 6.0 ms with increased hammer force, indicating that harder hits transferred higher frequency energy to the bladder (Fig. 3). The adjusted hammer rise time calculated from the regression of hammer rise time against hammer force for a 10 mV (0.63 N) strike was 7.0±0.4 ms. Displacement N1 was approximately half as long as P1 in an 825 g male (Fig. 4). N1 decreased from 14.5 ms to 6 ms (R2=0.85), and P1 duration decreased from 24 ms to 16.5 ms (R2=0.51) with increasing hammer force. The total duration (N1+P1) for the first cycle of displacement decreased from 36.5 ms to 23.5 ms, dropping sharply at first and then more slowly to 28 ms (R2=0.91). Sound N1 duration remained constant at 2.0±0.5 ms (R2=0.02). Sound P1 duration dropped from 11.5 ms to 3.5 ms (R2=0.86), and the total sound duration for the first cycle (N1+P1) dropped from 13.5 ms to 6.0 ms (R2=0.92). The displacement N1 duration was similar to the first-cycle duration (N1+P1) of the acoustic waveform (Fig. 4), supporting waveform evidence that the acoustic waveform is produced during N1 duration. Although the duration of the first cycle decreased with harder hits, the duration of the entire sound ranged from 17 ms to 30 ms and increased modestly (R2=0.26) with harder hits, which transfer more energy to the bladder (Fig. 5).
Fig. 3.
Relationship of hammer strike rise time in milliseconds to hammer force in Newtons for an 825 g male toadfish.
Fig. 4.
Relationship of displacement (left panel) and sound duration (right panel) (P1 and N1) to hammer force for an 825 g male toadfish. The lower row presents the summed response (P1+N1).
Fig. 5.
Relationship of total sound duration to hammer amplitude for an 825 g male toadfish.
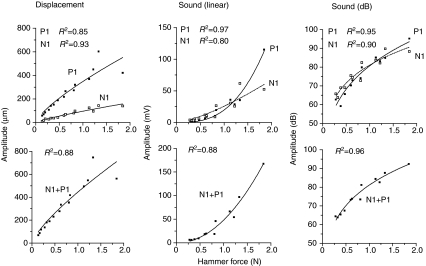
Displacement and sound amplitude both increased with increasing hammer force (Fig. 6). Displacement N1 amplitude increased from 10.4 μm to 144.3 μm (R2=0.93), P1 amplitude from 58.9 μm to 603.4 μm (R2=0.85) and total displacement (N1+P1) increased from 69.3 μm to 747.7 μm (R2=0.88). The positive displacement was over three times greater than the negative displacement with adjusted values of 90.2 and 301.0 for N1 and P1, respectively. Extremely hard hits caused the displacement waveform to distort. The amplitude of P1 leveled off (probably because of lateral movement transferred to the swimbladder).
Fig. 6.
Relationship of displacement and sound amplitude (P1, N1 and P1+N1) to hammer force for an 825 g male toadfish. Sound is expressed in linear units and dB re: 20 μPa (r.m.s., root mean square).
Sound N1 amplitude increased from 3.1 mV to 61.8 mV (R2=0.80) and P1 increased from 1.8 mV to 115.3 mV (R2=0.97). N1 amplitude increase was linear and P1 increased non-linearly. The total amplitude (N1+P1) of the first cycle of sound increased non-linearly from 6.2 mV to 167.5 mV (R2=0.88). Levels of sound N1 amplitude increased from 63.8 dB SPL to 89.8 dB SPL (R2=0.90), and P1 increased from 59.2 dB to 95.2 dB (R2=0.95). The r.m.s. (root mean square) amplitude (N1+P1) increased from 63.9 dB to 92.5 dB (R2=0.96), indicating a dynamic range of about 30 dB for the swimbladder under these conditions. In contrast to displacement, which became distorted and leveled off with the hardest strikes, P1 sound amplitude increased at an accelerating rate, which is obvious on a linear scale but not after conversion to dB (Fig. 6). Even though P1 was greater than N1 displacement, the sound levels were relatively similar, particularly after conversion to dB.
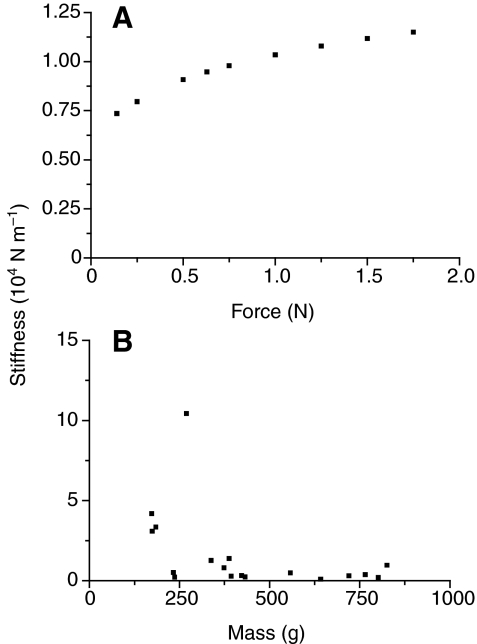
Stiffness (Fig. 7A) was calculated from data in Fig. 6 from the regression of N1 displacement against hammer force. A 0.63 N hit resulted in a 66 μm displacement equivalent to a stiffness of 9.48×10³ N/m. Increasing force caused a decelerating increase in stiffness to 1.15×10⁴ N m–1 (Fig. 7A). Comparison across fish for a 0.63 N hit (Fig. 7B) indicated that stiffness was high and variable in small fish and decreased to a smaller level in larger fish. For fish >300 g, stiffness averaged 0.57±0.13×10⁴ N m–1.
Fig. 7.
(A) Relationship of stiffness measured for N1 displacement to hammer force in Newtons for a 825 g toadfish. Values were calculated from the regression of displacement to hammer force. (B) Relationship of stiffness for a 0.63 N hammer strike to fish mass.
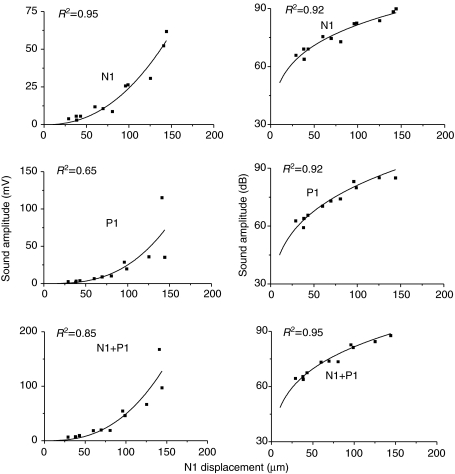
Increasing N1 displacement led to an increase in sound amplitude (Fig. 8). Displacement and sound amplitude were compared over a partial range because sound from the weak hits was obscured by background noise and powerful hits distorted the positive displacement trace from the laser. Sound N1 amplitude increased from 3.1 mV to 61.8 mV (R2=0.95) and P1 increased from 1.8 mV to 115.2 mV (R2=0.65) over displacements ranging from 29 μm to 144 μm. Therefore, a 115 μm (almost 5-fold or 14 dB) range of displacements (29–144 μm) caused an increase of about 30 dB in SPL. The lower R2 for the P1 curve and the variability of the three points between 125 μm and 150 μm are indications that the distortion (misalignment with the laser) had started. Total sound amplitude (N1+P1) for the first cycle increased almost 30-fold from 6.2 mV to 167.5 mV (R2=0.85) for a 5-fold increase in displacement. Converting the sound curve to dB again changed its shape but still illustrates greater sound output per displacement with harder strikes. With increasing N1 displacement, sound N1 increased non-linearly from 63.8 dB to 89.8 dB (R2=0.92) and P1 increased from 59.2 dB to 95.2 dB (R2=0.92). N1+P1 amplitude increased from 63.9 dB to 92.5 dB (R2=0.95).
Fig. 8.
Relationship of sound amplitude (P1, N1 and P1+N1) to swimbladder displacement (N1) in a 825 g male toadfish. Sound is expressed in linear units and dB re: 1 μPa (r.m.s., root mean square).
Frequency response
Spectral analysis (FFT) was employed for various amplitude hammer strikes on representative fish: one of the smallest (172.5 g, 22.6 cm TL, total length), a medium (431.9 g, 28.7 cm) and one of the largest fish (764.5 g, 37.4 cm).
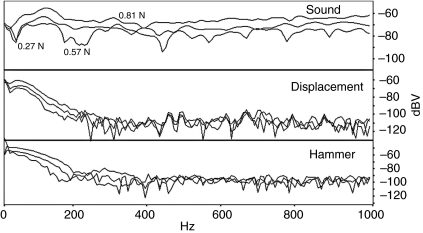
The hammer spectrum peaked at the lowest frequencies readable on the FFT and declined steadily about 40 dB into the noise around 200 Hz (Fig. 9). Harder hits increased the energy at the peak and higher frequencies by about the same amount, i.e. the shapes of the curves were similar (Fig. 9). The displacement trace increased in energy or exhibited a plateau from 30 Hz to 60 Hz and then dropped almost 50 dB into the noise floor by around 200 Hz. Interestingly, more intense hits did not radically change the amplitude at peak frequency but there was more energy at higher frequencies.
Fig. 9.
Frequency spectra for the hammer strike and induced swimbladder displacement and sound for a 432 g male toadfish for weak, medium and strong hammer hits (0.27, 0.57 and 0.81 N, respectively).
The sound spectra were highly variable and clearly not tuned to a resonant frequency (Fig. 9). They contained a number of modes, some of which appeared harmonically related, which blended together (not normal) and some sharp anti-resonances at different frequencies with different hits on the same fish. Maximal energy occurred in a relatively flat peak between 70 Hz and 164 Hz and then dropped variably ∼9 dB to 18 dB. Some of the high frequency sound energy blended in with the noise floor mean of –75 dB and ranged between –65 dB and –93 dB, particularly for softer hits. Harder hits caused the sound modes to blend together more (Fig. 9), raised the energy at all frequencies and caused a minor increase in the frequency of peak energy. Typically, the peak frequency was closely related to the period between the N1 and N2 peaks on the sound waveform, which decreased with harder hits. For instance in one fish, a hammer force of 66.8 mV with a rise time of 8.0 ms resulted in an N1–N2 interval of 13.5 ms (equivalent to a frequency of 74 Hz) and a peak frequency of 70 Hz. A more powerful hit (141 mV), with a 6 ms rise time, resulted in a 10.5 ms interval (equivalent to a frequency of 95 Hz) and a peak frequency of 94 Hz. This relationship was not always obvious because variability in the waveform made it difficult to measure the N1–N2 interval exactly.
Comparison of the frequency spectra for hammer, displacement and sound indicated some differences in response (Fig. 9). There was a progression to higher frequency energy from the hammer to the displacement to the sound waveform. At least part of this increase can be explained, as stated previously, by the structure of the original waveforms because a sound wave (full cycle) approximately equaled the time of the N1 vibration of displacement (half-cycle) and the rise time of the hammer (quarter cycle). The shapes of the decreasing energy portion of the hammer and displacement energy at higher frequencies were similar, and the ratio between them was close to unity. The low frequency peak of the sound spectrum had a low Q value averaging 1.41±0.27 (range from 0.94 to 2.5), obtained by dividing the peak frequency by the half-power bandwidth (bandwidth between points 3 dB down from the peak on each side).
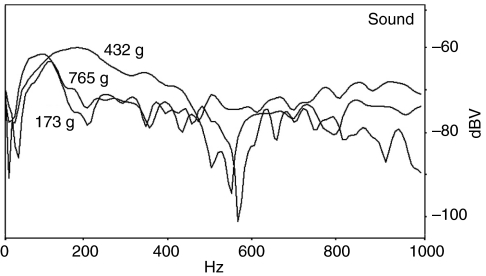
Frequency spectra for the sound of the small, medium and large fish with swimbladders ranging in mass from 3.3 g to 15.8 g (Fig. 10) indicated no effect of swimbladder size on peak frequency. The intermediate-sized fish actually exhibited the highest frequency energy, and the smallest and largest fish had similar spectra.
Fig. 10.
Frequency spectra for sounds induced from a small, medium and large toadfish by a medium force hammer hit (0.72 N for the 173 g male, 0.57 N for the 432 g male and 0.64 N for the 765 g male. Note the similar low frequency peak for the small and large fish.
Damping
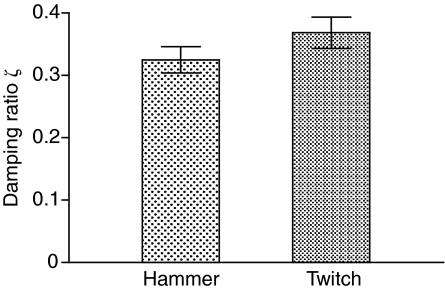
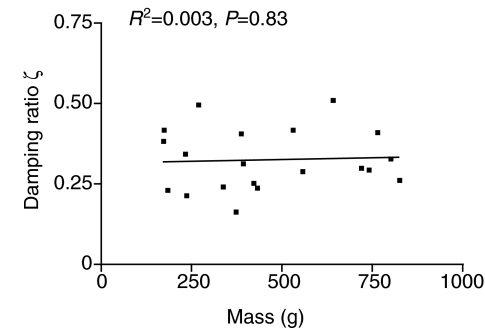
Excitation by the hammer and electrical stimulation of the sonic nerve (Fine et al., 2001) indicate that the swimbladder vibrations decayed rapidly (Figs 2 and 11). The calculated damping ratio (ζ) from a soft and a medium hit were not significantly different (t=0.548, d.f.=19, P=0.59, paired t-test), and therefore averaged for a mean of 0.325±0.021 (N=20). ζ calculated from swimbladder sounds excited by electrically stimulating the sonic muscles averaged 0.368±0.025 (N=10) and were not significantly different (t=1.24, d.f.=28, P=0.23) from those caused by hammer strike (Fig. 11). ζ did not change with fish size (Fig. 12). Q values calculated from ζ had a mean of 1.68±0.12 (range 0.98–2.17) for hammer strikes and a mean of 1.45±0.16 (range 1.09–2.80) for muscle contractions, similar to values calculated from power spectra.
Fig. 11.
Damping ratio of displacement, ζ, (mean ± s.e.m.) from fish excited by the impact hammer and for twitches from toadfish evoked by electrical stimulation of the sonic nerve (t28=1.24, NS).
Fig. 12.
Relationship of damping ratio, ζ, to fish mass.
Effect of fish size
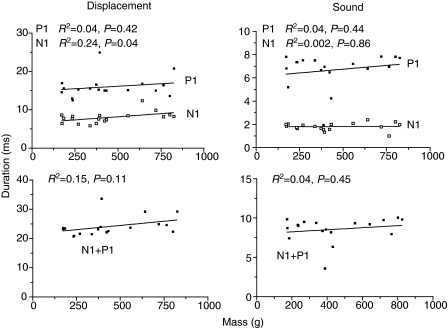
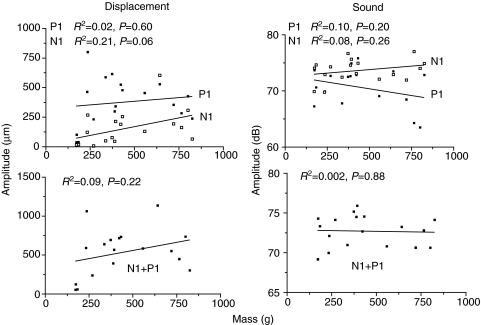
We compared values calculated from regressions for a 10 mV 0.63 N strike for each fish to examine the effects of fish size on duration and amplitude of the waveforms. The relationship of duration (Fig. 13) and amplitude (Fig. 14) of N1, P1 and N1+P1 for displacement and sound traces across fish mass were not significant with the exception of displacement N1 duration, which exhibited a weak linear relationship (R2=0.24, P=0.04). Displacement duration N1, P1 and N1+P1 averaged 8, 16 and 24 ms, respectively, and sound duration N1, P1 and N1+P1 averaged 2, 7 and 9 ms, respectively.
Fig. 13.
Relationship of displacement and sound duration (N1, P1 and N1+P1) to fish mass for a standardized 0.63 N hit.
Fig. 14.
Relationship of displacement (N1, P1 and N1+P1) and sound amplitude (N1, P1 and N1+P1) to fish mass for a standardized 0.63 N hit.
Displacement amplitude N1, P1 and N1+P1 (Fig. 14) had mean values of 152, 378 and 530 μm, respectively, and sound amplitude N1, P1 and N1+P1 (r.m.s.) averaged values of 73.7, 70.7 and 72.7 dB, respectively. Therefore, with the minor exception of N1 displacement duration, movement and sound durations and amplitudes did not vary with fish size for a standard hit of 0.63 N.
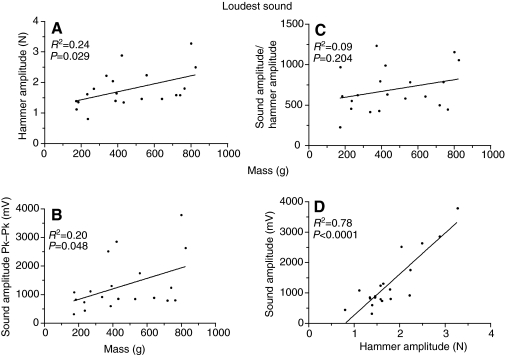
To determine if larger fish are capable of producing more intense sound, we compared values for the strike eliciting the most intense sound for each fish (Fig. 15). Limitations on swinging the miniature hammer with wrist motion caused only modest increases in force (R2=0.24, P=0.029). The small increase in hammer force resulted in a small increase in sound amplitude (R2=0.20, P=0.048). The ratio of sound amplitude to hammer amplitude did not vary with fish size but clearly sound amplitude increased with hammer amplitude for the hardest hit, and harder hits caused an exponential increase in sound amplitude, as measured in mV (Fig. 8). Therefore, larger bladders appear to be capable of producing more intense sound.
Fig. 15.
Comparison of hammer amplitude (A), sound amplitude (B, where Pk–Pk measures wave amplitude from the positive peak to the negative peak) and sound amplitude divided by hammer amplitude (linear units) (C) to fish mass for the hammer hit that evoked the most intense sound. (D) Relationship of sound amplitude to hammer amplitude (linear units) for the hits evoked by the most intense sound. The range in mV represents an increase of 22 dB.
DISCUSSION
In order to understand the toadfish swimbladder as an acoustic source and to parcel out the contribution of the swimbladder to sound properties, independent of the sonic muscles, we utilized a piezoelectric impact hammer that provides a measure of the timing and amplitude of the input force. Various fish species have a number of adaptations for sound production (Ladich and Fine, 2006) and hearing (Fay and Popper, 1999), and the hammer will allow us to examine diverse swimbladders with a comparable and quantifiable stimulus.
Interpretation of the mechanical events during a hammer strike is complicated because of separation of the hammer strike from the site used to measure displacement (Fig. 1). Striking the ventral surface of the swimbladder forces it inward (Fig. 2), increasing pressure within the bladder and producing the first wave of negative acoustical pressure (N1). This inward displacement would be greater if measured at the hammer site than at the target site and is thus underestimated. The slight delay of 1.5 ms between the onset of the strike and the start of N1 displacement probably reflects time for the bladder compression to reach the target area. Sound N1 is immediately followed by a wave of positive acoustic pressure (P1), even though the bladder is still being compressed by the hammer at the strike and measurement site. Therefore, the internal pressure is generating P1 by pushing the walls of the bladder outward outside of the impact area. After maximum force, the internal pressure and the positive acoustic pressure start to decrease. Energy in the compressed bladder rebounds to cause displacement P1, and a second much diminished cycle of sound (N2 and P2) is complete before the peak in P2 displacement. Displacement frequency and amplitude decrease markedly after the P2 peak and produce no sound signal above the background noise. Additionally, each quarter cycle of displacement becomes successively longer indicating a predominance of non-resonant movement (see below).
Similarly, sounds evoked by sonic muscle stimulation have amplitudes proportional to swimbladder velocity, and slow movements, as in the present study, fail to generate measurable sound (Fine et al., 2001). Additionally, the muscle-stimulation study noted a quadrupole type motion such that inward contraction of the c-shaped sonic muscles on the lateral walls of the swimbladder increased internal pressure, which pushed the bottom of the bladder out. Movement of the dorsal surface of the bladder is restricted because its concave surface is pinned against the backbone. These two movements, inward and outward, produced a negative and positive acoustic waveform, respectively. Therefore, despite major differences in modes of excitation, sonic muscle vs hammer, the swimbladder acts in similar ways to produce sound. Similarly, hitting the pectoral girdle of a channel catfish with the hammer produced sound with a frequency spectrum similar to that of stridulation sounds previously recorded from the same fish (Fine et al., 1997). The catfish waveform is quite different from the natural sound, and the spectrum probably represents resonant properties of the bony girdle.
Effects of hammer force
Harder hits are shorter and result in more rapid displacement and sound waveforms (Fig. 4). Total sound duration however exhibits a minor increase in duration with harder hits indicating a greater amount of energy transferred to the bladder. N1 duration for displacement and sound are both shorter than P1, and N1 sound duration does not change with hammer force. We suggest therefore that a constant internal pressure is necessary to push out the surface of the swimbladder and generate sound P1, which would explain why this value does not change with hammer force. N1 and P1 sound amplitude both increase with hammer force, and values are roughly similar, probably for different reasons. N1 is generated by a small region of the bladder exhibiting the most rapid movement, and P1 is generated by a greater surface area of bladder moving more slowly (Fig. 2). Sound amplitude exhibits an accelerating output at greater displacements (Fig. 6: N1 displacement linear units). Increased sound efficiency is probably explained by increasing bladder stiffness caused by greater resistance pressure of the internal gas to hits of greater force. Swimbladder stiffness of about 104 N m–1 is in the order of magnitude of the stiffness of a toggle spring in a circuit breaker [see p. 212 in Phelan (Phelan, 1970)].
Bladder tuning and damping
Striking the bladder produces multiple modes of frequency that blend together (Fig. 8). Peak frequency is generally low (range from 55 Hz to 172 Hz) and does not decrease with fish size. Size independence suggests that peak frequency is not determined by bladder size as would be expected for a resonant underwater bubble (Urick, 1975). In fact a peak frequency calculated from the reciprocal of the displacement waveform period (N1–N2) typically predicts the peak frequency within about 5%. Harder, and therefore quicker, hits on the same bladder cycle faster, producing a higher peak frequency. Therefore, the energy spectrum reflects the forced speed of excitation and not the natural frequency of the bladder. This finding holds true for naturally occurring sounds as well as electrically stimulated ones in which frequency is determined by the muscle contraction rate and not fish size (Skoglund, 1961; Fine, 1978; Fine et al., 2001; Waybright et al., 1990).
In addition to changing with hammer amplitude, the frequency peak is broad with a low Q averaging 1.4. Damping of the swimbladder displacement is incredibly rapid, resulting in mean ζ values of 0.33, similar to those evoked by sonic muscle stimulation (Fine et al., 2001). Q values calculated from the damping ratio (1.7 and 1.5, respectively, for the hammer and muscle stimulation) are similar to the value (1.4) calculated from the power spectrum. The low Q values result from the high degree of damping, which prevents expression of the natural frequencies of the swimbladder.
Low Q values obtained from swimbladders in underwater sound fields are often interpreted as resulting from damping by fish tissue surrounding the bladder (Batzler and Pickwell, 1970; McCartney and Stubbs, 1970). Because the swimbladder was exposed except on the dorsal surface during hammer stimulation, we interpret high damping and absence of tuning as an intrinsic property of the swimbladder. To appreciate the range in magnitude of damping in natural materials, cold, rolled, aluminium has a value of 0.0002 and rubber has a 200-fold higher damping factor of 0.04 (Steidel, 1989). The swimbladder value of 0.33 is in the range of automobile shock absorbers with ζ values of 0.1–0.5 (Steidel, 1989).
Damping and Q values in the two toadfish studies were measured in air, which decreases acoustic loading present during sound production underwater. We previously examined this problem by recording individual croaker Micropogonias undulatus in both air and water and found minor differences in call parameters (Fine et al., 2004), namely no effect on peak frequency but an extra attenuated cycle of sound and a 2-fold increase in Q. Therefore, the effects of air on acoustic properties of the bladder are real but relatively minor.
Effect of fish size
Various measures in the present study indicate that the swimbladder maintains similar acoustic properties as it increases in size. Similarly, toadfish specific gravity and percentage buoyancy remain constant with fish growth, indicating that the internal bladder volume grows proportionately with fish growth (Fine et al., 1995). Damping values, although somewhat variable, do not change with fish size (Fig. 12). Because of high damping, the frequency spectrum is determined by the forced response to the hammer rather than the natural frequency of the bladder: frequency spectra from individuals with a 6-fold range in swimbladder mass do not vary in any systematic manner. Stiffness is also relatively constant (about 104 N m–1) in fish of 300 g and greater in mass. Smaller fish are more variable and in some cases exhibit greater stiffness. Because the swimbladder membrane is not under tension at rest (Boyle's Law), stiffness appears to be caused by the back pressure of the gas compressed inside the swimbladder, which increases with hits of greater force (Fig. 7A). Since the hammer force is introduced into a smaller volume in smaller fish, small fish probably experience a greater pressure under these conditions, resulting in the greater stiffness.
With the minor exception of displacement N1 duration, displacement and sound duration do not change with fish size. Displacement N1 duration does increase slightly with fish size (Fig. 13), probably because of increased time for pressure to build enough to reflect the hammer strike. In fact similarity in acoustic behavior in different sized fish is indicative of similar hammer speeds and energy transferred to the bladder for the same force hit. Similar inputs yield similar outputs.
Some of the variability between fish undoubtedly results from variability in the hammer strike and the positioning of the laser and the target. The swimbladder has a curved surface so that movement is not restricted to orthogonal planes. In natural sound, sonic muscle contraction pushes the sides in, which pushes the bottom out (Fine et al., 2001), indicating a nodal zone of no movement between these two motions. Additionally, the confluence of the two anterior chambers of the bladder damps movement in the rostromedial bladder (Barimo and Fine, 1998), and the attachment of the muscle could serve to cause local variation in vibrations.
Although our result of equal sound amplitude makes sense under these experimental conditions, a larger swimbladder should be capable of generating greater sound pressure. We explored this hypothesis by examining the strike in each fish that generated the most intense sound. Not surprising there was considerable variation between fish (Fig. 15). The hammer amplitude increased barely with fish size. This slight increase was dictated by the wrist motion involved in swinging the hammer, which did not permit much greater force for larger targets. There was a 22 dB increase in sound amplitude with fish size for these maximal hits but the transfer function of sound amplitude per hammer force (linear units) was not significant. This analysis suggests that a mechanism capable of introducing greater forces to larger bladders would result in more intense sound.
Sexual dimorphism, fish growth and acoustic communication
Both the swimbladder and sonic muscles grow for life (Fine, 1975; Fine et al., 1990; Fine et al., 1993). Although females were not featured in this study, both the swimbladder and the muscles grow larger in males (Fine, 1975; Fine et al., 1990). There is a period of equal growth rate in juveniles that will become males and females, after which the growth rate in females decelerates. Increase in linear dimensions, of course means an increase in surface area of the swimbladder, which acts as the acoustic radiator, will be larger in males than in females.
Fundamental frequency of toadfish boatwhistles is determined by a pattern generator in the spinal cord (Demski, 1981; Bass and Baker, 1990; Bass and McKibben, 2003), which determines the contraction rate of the sonic muscles. Choruses of toadfish boatwhistles have a restricted range of fundamental frequencies during the peak of the mating season, often within 10 Hz, even though there is likely to be a large size range in the calling fish (Fine, 1978). Therefore, our finding that sound frequency is not related to bladder size agrees with findings in nature. Swimbladder displacement and sound amplitude produced by muscle twitches increase in larger fish (Fine et al., 2001). Further, the dominant frequency of hand-held grunts in toadfish does not vary with fish size (Waybright et al., 1990). Sound amplitude is determined by the volume velocity of an acoustic radiator (Bradbury and Vehrencamp, 1998), which is governed by its surface area and speed of movement. Because the swimbladder increases in size, and larger sonic muscles are capable of contracting with greater amplitude in the same time window, both contribute to the sound amplitude of males. Sexual dimorphism of sonic muscle and swimbladder size will allow males to produce a more intense sound in the competition of calling males to attract females. More intense boatwhistles will propagate further underwater (Fine and Lenhardt, 1983) and probably contribute to female mate choice in water of low visibility in which it may be difficult to view the males in the chorus before making her choice.
Acoustically, fish swimbladders have long been considered to function as underwater bubbles that are excited to pulsate at their resonant frequency (Bergeijk, 1964; Harris, 1964). Because of their small size compared with the wavelength of low frequency sound underwater (a 200 Hz sound would have a 7.5 m wavelength), swimbladders have been considered acoustic monopoles that produce an omnidirectional sound field. Due to the compressibility of gas in the bladder compared with the surrounding water, an acoustic pressure wave is historically believed to excite the bladder into vibration, which is transferred to the ears. This and other recent studies appear to indicate that all of these generalizations are incorrect when applied to the toadfish. The present work indicates that the bladder has a high intrinsic damping that inhibits the expression of resonance. Toadfish sonic muscles push in the swimbladder resulting in quadrupole motion and not that of a pulsating bubble (Fine et al., 2001). This motion, with parts of the swimbladder moving in opposite directions (in and out in muscle or hammer-stimulated sound) is inefficient, and the fish does not experience the benefits or limitations associated with a resonant structure. Resonance would be detrimental to the time fidelity of audition and would compromise rapid toadfish responses to acoustic signals (Fish, 2002; Thorson and Fine, 2002; Fine and Thorson, 2008).
We hypothesized that this inefficient mode of sound production required the development of incredibly fast fish sonic muscles, as a means of exciting the bladder to produce audible sound (Fine et al., 2001). Rather than functioning as a monopole, boatwhistles in nature radiate with a directional component that mirrors the heart shape of the swimbladder (Barimo and Fine, 1998), which we interpret as an adaptation to avoid stimulating the ears. Further, deflating the swimbladder does not change auditory thresholds or waveforms of evoked potentials (Yan et al., 2000), suggesting that the bladder does not have an auditory function in the oyster toadfish. Recent work in the weakfish, an unrelated fish in the family Sciaenidae, indicates, that as in the toadfish, its call frequency is determined by the contraction time of its sonic muscles and not the natural frequency of the swimbladder (Connaughton et al., 2000). This body of literature suggests the need for reassessment of the acoustic role of swimbladders in various fish species and the need for experimentation.
This work was supported by supported by NIH DCO 1083 and the Virginia Marine Resources Commission. Deposited in PMC for release after 12 months.
References
- Barimo, J. F. and Fine, M. L. (1998). Relationship of swim-bladder shape to the directionality pattern of underwater sound in the oyster toadfish. Can. J. Zool. 76, 134-143. [Google Scholar]
- Bass, A. H. and Baker, R. (1990). Sexual dimorphisms in the vocal control system of a teleost fish: morphology of physiologically identified neurons. J. Neurobiol. 21, 1155-1168. [DOI] [PubMed] [Google Scholar]
- Bass, A. H. and McKibben, J. R. (2003). Neural mechanisms and behaviors for acoustic communication in teleost fish. Prog. Neurobiol. 69, 1-26. [DOI] [PubMed] [Google Scholar]
- Batzler, W. E. and Pickwell, G. V. (1970). Resonant acoustic scattering from gas-bladder fishes. In Proceedings of an international symposium on biological sound scattering in the ocean (ed. G. B. Farquhar), pp. 168-179. Washington, D.C.: U.S. Government Printing Office.
- Bergeijk, W. A. v. (1964). Directional and nondirectional hearing in fish. In Marine bio-acoustics (ed. W. N. Tavolga), pp. 281-299. New York: Pergamon Press.
- Bradbury, J. W. and Vehrencamp, S. L. (1998). Principles of Animal Communication. Sunderland, MA: Sinauer Associates.
- Connaughton, M. A., Taylor, M. H. and Fine, M. L. (2000). Effects of fish size and temperature on weakfish disturbance calls: implications for the mechanism of sound generation. J. Exp. Biol. 203, 1503-1512. [DOI] [PubMed] [Google Scholar]
- Connaughton, M. A., Fine, M. L. and Taylor, M. H. (2002). Weakfish sonic muscle: influence of size, temperature and season. J. Exp. Biol. 205, 2183-2188. [DOI] [PubMed] [Google Scholar]
- Demski, L. S. (1981). Neural control of teleost sound production. In Hearing and sound communication in fishes (ed. W. N. Tavolga, A. N. Popper and R. R. Fay), pp. 427-445. New York: Springer.
- Fay, R. R. and Popper, A. N. (1999). Comparative Hearing: Fish and Amphibians. New York: Springer.
- Feher, J. J., Waybright, T. D. and Fine, M. L. (1998). Comparison of sarcoplasmic reticulum capabilities in toadfish (Opsanus tau) sonic muscle and rat fast twitch muscle. J. Muscle Res. Cell Motil. 19, 661-674. [DOI] [PubMed] [Google Scholar]
- Fine, M. L. (1975). Sexual dimorphism of the growth rate of the swimbladder of the oyster toadfish Opsanus tau. Copeia 1975, 483-490. [Google Scholar]
- Fine, M. L. (1978). Seasonal and geographic variation of the mating call of the oyster toadfish Opsanus tau. Oecologia 36, 45-57. [DOI] [PubMed] [Google Scholar]
- Fine, M. L. and Lenhardt, M. L. (1983). Shallow-water propagation of the toadfish mating call. Comp. Biochem. Physiol. 76A, 225-231. [DOI] [PubMed] [Google Scholar]
- Fine, M. L. and Thorson, R. F. (2008). Use of passive acoustics for assessing behavioral interactions in individual toadfish. Trans. Amer. Fish. Soc. 137, 627-637. [Google Scholar]
- Fine, M. L., Burns, N. M. and Harris, T. M. (1990). Ontogeny and sexual dimorphism of the sonic muscle in the oyster toadfish. Can. J. Zool. 68, 1374-1381. [Google Scholar]
- Fine, M. L., Bernard, B. and Harris, T. M. (1993). Functional morphology of toadfish sonic muscle fibers: relationship to possible fiber division. Can. J. Zool. 71, 2262-2274. [Google Scholar]
- Fine, M. L., McKnight, J. W. and Blem, C. R. (1995). The effect of size and sex on buoyancy in the oyster toadfish. Mar. Biol. 123, 401-409. [Google Scholar]
- Fine, M. L., King, C. B., Friel, J. P., Loesser, K. E. and Newton, S. (1997). Pectoral spine locking and sound production in the channel catfish (Ictalurus punctatus). Copeia 1997, 777-790. [Google Scholar]
- Fine, M. L., Malloy, K. L., King, C. B., Mitchell, S. L. and Cameron, T. M. (2001). Movement and sound generation by the toadfish swimbladder. J. Comp. Physiol. 187A, 371-379. [DOI] [PubMed] [Google Scholar]
- Fine, M. L., Schrinel, J. and Cameron, T. M. (2004). The effect of loading on disturbance sounds of the Atlantic croaker Micropogonius undulatus: air vs water. J. Acoust. Soc. Amer. 116, 1271-1275. [DOI] [PubMed] [Google Scholar]
- Fish, J. F. (1972). The effect of sound playback on the toadfish. In Behavior of marine animals, Vol. 2 (eds H. E. Winn and B. Olla), pp. 386-434. New York: Plenum Press. [Google Scholar]
- Harris. G. G. (1964). Considerations on the physics of sound production by fishes. In Marine bio-acoustics (ed. W. N. Tavolga), pp. 233-247. New York: Pergamon Press.
- Ladich, F. and Fine, M. L. (2006). Sound-generating mechanisms in fishes: a unique diversity in vertebrates. In Communication in fishes (ed. F. Ladich et al.), pp. 3-43. Enfield, New Hampshire: Science Publishers.
- Maruska, K. P. and Mensinger, A. F. (2009). Acoustic characteristics and variations in grunt vocalizations in the oyster toadfish Opsanus tau. Env. Biol. Fish 84, 325-337. [Google Scholar]
- McCartney, B. S. and Stubbs, A. R. (1970). Measurement of the target strength of fish in dorsal aspect, including swimbladder reonance. In Proceedings of an International Symposium on Biological Sound Scattering in the Ocean (ed. G. B. Farquhar), pp. 180-211. Washington, D.C.: U.S. Government Printing Office.
- Phelan, M. (1970). Fundamentals of Mechanical Design. New York: McGraw Hill.
- Rome, L. C. (2006). Design and function of superfast muscles: new insights into the physiology of skeletal muscle. Annu. Rev. Physiol. 68, 193-221. [DOI] [PubMed] [Google Scholar]
- Skoglund, C. R. (1961). Functional analysis of swimbladder muscles engaged in sound productivity of the toadfish. J. Biophys. Biochem. Cytol. 10, 187-200. [DOI] [PMC free article] [PubMed] [Google Scholar]
- Steidel, R. F. (1989). An Introduction to Mechanical Vibration. New York: Wiley.
- Tavolga, W. N. (1958). Underwater sounds produced by two species of toadfish Opsanus tau and Opsanus beta. Bull. Mar. Sci. 8, 278-284. [Google Scholar]
- Thorson, R. F. and Fine, M. L. (2002). Acoustic competition in the gulf toadfish Opsanus beta: acoustic tagging. J. Acoust. Soc. Amer. 111, 2302-2307. [DOI] [PubMed] [Google Scholar]
- Urick, R. J. (1975). Principles of Underwater Sound. New York: McGraw-Hill.
- Waybright, T. D., Kollenkirchen, U. and Fine, M. L. (1990). Effect of size and sex on grunt production in the oyster toadfish. Abstr. Soc. Neurosci. 16, 578. [Google Scholar]
- Weston, D. E. (1967). Sound propagation in the presence of bladder fish. In Underwater acoustics, vol 2 (ed. V. M. Albers), pp. 55-88. New York: Plenum Press. [Google Scholar]
- Winn, H. E. (1972). Acoustic discrimination by the toadfish with comments on signal systems. In Behavior of Marine Animals: Current Perspectives in Research, Vol. 2. Vertebrates (ed. H. E. Winn and B. L. Olla), pp. 361-385. New York: Plenum Press.
- Yan, H. Y., Fine, M. L., Horn, N. S. and Colón, W. B. (2000). Variability in the role of the gasbladder in fish audition. J. Comp. Physiol. 187A, 371-379. [DOI] [PubMed] [Google Scholar]


