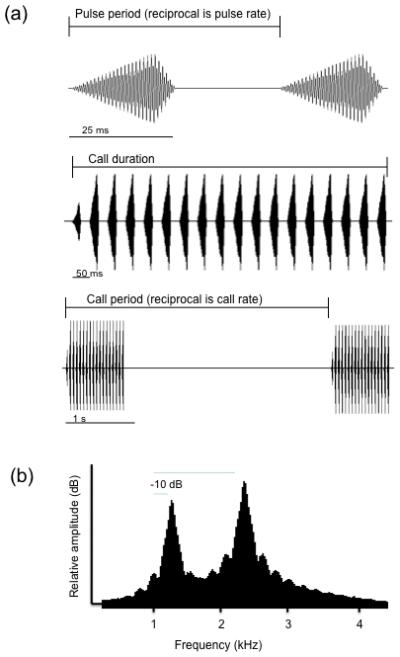
Figure 1.

Acoustic properties of the standard synthetic stimulus. (A) Temporal properties as shown by oscillograms. Top trace: two pulses showing the pulse period (the reciprocal is the pulse rate); in alternatives, the pulse duty cycle (ratio of pulse duration to pulse period) was also 50%; Middle trace: a complete call of 18 pulses; call duration of alternatives was mainly determined by pulse number, and influenced by pulse rate such that call duration of alternatives was shorter in calls with higher pulse rates and longer in calls with lower pulse rates. Bottom trace: two complete calls showing the call period (the reciprocal is the call rate); call period in alternatives was not affected by variation in any other temporal property. (B) Spectral properties as shown by the power spectrum of one call. The frequency of both components was varied in alternatives, but the harmonic relationship (2:1) was maintained. The relative amplitude (RA) of the two peaks was also varied in alternatives; high values of RA indicate that the amplitude favoring the high-frequency peak was greater than the usual 10 dB difference; low values indicate the amplitudes of the two peaks were more nearly equal.
