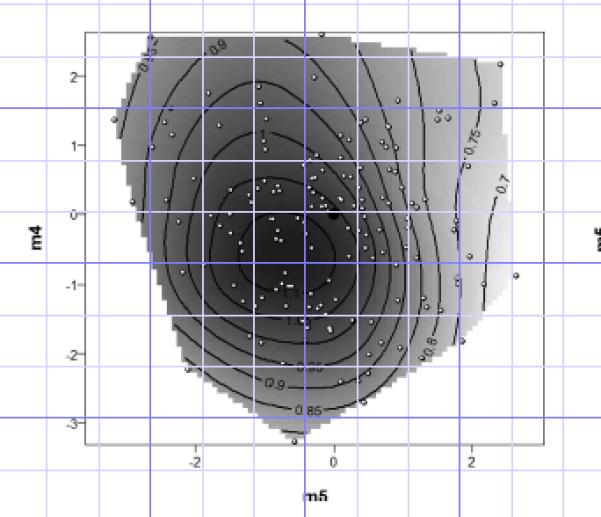
Figure 2.

The contour plot of the fitness surface on the two eigenvectors of significant stabilizing selection, m5 and m4. White dots with black outline are the values of the stimulus calls played to females. The black circle is the value of the standard call. Numbers on contours are in units of the phonotaxis score (response time to standard call divided by response time to alternative call). This score equals one if the mean response times are the same (i.e., no preference), >1 if the female responded more rapidly to the alternative call, and < 1 if the female responded more rapidly to the standard call.
