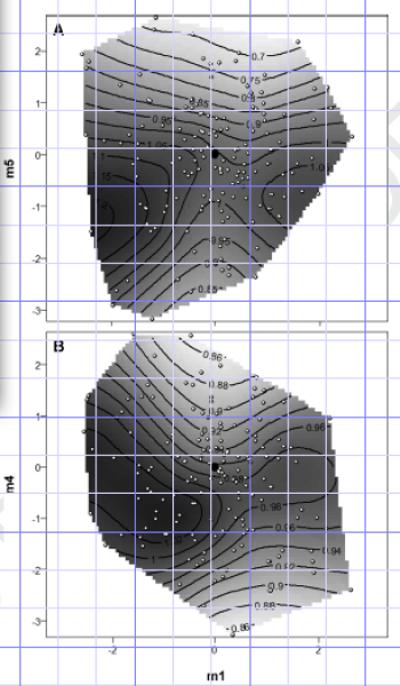
Figure 3.

Contour plots of the fitness surface on the single significant axis of disruptive selection m1, against each of the two eigenvectors of significant stabilizing selection, m5 (a) and m4 (b). White dots with black outline are the values of the stimulus calls played to females. The black circle is the value of the standard call.
