Abstract
A baseline T10 value is typically needed for dynamic contrast-enhanced (DCE-) MRI studies. However, an assumed baseline T10 has to be used when T10 measurements for patients are not available. In this work, we systematically investigate the dependence on T10 of the commonly used DCE-MRI parameters (Ktrans, kep, ve and IAUC) as well as several new-defined parameters (the normalized ratios of kep, Ktrans and ve, which are measures of relative changes in these parameters between two time points) for a spoiled gradient echo pulse sequence using simulations and in vivo studies. Effects of various factors on the T10-dependence, such as the true T10 value, flip angle and the potential changes in T10 due to treatment were also assessed using simulations. We found that DCE-MRI parameters, kep and the normalized ratio of kep, are largely independent of T10, especially when larger flip angles are used (e.g. 30–40°). Their estimations therefore do not require any knowledge of T10. The normalized ratios of Ktrans, ve and IAUC also exhibit independence to T10, but only when T10 remains constant between pre- and post-treatment. The estimation of parameters themselves (Ktrans, ve and IAUC) are highly dependent on the T10 value.
Keywords: DCE-MRI, dynamic contrast-enhanced imaging, perfusion, T1, IAUC, Tofts model
1. Introduction
Dynamic contrast-enhanced- (DCE-) MRI is a technique by which images are acquired during intravenous injection of a gadolinium contrast agent to assess the vascular characteristics of tissues. DCE-MRI is commonly used in cancer diagnosis, in which DCE-MRI-based measures correlate well with tumor angiogenesis [1–6]. DCE-MRI is also used to assess cancer drug efficacy by comparing findings from imaging acquired before and after therapy [7, 8]. DCE-MRI has also been applied in assessing cerebral [9] and cardiac [10] ischemia.
Although DCE-MRI is growing in importance in many clinical applications, repeatability is a major limiting factor preventing it from being used in wider applications and clinical trials [11–13]. One factor that drastically limits repeatability is the intrinsic baseline T10. A T10 is generally required for quantitative [14] and semi-quantitative analyses [15] to determine DCE-MRI kinetic parameters, and any error in T10 measurement can be magnified in the resulting parameters.
There are several techniques available for assessing T10. One accurate method is the inversion recovery (IR) technique, but IR methods for T10 assessment often require long scan times, particularly when large volume coverage is desired [16]. A more efficient technique is the variable flip angle method, which uses a set of gradient recalled-echo images with different flip angles [17–19]. However, errors caused by radiofrequency field inhomogeneity or uncertainty can be significant when using this method [19]. Even though the actual flip angle could be measured to correct for field inhomogeneity to some extent [20], T10 measurement is still problematic due to other factors, such as imperfect slice profile. In large clinical studies, T10 measurements for some patients may also not be reliable or available due to either motion or other factors. An assumed T10 value has to be used in DCE-MRI analyses when a measured T10 is not available.
Given the difficulty of assessing the baseline T10, Haacke et al. [13] recently presented a parameter, NR50, which is independent of T10. NR50 represents the relative change in the median of the initial area under the signal-time curve (IAUC) for assessing drug effectiveness by comparing pre- and post-treatment findings. T10 independence of NR50 assumes that T10s are unchanged pre- and post-treatment. But this assumption may not be generally true when treatment is involved.
DCE-MRI kinetic parameters (Ktrans, kep, ve and IAUC) are commonly used in cancer diagnosis [14, 15, 21, 22]. The computation of Ktrans, ve and IAUC requires T10 [14, 15]. The computation of kep, however, does not require T10 when linearity between signal enhancement and concentration could be assumed using T1-weighted spin-echo or saturation/inversion recovery approaches [23–27]. Currently, the spoiled gradient echo pulse sequence is widely used in DCE-MRI studies to achieve good temporal resolution and volumetric coverage. However, for a spoiled gradient echo pulse sequence the signal increase with concentration is nonlinear, and T10 may be required to convert the signal to a concentration and compute kep [27].
In this paper, we have also defined several new characteristic parameters, the normalized ratios (NR) of Ktrans, kep, ve and IAUC, which are measures of the relative change in parameter values between two time points (pre- and post-treatment). We evaluate the assumed T10 independence of these parameters, Ktrans, kep, ve, IAUC and its NRs for a gradient echo pulse sequence using simulations. T10-independent properties of all the parameters and several potentially influencing factors are also investigated using simulations and in vivo human studies.
2. Methods
In DCE-MRI, the tracer concentration in the tissue, Ct, also called tissue enhancement curve (TEC), can be described by Tofts' model [28], one of the modified Kety models [29].
| (1) |
where Cp is the tracer concentration in the blood plasma, vp is the blood plasma volume, Ktrans is the volume transfer constant between the blood plasma and tissue, ve is the volume of the extravascular extracellular space per unit volume of tissue, kep = Ktrans/ve is the rate constant between extravascular extracellular space and blood plasma, and ⊗ represents a convolution. Cb = Cp·(1-Hct) is the tracer concentration in the blood, also called AIF (arterial input function). The hematocrit (Hct) is typically assumed to equal to 0.42 [30]. vb = vp/(1-Hct) is the whole blood volume and was assumed to be 0.05.
While absolute values of the above DCE-MRI kinetic parameters may be of some interest in cross-sectional studies, the relative change in these parameters subsequent to therapy may be an additional pertinent measure of treatment effects in serial studies. For this purpose, analogous to the definition of NR50 [13], which is the normalized ratio of IAUC, three new parameters, the normalized ratios (NR) of kep, Ktrans, and ve, were defined as the following:
| (2) |
where P represents perfusion parameters (kep, Ktrans, and ve) and superscripts designate pre- and post-treatment values. For comparison purposes, the NR of IAUC-60 (the integration of TEC across 60 seconds) was also computed.
2.1 Simulation Studies
A series of simulations were performed to investigate how the parameters (kep, Ktrans, ve and IAUC) and the newly defined parameters (NRs of kep, Ktrans, ve and IAUC) depend on the baseline T10 and which factors, among true T10 values, flip angles, and T10 changes caused by treatment affected this relationship when using standard gradient echo pulse sequences.
An AIF was generated according to the experimentally derived functional form [30], which is based on a population-averaged high-temporal-resolution AIF measurement:
| (3) |
where α is 1.05 mmol; β is 0.1685 min−1; s is 38.078 min−1; τ is 0.483 min; A1 is 14.3694 mmol; A2 is 2.5 mmol; τ1 is 0.17046 min; τ2 is 0.365 min; σ1 is 0.0563 min; and σ2 is 0.132 min [30]. TECs were generated according to Eq. (1) using various Ktrans and ve or kep values.
The tracer concentration in the tissue, Ct, was then generated using this AIF and given kinetic parameters (Ktrans, ve, and vb) according to equation (1). The tracer concentration (Ct or Cb) is linearly proportional to the change in the relaxation rate (ΔR1) [31, 32]. The change in the relaxation rate can be converted to the normalized signal intensity according to the spoiled gradient-echo signal equation (4).
| (4) |
where R10 = 1/T10 is the baseline relaxation rate and M0 is equilibrium magnetization. TR = 4 ms and θ = 15° were used in this conversion with a given true T10 (= 800ms, unless otherwise noted). The normalized signal intensity curves were then converted back to tracer concentration curves using equation (4) with assumed T10 values from 200 to 2000 ms. Kinetic parameters were subsequently computed using these tracer concentration curves according to equation (1).
In our simulation, T10 independence of Ktrans, kep, ve and IAUC-60 was first investigated for the spoiled gradient echo pulse sequence, and the relationship between the RF flip angle θ and the nonlinearity of signal with the relaxation rate change (ΔR1) was examined. Second, T10 independence of NRs of Ktrans, kep, ve and IAUC-60 was identified. Finally, the effects of three key factors (true T10 values, flip angles and T10 changes caused by treatment (ΔT10=T10_pre-T10_post)) on T10 independence were investigated.
2.2 Human Studies
For in vivo studies, DCE-MRI data from six pediatric patients aged from 11 to 16 with osteosarcoma treated on a phase II trial of multi-agent chemotherapy acquired previously from 1999 to 2008 were utilized. Prior institutional review board approval and informed consent were obtained. DCE-MRI images were acquired on a 1.5 T Siemens Symphony scanner at presentation (before chemotherapy, week 0) and at week 12. After selection of the single slice that best showed the tumor, images were acquired before, during, and after bolus injection into a central line of a 0.1 mmol/kg dose of Gd-DTPA, followed by a saline flush. Thirty sequential FLASH images (TR[TE=23/10 ms, 40°flip angle, xres/yres = 256/256, 10 mm thickness, 40–50 cm FOV, 2 acquisitions) were collected over a 6.5 minute period. Tumor regions of interest (ROIs) for all patients were drawn by an experienced radiologist. A measured AIF was not available for these patients and AIF shown in Eq. (3) was used for the computation of Ktrans and ve.
The baseline T10 was measured prior to the DCE-MRI scan using the optimized IR method [16]. A turbo inversion recovery (TIR) pulse sequence was used to acquire four images with different TIs, 100, 500, 900 and 2400 ms. The TIR protocol was as follows: single slice with 10 mm thickness; TR/TE = 2500/60 ms; xres/yres = 256/192; 40–50 cm FOV the same as DCE-MRI images; echo train length was 11; ~45 seconds for each acquisition. Occasionally, IR images were corrupted by large patient movements which caused the slice position to shift dramatically and T10 could not be computed.
3. Results
3.1 Simulation Studies
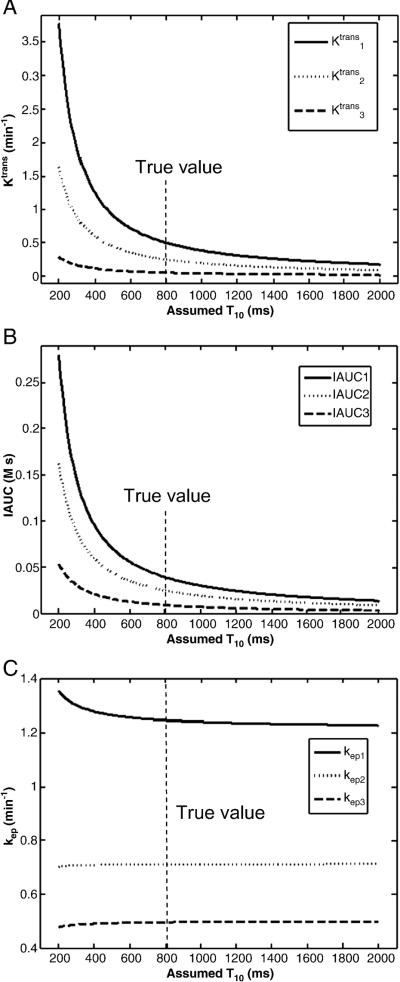
Figure 1 shows the simulation results of the baseline T10 dependence of Ktrans, kep and IAUC-60 for three different true values. Ktrans and IAUC-60 shown in Fig. 1 (a, b) were highly dependent on the assumed T10 value and they approach the true values only when the assumed T10 was near the true T10 (800 ms). However, kep was nearly independent of T10 shown in Fig. 1c, and any assumed T10 within a large range (500 to 2000 ms) can give accurate kep estimation. ve, which is equal to Ktrans/kep, had the same pattern of T10 dependency as Ktrans and was thus not shown here.
Fig. 1.
Plots of Ktrans (a), IAUC (b) and kep (c) vs. assumed baseline T10 when the true T10=800 ms. The y-axis represents the computed Ktrans (or IAUC or kep) values when an assumed T10 (x-axis) is used. For each plot, the three curves represent results for three different true values as follows: True Ktrans values are 0.5, 0.25 and 0.05 min−1, respectively; true IAUC are 0.039, 0.025 and 0.009 M·s, respectively; and true kep values are 1.25, 0.7143 and 0.5 min−1, respectively.
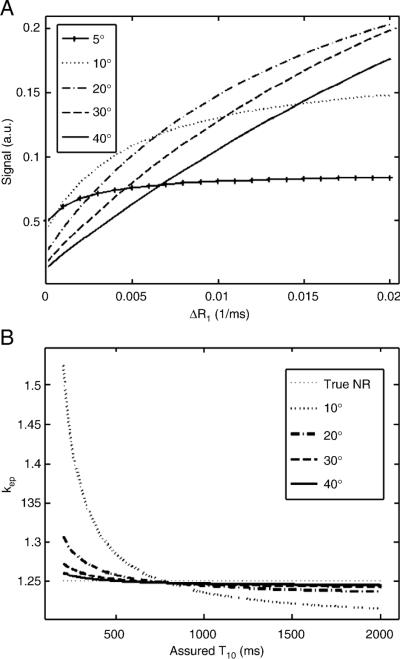
The nonlinear relationship between the signal and the change of the relaxivity rate (ΔR1) (i.e. the concentration) for different flip angles using a spoiled gradient echo pulse sequence is shown in Fig. 2. The results in Fig. 2a show that there existed strong nonlinearity between the signal and ΔR1 for small flip angles; however, the relationship became more linear as the flip angle increased. When the signal is linearly proportional to the concentration, kep is independent of T10 [23, 25]. This was consistent with the results shown in Fig. 2b, in which kep appeared independent of the assumed T10 at larger flip angles, e.g. 40°. But even with smaller flip angles, kep was nearly constant when the assumed T10 was larger than 500 ms.
Fig. 2.
Nonlinearity changes as flip angle. (a) The relationship between the signal amplitude and ΔR1 becomes more linear as flip angle becomes larger; (b) kep is less dependent on T10 at larger flip angles. TR of 4 ms was assumed.
Fig. 3 shows that the normalized ratios (NRs) of kep, Ktrans, ve and IAUC were largely independent of the assumed T10 when the true T10s were assumed to be the same for pre- and post-treatment, i.e. the chemotherapy does not change T10. Within a large range from about 500 to 2000 ms, any assumed T10 can yield accurate parameter estimation when the true T10 is 800 ms.
Fig. 3.
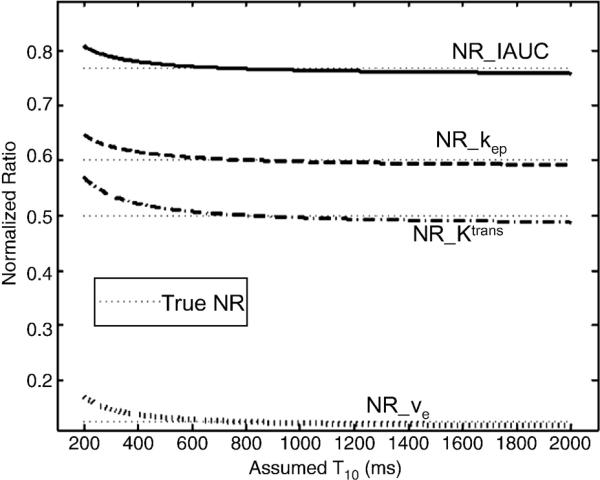
Plots of the normalized ratios of IAUC, kep, Ktrans and ve. True NRs are 0.77, 0.6, 0.5 and 0.125, respectively (dotted lines). The same true T10 (800 ms) was assumed for both pre- and post-treatment.
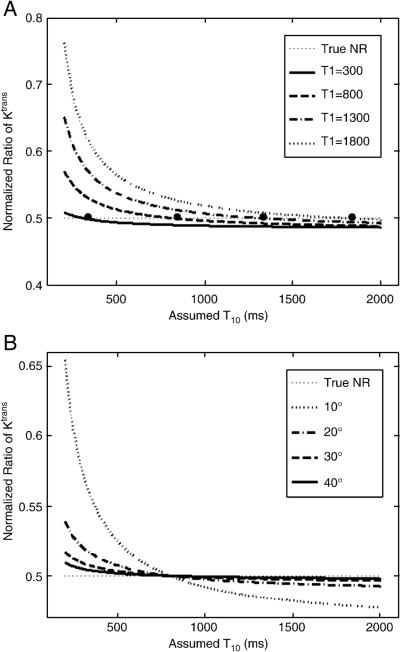
T10 independence of the normalized ratios could vary with the true T10. Fig. 4a shows the independence of the normalized ratio of Ktrans for four different true T10s (300, 800, 1300 and 1800 ms). NR with smaller true T10 had better T10 independence, while larger true T10 values led to larger errors when low T10 values were assumed. However, assuming a T10 larger than the true T10 (e.g. 1000–1500 ms) can give more accurate estimations. Another factor, the flip angle, will also affect T10 independence of the normalized ratios. NRs of Ktrans for four different flip angles are shown in Fig. 4b, where T10 independence was higher for larger flip angles. The normalized ratios of kep, ve and IAUC generally behave similarly as NR of Ktrans, and therefore are not shown here.
Fig. 4.
Plots of the normalized ratios of Ktrans for the different true T10 values (a) and flip angles (b). The true NR of Ktrans is 0.5. The same true T10s were assumed for both pre- and post-treatment. The large dots are the true NRs for the different true T10s. The normalized ratios of kep, ve and IAUC also have similar relationships as the normalized ratio of Ktrans and are not shown.
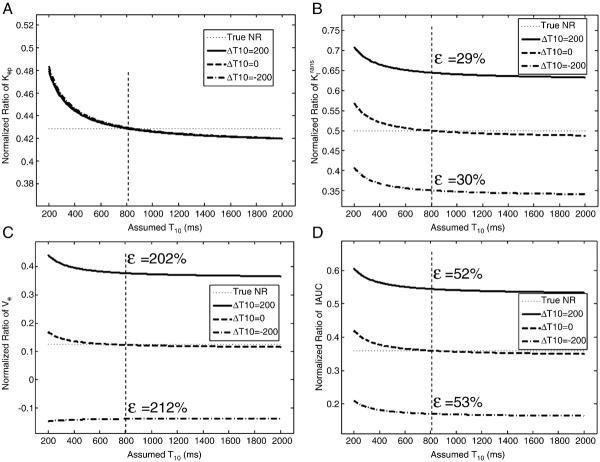
Baseline T10s for pre- and post-treatment were often assumed to be the same when T10 measurements were not available. However, this assumption may generally not be valid. Table 1 shows average T10 values within whole tumor ROIs from the six osteosarcoma patients without motion. According to the table, chemotherapy treatment can lead to substantial changes in T10, e.g. over 300 ms change between pre- and post-treatment in some cases. Effects of T10 changes on the normalized ratios were investigated using simulations and the results are shown in Fig. 5. The normalized ratio of kep was insensitive to this T10 change as shown in Fig. 5a. However, this T10 change could cause much larger errors in the normalized ratios of Ktrans, ve and IAUC as shown in Fig. 5 (b–d). Figure 6 shows that the error in the NR of kep was almost constant while the errors of the three normalized ratios (Ktrans, ve and IAUC) changed significantly with the percentage change in T10. These results indicate that unless it is known that T10 does not change following treatment, the normalized ratios of Ktrans, ve and IAUC cannot be reliably utilized using an assumed value.
Table 1.
Averaged baseline T10 values for pre- and post-treatment from six Osteosarcoma patients.
| Patient | T10_pre (ms) | T10_post (ms) | ΔT10 (ms) |
|---|---|---|---|
| 1 | 1326 | 960 | 366 |
| 2 | 1359 | 1001 | 358 |
| 3 | 1300 | 1190 | 110 |
| 4 | 1154 | 1066 | 88 |
| 5 | 1434 | 1465 | 31 |
| 6 | 1157 | 1197 | 30 |
Fig. 5.
Effects of changes in baseline T10 following treatment. Plots of the normalized ratios of kep (a), Ktrans (b), ve (c) and IAUC (d) with different pre- and post-treatment baseline T10 values. True NRs are 0.0.429, 0.5, 0.125 and 0.36, respectively. A change in T10 between pre- and post-treatment is calculated as ΔT10=T10_pre-T10_post. A true T10 = 800 ms was assumed for pre-treatment. ε represents the percentage error at assumed constant T10 = 800 ms.
Fig. 6.
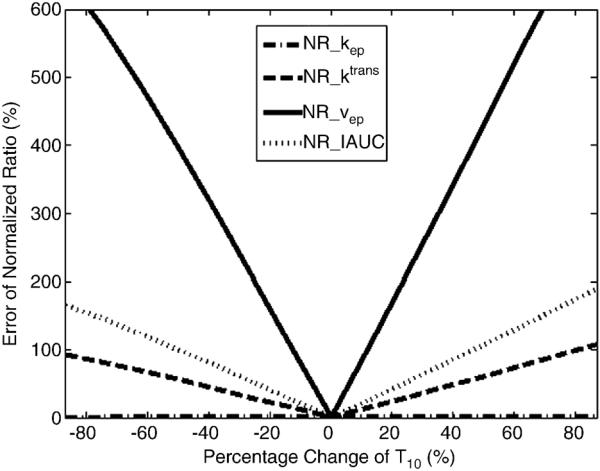
Plots of the error of normalized ratios vs. percentage change of T10. The true T10_pre is fixed to 800 ms. The percentage change of T10 is equal to (T10_pre-T10_post)/T10_pre.
3.2 Human Studies
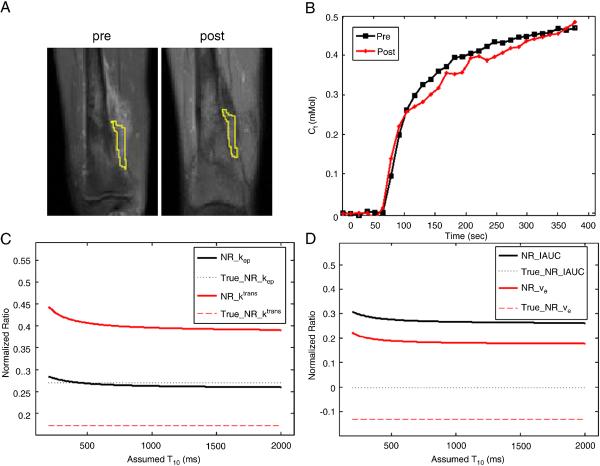
Results from one of the osteosarcoma patients without motion are demonstrated in Fig. 7. Fig. 7a shows the pre- and post-treatment post-contrast images near the knee with tumor ROIs outside the bone. Even though the shape of tumor outside the bone has slightly changed, two similar ROIs were selected in a relative homogeneous region. Average T10 and kinetic parameters (kep, Ktrans, ve and IAUC) were computed for the two ROIs. Average T10 values within the selected ROIs were 1512.6 and 1136.3 ms, respectively for pre- and post-treatment yielding ΔT10 of 376.3 ms. Fig. 7b shows the average concentration curves for the ROIs, and Figs. 7c and 7d show the normalized ratios of kep, Ktrans, ve and IAUC. The solid lines represented the results assuming T10s for pre- and post-treatment were the same; the dotted lines represented the results using actual measured baseline T10s.
Fig. 7.
Results from one of the osteosarcoma patients. (a) Similar tumor ROIs on pre- and post-treatment images were used. (b) Mean concentration curves computed using measured baseline T10 for both ROIs in (a). Plots of the normalized ratio of kep and Ktrans (c) and of IAUC and ve (d) with the same assumed T10 for pre- and post-treatment in comparison with true NR using measured T10.
4. Discussion
Baseline T10 is necessary to obtain accurate lesion kinetic parameters in DCE-MRI studies. However, physiologic or voluntary motion can often cause large errors or even corrupt T10 measurements, especially for 3D volume measurements. Errors in the flip angle and imperfect slice profiles can yield large uncertainties in T10 measurements as well when using the variable flip angle (VFA) method. Ktrans, kep, ve and IAUC are commonly used in cross-sectional DCE-MRI studies [14, 15], and accurate T10 values were required for the computation of these parameters. However, accurate kep could be estimated without T10 measurements using assumed values, and its accuracy is improved when larger flip angles were utilized. On the other hand, SNR of pixel-wise kep calculations could be improved by forcing all measured T10 values from the selected ROI to be equal to a fixed value close to that the actual measured T10 value according to a recent study [13].
Normalized ratios of kep, Ktrans, ve and IAUC could be used to estimate the treatment effects of the chemotherapy in longitudinal DCE-MRI studies if the change of T10 during therapy is negligible. While the normalized ratios were largely T10-independent when T10 values for pre- and post-treatment were assumed to be the same, any changes in T10 due to treatment could generate large errors in normalized ratios of Ktrans, ve and IAUC. On the other hand, the normalized ratio of kep was almost completely independent of T10 and its change between pre- and post-treatment.
The actual T10 value and flip angle affected the T10-independent property of normalized ratios of kep, Ktrans, ve and IAUC. While T10-independence almost held for variations in actual T10 values and flip angles, the computed normalized ratios could still be significantly different affected by different flip angles and assumed T10s. Therefore, additional care must be taken to control for these factors. For example, a larger assumed T10 than the possible true one (e.g. 1000ms for muscle) could be used to compute normalized ratios; and a larger flip angle could be used to keep a better T10-independence to reduce the error for all normalized ratios.
When the relationship between Gd concentration (and thus ΔR1) and signal is approximately linear, kep could be determined without any T10 measurement using a spin echo pulse sequence according to Brix's model [23]. For a spoiled gradient echo pulse sequence, the relationship between ΔR1 and signal is approximately linear for a large flip angle as shown in Fig. 2a, and kep became more T10-independent as shown in Fig. 2b. This result was consistent with Brix's observation [23]. But even with small flip angles, the computed kep is still approximately constant when the assumed T10 is larger than a certain T10 value (e.g. 500ms for a true T10 of 800 ms).
In conclusion, we have demonstrated with simulations and in vivo experiments that DCE-MRI parameters kep and the normalized ratio of kep are independent of the baseline T10 for a gradient echo pulse sequence utilizing a large flip angle (e.g. 30°). Thus, these two parameters could be accurately computed using an assumed T10 value in the absence of a T10 measurement, even when T10 changes following treatment. Normalized ratios of Ktrans, ve and IAUC are largely independent of T10 only when there is no T10 change between pre- and post-treatment caused by the chemotherapy. In contrast, the absolute values of Ktrans, ve and IAUC are highly dependent on the baseline T10 value.
References
- [1].Buckley DL, et al. Microvessel density of invasive breast cancer assessed by dynamic Gd-DTPA enhanced MRI. J Magn Reson Imaging. 1997;7(3):461–4. doi: 10.1002/jmri.1880070302. [DOI] [PubMed] [Google Scholar]
- [2].Padhani AR. Dynamic contrast-enhanced MRI in clinical oncology: current status and future directions. J Magn Reson Imaging. 2002;16(4):407–22. doi: 10.1002/jmri.10176. [DOI] [PubMed] [Google Scholar]
- [3].Parker GJ, et al. Probing tumor microvascularity by measurement, analysis and display of contrast agent uptake kinetics. J Magn Reson Imaging. 1997;7(3):564–74. doi: 10.1002/jmri.1880070318. [DOI] [PubMed] [Google Scholar]
- [4].Roberts HC, et al. Quantitative measurement of microvascular permeability in human brain tumors achieved using dynamic contrast-enhanced MR imaging: correlation with histologic grade. AJNR Am J Neuroradiol. 2000;21(5):891–9. [PMC free article] [PubMed] [Google Scholar]
- [5].Li KL, et al. Improved 3D quantitative mapping of blood volume and endothelial permeability in brain tumors. J Magn Reson Imaging. 2000;12(2):347–57. doi: 10.1002/1522-2586(200008)12:2<347::aid-jmri19>3.0.co;2-7. [DOI] [PubMed] [Google Scholar]
- [6].Zhu XP, et al. Quantification of endothelial permeability, leakage space, and blood volume in brain tumors using combined T1 and T2* contrast-enhanced dynamic MR imaging. J Magn Reson Imaging. 2000;11(6):575–85. doi: 10.1002/1522-2586(200006)11:6<575::aid-jmri2>3.0.co;2-1. [DOI] [PubMed] [Google Scholar]
- [7].Mross K, et al. Phase I clinical and pharmacokinetic study of PTK/ZK, a multiple VEGF receptor inhibitor, in patients with liver metastases from solid tumours. Eur J Cancer. 2005;41(9):1291–9. doi: 10.1016/j.ejca.2005.03.005. [DOI] [PubMed] [Google Scholar]
- [8].Thomas AL, et al. Phase I study of the safety, tolerability, pharmacokinetics, and pharmacodynamics of PTK787/ZK 222584 administered twice daily in patients with advanced cancer. J Clin Oncol. 2005;23(18):4162–71. doi: 10.1200/JCO.2005.09.034. [DOI] [PubMed] [Google Scholar]
- [9].Harris NG, et al. MRI measurement of blood-brain barrier permeability following spontaneous reperfusion in the starch microsphere model of ischemia. Magn Reson Imaging. 2002;20(3):221–30. doi: 10.1016/s0730-725x(02)00498-8. [DOI] [PubMed] [Google Scholar]
- [10].Fritz-Hansen T, et al. Capillary transfer constant of Gd-DTPA in the myocardium at rest and during vasodilation assessed by MRI. Magn Reson Med. 1998;40(6):922–9. doi: 10.1002/mrm.1910400619. [DOI] [PubMed] [Google Scholar]
- [11].Galbraith SM, et al. Reproducibility of dynamic contrast-enhanced MRI in human muscle and tumours: comparison of quantitative and semi-quantitative analysis. NMR Biomed. 2002;15(2):132–42. doi: 10.1002/nbm.731. [DOI] [PubMed] [Google Scholar]
- [12].Dale BM, et al. Determining and optimizing the precision of quantitative measurements of perfusion from dynamic contrast enhanced MRI. J Magn Reson Imaging. 2003;18(5):575–84. doi: 10.1002/jmri.10399. [DOI] [PubMed] [Google Scholar]
- [13].Haacke EM, et al. New algorithm for quantifying vascular changes in dynamic contrast-enhanced MRI independent of absolute T1 values. Magn Reson Med. 2007;58(3):463–72. doi: 10.1002/mrm.21358. [DOI] [PubMed] [Google Scholar]
- [14].Tofts PS, et al. Estimating kinetic parameters from dynamic contrast-enhanced T(1)-weighted MRI of a diffusable tracer: standardized quantities and symbols. J Magn Reson Imaging. 1999;10(3):223–32. doi: 10.1002/(sici)1522-2586(199909)10:3<223::aid-jmri2>3.0.co;2-s. [DOI] [PubMed] [Google Scholar]
- [15].Evelhoch JL. Key factors in the acquisition of contrast kinetic data for oncology. J Magn Reson Imaging. 1999;10(3):254–9. doi: 10.1002/(sici)1522-2586(199909)10:3<254::aid-jmri5>3.0.co;2-9. [DOI] [PubMed] [Google Scholar]
- [16].Ogg RJ, Kingsley PB. Optimized precision of inversion-recovery T1 measurements for constrained scan time. Magn Reson Med. 2004;51(3):625–30. doi: 10.1002/mrm.10734. [DOI] [PubMed] [Google Scholar]
- [17].Wang HZ, Riederer SJ, Lee JN. Optimizing the precision in T1 relaxation estimation using limited flip angles. Magn Reson Med. 1987;5(5):399–416. doi: 10.1002/mrm.1910050502. [DOI] [PubMed] [Google Scholar]
- [18].Deoni SC, Rutt BK, Peters TM. Rapid combined T1 and T2 mapping using gradient recalled acquisition in the steady state. Magn Reson Med. 2003;49(3):515–26. doi: 10.1002/mrm.10407. [DOI] [PubMed] [Google Scholar]
- [19].Cheng HL, Wright GA. Rapid high-resolution T(1) mapping by variable flip angles: accurate and precise measurements in the presence of radiofrequency field inhomogeneity. Magn Reson Med. 2006;55(3):566–74. doi: 10.1002/mrm.20791. [DOI] [PubMed] [Google Scholar]
- [20].Yarnykh VL. Actual flip-angle imaging in the pulsed steady state: a method for rapid three-dimensional mapping of the transmitted radiofrequency field. Magn Reson Med. 2007;57(1):192–200. doi: 10.1002/mrm.21120. [DOI] [PubMed] [Google Scholar]
- [21].McCarville MB, et al. The cause and clinical significance of central tumor photopenia on thallium scintigraphy of pediatric osteosarcoma of the extremity. AJR Am J Roentgenol. 2007;188(2):572–8. doi: 10.2214/AJR.06.0292. [DOI] [PubMed] [Google Scholar]
- [22].Reddick WE, et al. Dynamic magnetic resonance imaging of regional contrast access as an additional prognostic factor in pediatric osteosarcoma. Cancer. 2001;91(12):2230–7. [PubMed] [Google Scholar]
- [23].Brix G, et al. Pharmacokinetic parameters in CNS Gd-DTPA enhanced MR imaging. J Comput Assist Tomogr. 1991;15(4):621–8. doi: 10.1097/00004728-199107000-00018. [DOI] [PubMed] [Google Scholar]
- [24].Hoffmann U, et al. Pharmacokinetic mapping of the breast: a new method for dynamic MR mammography. Magn Reson Med. 1995;33(4):506–14. doi: 10.1002/mrm.1910330408. [DOI] [PubMed] [Google Scholar]
- [25].Larsson HB, et al. Quantitation of blood-brain barrier defect by magnetic resonance imaging and gadolinium-DTPA in patients with multiple sclerosis and brain tumors. Magn Reson Med. 1990;16(1):117–31. doi: 10.1002/mrm.1910160111. [DOI] [PubMed] [Google Scholar]
- [26].Roberts TP. Physiologic measurements by contrast-enhanced MR imaging: expectations and limitations. J Magn Reson Imaging. 1997;7(1):82–90. doi: 10.1002/jmri.1880070112. [DOI] [PubMed] [Google Scholar]
- [27].Tofts PS. Modeling tracer kinetics in dynamic Gd-DTPA MR imaging. J Magn Reson Imaging. 1997;7(1):91–101. doi: 10.1002/jmri.1880070113. [DOI] [PubMed] [Google Scholar]
- [28].Tofts PS, Kermode AG. Measurement of the blood-brain barrier permeability and leakage space using dynamic MR imaging. 1. Fundamental concepts. Magn Reson Med. 1991;17(2):357–67. doi: 10.1002/mrm.1910170208. [DOI] [PubMed] [Google Scholar]
- [29].Kety SS. The theory and applications of the exchange of inert gas at the lungs and tissues. Pharmacol Rev. 1951;3(1):1–41. [PubMed] [Google Scholar]
- [30].Parker GJ, et al. Experimentally-derived functional form for a population-averaged high-temporal-resolution arterial input function for dynamic contrast-enhanced MRI. Magn Reson Med. 2006;56(5):993–1000. doi: 10.1002/mrm.21066. [DOI] [PubMed] [Google Scholar]
- [31].Donahue KM, et al. Studies of Gd-DTPA relaxivity and proton exchange rates in tissue. Magn Reson Med. 1994;32(1):66–76. doi: 10.1002/mrm.1910320110. [DOI] [PubMed] [Google Scholar]
- [32].Shuter B, et al. The relaxivity of Gd-EOB-DTPA and Gd-DTPA in liver and kidney of the Wistar rat. Magn Reson Imaging. 1996;14(3):243–53. doi: 10.1016/0730-725x(95)02097-d. [DOI] [PubMed] [Google Scholar]


