Abstract
Dynamic contrast enhanced MRI (DCE-MRI) can estimate parameters relating to blood flow and tissue volume fractions and therefore may be used to characterize the response of breast tumors to treatment. To assess treatment response, values of these DCE-MRI parameters are observed at different time points during the course of treatment. We propose a method whereby DCE-MRI data sets obtained in separate imaging sessions can be co-registered to a common image space, thereby retaining spatial information so that serial DCE-MRI parameter maps can be compared on a voxel-by-voxel basis. In performing inter-session breast registration, one must account for patient repositioning and breast deformation, as well as changes in tumor shape and volume relative to other imaging sessions. One challenge is to optimally register the normal tissues while simultaneously preventing tumor distortion. We accomplish this by extending the adaptive bases algorithm (ABA) through adding a tumor-volume preserving constraint in the cost function. We also propose a novel method to generate the simulated breast MR images, which can be used to evaluate the proposed registration algorithm quantitatively. The proposed nonrigid registration algorithm is applied to both simulated and real longitudinal 3D high resolution MR images and the obtained transformations are then applied to lower resolution physiological parameter maps obtained via DCE-MRI. The registration results demonstrate the proposed algorithm can successfully register breast MR images acquired at different time points and allow for analysis of the registered parameter maps.
Keywords: Breast Cancer, image registration, DCE-MRI, neoadjuvant chemotherapy, treatment monitoring
1. INTRODUCTION
Breast cancer is the second leading cause of cancer death among American women. The American Cancer Society reports that in 2008 approximately 178,480 women will be diagnosed with breast cancer and there are currently no available methods to assess the response of breast tumors to therapy both quantitatively and specifically [1]. The current methods of monitoring treatment response rely on frank changes in tumor morphology (such as size) as measured by physical exam, mammography and/or ultrasound. Unfortunately, these methods are difficult to quantify and often do not correlate with each other nor with tumor activity [2]. Although useful for screening and detection of cancer, X-ray mammography and other conventional imaging methods do not provide adequate information on the status of malignancies or their response to therapy. Additionally, the 2-dimensional nature of planar X-ray mammography makes it difficult to assess both the location and extent of a potentially complex 3-dimensional lesion, thus making it very difficult to employ in quantitative longitudinal studies. Due to their invasive nature, biopsies can be obtained only infrequently to assess treatment response during chemotherapy. Additionally, their spatial sampling may be poor and may provide misleading results. Therefore this method is not acceptable for routine patient care ([3]–[6]). The net result of these limitations is that current methods of assessing tumor response are subjective and prone to error. The most widely used method of measuring tumor response is based on the Response Evaluation Criteria in Solid Tumors (RECIST). RECIST offers a simplified, practical method for extracting the salient features of anatomical imaging data [7]. However, it is well recognized that this approach needs to be significantly improved.
Dynamic contrast enhanced magnetic resonance imaging (DCE-MRI) has matured to the point where it offers quantitative information on tumor status. DCE-MRI involves the serial acquisition of MR images of a tissue of interest (e.g., a tumor) before and after an intravenous injection of contrast agent (CA) ([8], [9]). As the CA enters into the tissue under investigation, the T1 and T2 values of tissue water decrease to an extent that is determined by the concentration of the agent; studies that exploit changes in T1 are termed DCE-MRI, while those relying on T2 (or T2*) changes are termed dynamic susceptibility contrast MRI (DSC-MRI). By considering a set of images acquired before, during, and after a CA infusion, a region of interest (ROI) or individual voxels will display a characteristic signal intensity time course, which can be related to CA concentration. By fitting the DCE-MRI data to an appropriate pharmacokinetic model, physiological parameters can be extracted that relate to, for example, tissue perfusion and microvascular vessel wall permeability (denoted by the parameter Ktrans), blood volume (vb), extracellular volume fraction (denoted by ve), and (recently) indirect indices of cell size (denoted by τi) ([8]–[10]). It has been shown that pathologic tissues exhibit characteristic values of these parameters (e.g., [11]–[13]) and that quantitative measurements of these parameters over time may aid in monitoring treatment response (e.g., [14]–[17]).
There are many papers in the literature regarding the use of dynamic MRI as a surrogate biomarker for predicting response to neoadjuvant chemotherapy (see, e.g., [18]–[27]). Currently, the most frequently applied methods include tracking changes during the course of treatment in pharmacokinetic parameter values obtained from the tumor region of interest (ROI), or histograms describing their distributions. However, both of these methods are limited. The first does not capture the tissue heterogeneity as observed in distributions of parameter values. Both discard the information on spatial localization and therefore suffer from a similar limitation as the RECIST criteria. We propose a method whereby DCE-MRI data sets obtained at separate imaging sessions (during the course of treatment) can be registered so that parameter values associated with individual voxels can be compared, thereby retaining spatial information. Various registration algorithms for breast images have been proposed and applied to a wide range of imaging data. Examples include registration of MR images obtained pre- and post-contrast agent injection, 3D breast ultrasound registration, speckle tracking, positron emission mammography (PEM)/Mammography registration, MR/ultrasound registration, PEM/PET/CT registration, and X-ray/ultrasound image registration. For a review of these methods, see [30] and [31].
Typically methods, which are used for the registration of intra-session dynamic images (i.e., images acquired before and after the injection of contrast agents) include a succession of rigid and non-rigid registration steps. Mutual-Information is commonly used as the similarity measure to compute these transformations. In [32], Rueckert et al. propose to use a B-spline based free form deformation (FFD). Tanner et al. [33] and Rohlfing et al. [34] observe that registering pre- and post-contrast images with FFDs tend to shrink the tumor because of the change in image contrast. Tanner et al. propose to couple the control point of the splines, which cover the enhancing region. This results in a transformation that permits only the translation of the tumor between image volumes. Rohlfing et al. address the problem by adding an incompressibility constraint to penalize transformations, which locally compress or stretch the images. Other methods involve finite element method based registration algorithms (e.g., [35]–[37]), elastic matching models [38], or wavelet based nonrigid registration [39].
While intra-session registration is concerned with correction of relatively slight movements caused by respiratory and cardiac motion, and minor patient movements, inter-session registration must account for patient repositioning and large deformations of the breasts relative to the other imaging sessions. Moreover, in most cases, the chemotherapeutic regimen will result in substantial changes in both tumor shape and volume. Longitudinal breast registration for DCE-MR image analysis thus presents two main challenges. First, the transformation must be such that it accommodates large differences in the overall shape of the breast. Second, while it may allow re-orientation of the tumor between acquisitions, it should not permit the tumor to be deformed to match shapes even though it may have, in fact, changed shape between acquisitions. Overcoming these two challenges permits voxel-by-voxel analysis of the tumor region and allows for the application of more quantitative methods to determine whether or not a section of tissue responds to the therapy.
Currently, there is a paucity of studies regarding the registration of breast MR images obtained at different time points throughout treatment. To the best of our knowledge, there is only one such investigation, the work proposed by Chittineni et al. [40]. Their work uses a B-spline based methods to register longitudinal anatomic images. They also force the control points of the splines that cover the tumor to remain equidistant, which is similar to the constraint used by Tanner et al. [33]. In this contribution, we present results we have obtained with a non-rigid registration that we have previously developed. We study the effect of a rigidity constraint based on the value of the Jacobian determinant inspired by the work of Rohlfing et al. [34], and we use our method to register parametric maps computed at each time point. This permits visualizing the spatial distribution of tumor response. We also propose a novel validation method to assess the proposed algorithm quantitatively.
2. MATERIALS AND METHODS
2.1. Data Acquisition
Data were acquired from a single patient with locally advanced breast cancer who was enrolled in an ongoing clinical trial [17]. The patient provided informed consent and the study was approved by the ethics committee of our Cancer Center. DCE-MRI was performed using a Philips 3T Achieva MR scanner (Philips Healthcare, Best, The Netherlands) prior to neoadjuvant chemotherapy. A 4-channel receive double-breast coil covering both breasts was used for all imaging (In vivo Inc., Gainesville, FL). Data for a T1 map were acquired employing a 3D gradient echo multi-flip angle approach with a TR\TE of 7.9\1.3 ms and ten flip angles from 2 to 20 degrees in two degree increments. The acquisition matrix was 192×192×25 (full-breast) over a sagittal square field of view (22 cm2) with slice thickness of 5 mm, number of signal averages NSA = 1, SENSE factor = 2, and time of acquisition = 2 minutes 44 seconds. The dynamic scan used identical parameters and a flip angle of 20°. Each 20-slice set was collected in 16.5 seconds yielding 25 time points in 6 minutes and 51 seconds. A catheter placed within an antecubital vein delivered 0.1 mmol/kg of the contrast agent Magnevist over 20 seconds (followed by a saline flush) after the acquisition of three baseline dynamic scans for the DCE study. Following the dynamic scan, a 3D T1 weighted high resolution isotropic volume examination (THRIVE) scan was acquired with a fat-nulling inversion pulse and the following parameters: TR/TE/α = 6.98/3.6ms/10° and NSA = 1. The THRIVE scan resolution was 400×400×129 reconstructed to 512×512×129 over a 170mm×170mm×129mm axial field of view with a SENSE factor of 2 so that the scan required only 2.7 minutes. The patient was scanned at three time points: within one week of the onset of neodadjuvant chemotherapy, within one week of completion of the first cycle, and after completion of all cycles but prior to surgery. The treatment regimen was left to the discretion of the treating medical oncologist.
2.2 DCE-MRI Data Analysis
Pre-contrast T1 values, T10, values were computed from the multi-flip angle data by fitting to Eq. (1):
| (1) |
where α is the flip angle, S0 is a constant describing the scanner gain and proton density, and we have assumed that TE≪T2*. Voxels for which Eq. (1) could not fit the data were set to zero and not included in the subsequent analysis. DCE-MRI data were analyzed by fast exchange regime formalism ([11], [28]); the main result of which is given by Eq. (2):
| (2) |
where R1i is the intracellular R1, τi is the average intracellular water lifetime of a water molecule, ve is the extravascular extracellular volume fraction, and fw is the fraction of water that is accessible to mobile CA ([21]–[23]), and the Ct time course is given by
| (3) |
where Ktrans is the CA extravasation rate constant, and Cp(t) is the concentration of CA in blood plasma, the so-called arterial input function (AIF). AIF measurement was not available in this study so we employed the population averaged AIF previously reported by Port et al. [29]. In these fits we have also assumed that R10 = R1i and assigned the value of 0.8 to fw [28]. Data from each DCE-MRI study were fit on a voxel-by-voxel basis with Eqs. (2) and (3) to yield estimates of Ktrans, ve, and τi. The fitting routine employs a standard gradient-expansion, nonlinear, least-square, curve-fitting algorithm written in the Interactive Data Language (RSI, Boulder, CO). Voxels for which the fitting algorithm did not converge, or converged to non-physical values (i.e., Ktrans > 5.0 min−1, ve > 1.0, τi > 3.0 s, or any parameter below 0.0) were set equal to zero. Ktrans, ve, and τi parametric maps were created for each imaging session.
2.3 Rigid body registration
First, a standard normalized mutual-information (NMI) based rigid body registration algorithm [41] is applied to the 3D high resolution T1 weighted breast MR volumes to obtain an approximate registration result. A rotation matrix R and a translation vector t, which maximize the normalized mutual information between the images, are computed using Powell’s conjugate direction method [42]. With this approach, the MR volumes acquired at the first two time points are co-registered to the image acquired after the treatment. The new transformed images become
| (4) |
where x and x′ are the original and new coordinates of the source images.
The rigid body registration results are then used as the input for the nonrigid registration algorithm. Note that we do not use an affine transformation as it includes scaling parameters, which may result in undesirable compression or expansion of the tumor regions.
2.4 Nonrigid registration with tumor deformation constraint
The next step relies on an intensity-based registration algorithm we have proposed in the past, which we call ABA for adaptive bases algorithm [43]. This algorithm also uses normalized mutual information as the similarity measure and models the deformation field (v) that registers the two images as a linear combination of radial basis functions (RBFs) with finite support:
| (5) |
with
| (6) |
φ(r) is one of Wu’s compactly supported positive radial basis functions [44], x is a coordinate vector in Rd, with d being the dimensionality of the images, s is a predetermined scale for the basis function, the ci’s are the coefficients for basis functions, and N is the number of radial basis function used at the current resolution level. Because φ(r) is compactly supported, it makes it computationally efficient. It is also C2 continuous, which is a desirable property to generate regular deformation fields. The deformation field that registers the two images is obtained by computing the value of the coefficients ci, which maximize the mutual information between the images.
This algorithm is applied using a multilevel strategy. The original MR images are down-sampled into a number of low-resolution images. The algorithm starts at a low resolution level, with few basis functions. As the image resolution increases, the number of radial basis functions increases and the resulting transformation becomes more and more local. The number of resolution levels and basis functions at each level are user-selected parameters. Hence, the final deformation field is computed as
| (7) |
where M is the total number of levels. We also compute both the forward and the backward transformations to constrain these transformations to be inverses of each other using the method described in [45].
To regularize the transformation and keep the images transformed topologically correctly, our algorithm constrains the difference between the coefficients of adjacent basis functions through setting a threshold, ε. This difference is evaluated as
| (8) |
where ci and ci+1 are adjacent basis functions coefficients; in this scheme, low ε values lead to relatively stiff transformations while high ε values lead to more elastic transformations. At each iteration of the registration algorithm, the coefficients are calculated to not only minimize the cost function, but also satisfy this inequality.
As mentioned before, intensity based registration algorithms tend to deform the tumors in the source image and force them to match the tumors in the target image. This can thus potentially lead to an inaccurate analysis of tumor status. To limit the deformation of the tumors in the MR images, we add the constraint term proposed in [34] to the cost function. However, different from the work in [34], we only compute the Jacobian determinant over the tumor or lesion regions in MR images, instead of the whole breast volume. In our experiment, based on visual assessment, using the same constraint on the entire volume led to results which were not as accurate in the regions of normal tissues as those obtained with a Jacobian constraint applied locally.
In T1 weighted MR images, tumor areas possess a higher intensity than other regions. Tumor can thus be easily segmented with an intensity threshold and the constraint term is added to the cost function to penalize the deformation of tumor areas. Hence, the new cost function becomes:
| (9) |
where the first term is the negative normalized mutual information, H(A) and H(B) are the marginal entropy, and H(A,B) is the joint entropy of image A and B. The second term is the tumor constraint term, in which x is the coordinate vector of a voxel in the tumor area T, M is the number of voxels within the tumor, and α is the parameter which can be used to control the weight of this constraint term. We have empirically set the value of α as 0.15 (we provide details for this selection below). J(x) is the Jacobian determinant. The Jacobian determinant measures the compression or expansion, caused by the deformation, in a small local region. Hence, through minimizing the average Jacobian determinant over the tumor regions, the algorithm can constrain the tumor’s deformation and prevent it from changing volume.
As is done in the rigid registration step, the high resolution MR images obtained from the first two time points are registered to the one obtained at the completion of chemotherapy just prior to surgery. The exact same registration parameters are set for all MR data sets. In the study presented herein, three resolution levels used are: 128 ×128 ×32, 256 ×256 ×64, and 512 ×512 ×129. At the lowest resolution level, we use 4 ×4×4 and 8 ×8 ×4 basis functions. At the second one, we use 10×10×6 and 16×16×8 basis functions. At the highest level, we use 18×18×10 and 20×20×12 functions during the registration. The threshold ε is selected as 0.2. All parameters are determined empirically. Both the rigid and nonrigid registration algorithms were implemented in the C programming language.
After the registration of the T1 weighted high resolution isotropic MR volumes, the obtained transformations are applied to the low resolution physiological parameter maps obtained from the DCE-MRI analysis. Hence, three parametric maps, Ktrans, ve, and τi, (i.e., the three parameters in equations (2) and (3)), which are acquired at the first two time points, are transformed and co-registered with the corresponding parametric maps acquired at the last time point.
2.5 Validation approach
To demonstrate the validity of the registration technique described above, we present a novel simulation scheme. The proposed method begins with experimentally measured pre-treatment data and simulates tumor deformation in a controlled way. Through this process we have complete knowledge of the deformation that occurs within the breast so that we can quantitatively assess the accuracy of the proposed registration algorithm and the original ABA algorithm.
To simulate the MR post-treatment images, the tumor in the original (pre-treatment) images is contracted by an arbitrary amount (here we perform two contractions: 70% and 95%, respectively), and the contracted area is filled using texture from nearby healthy appearing tissue. The healthy appearing tissue is selected as follows: for every voxel, vi, within the contracted area, the closest point pi on the contour of the area is found. The mirror voxel v′i is found in the normal tissue areas through connecting the two points, vi and pi, and extending vi pi such that |vi pi|= |pi v′i|. Then the intensity of v′i is smoothed by a 3×3×3 Gaussian filter with a standard deviation of one sigma, and the voxel vi is filled using the filtered intensity of v′i. This step can be conducted automatically on both 2D and 3D images and leads to realistic images.
The next step is to simulate breast deformation caused by patient repositioning associated with the post-treatment scan. To achieve this, two sets of points are first extracted automatically from the breast surfaces of the simulated (contracted tumor) image and the actual post-treatment image, using a single thresholding method, which segments the whole breast surface contours from the background. The two point sets are then co-registered using a robust point matching algorithm [46]. This algorithm iteratively computes a correspondence between the points in the set and a smooth non-rigid transformation based on thin-plate splines, which registers the two image volumes. Once computed, the transformation is applied to the simulated (contracted tumor) image to generate the simulated post-treatment image for which the true deformation is known. Finally, the deformation fields estimated with the original and the modified version of the ABA algorithms are compared to these known deformation fields to study the effect of the constraint scheme.
3. RESULTS
We first present the results of the novel validation scheme before proceeding to the registration results of the patient data and the analysis of the DCE-MRI parameters.
3.1 Simulated data sets
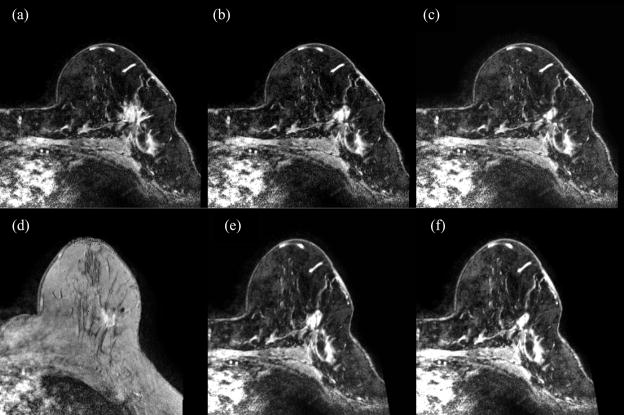
Figure 1 shows the simulated data sets: panel a is the original pre-treatment image, while panels b and c show the simulated images with tumors contracted by 70% and 95%, respectively. Note that the simulated image appears quite realistic even when the tumor is contracted by 95%. The images with the contracted tumor (panel b and c) are then registered to the experimentally measured post-treatment image (panel d) using the robust point matching algorithm. The transformed images (panel e and f) are considered as the simulated post-treatment images, and used to evaluate the proposed registration method.
Figure 1.
The original breast MR images (a), the corresponding simulated images (b and c) with tumors shrunk by ~70% and 95%, respectively. Note that the simulated images are realistic. The images with contracted tumor (b and c) are registered to the real post-treatment image (d) using the robust point matching algorithm. The generated images (e and f) are considered as the simulated post-treatment images, which are used to evaluate the proposed registration algorithm, under different contracted percentages
3.2 Registration results on simulated data
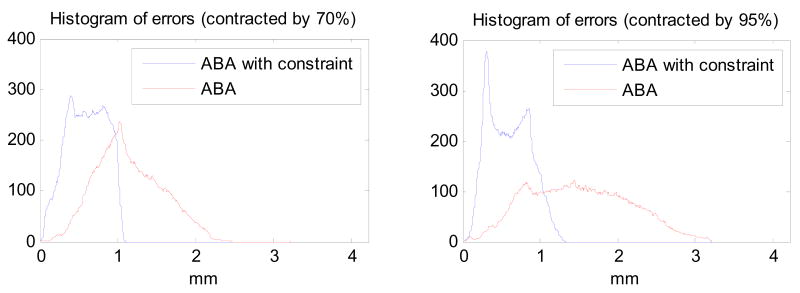
The registration algorithms with and without the constraint are applied to the simulated images. Figure 2 shows the histograms of the differences between the true and the estimated magnitude of the displacements with and without the constraint, when the proposed algorithm and the original ABA algorithm are compared with the true displacement, for both cases of 70% and 95%. Note that the proposed method leads to a more accurate registration, as well as a smaller mean error and smaller standard deviation (0.59 ± 0.25 mm for the tumor contracted by 70%; 0.58 ± 0.27 mm for the tumor contracted by 95%), compared with the unconstrained ABA algorithm (1.13 ± 0.42 mm for the tumor contracted by 70%; 1.49 ± 0.65 mm for the tumor contracted by 95%). The maximum error generated by the proposed method is also much smaller than by the original ABA algorithm. Furthermore, with the tumor contracted more, the original ABA algorithm performs worse, because without the constraint on tumor area, the algorithm compresses the tumor in source image as much as possible to match the tumor in the target image. However, the proposed algorithm performs well even when the tumor is contracted by 95%.
Figure 2.
The histograms of errors are calculated through comparing the proposed method and ABA with the known deformations, for the tumors contracted by 70% and 95%, respectively. Note that for both cases, the proposed method leads to a more accurate registration, as well as a smaller mean error and smaller standard deviation, compared with the unconstrained ABA algorithm.
3.3 Registration results on experimental data
The registration results on the simulated images show the proposed algorithm leads to a more accurate performance, compared with the original ABA algorithm. Next, we apply the proposed method and the original ABA algorithm to the real longitudinal breast MR images.
Figure 3 shows the maximum intensity projection of breast MR volumes with tumors for the patient. The MR images correspond to the pre-treatment (panel a, denoted as time t1), after one cycle of treatment (panel b, denoted as time t2), and after all cycles of treatment (panel c, denoted as time t3). Note the significant change in tumor shape that takes place during therapy.
Figure 3.
Maximum Intensity Projection (MIP) figures from breast MR volumes with tumors acquired at three different time points: a) pre-treatment, b) post-one cycle of neoadjuvant chemotherapy, c) after completion of chemotherapy. The green arrows show the location of the tumor. Note that the tumor changes in shape and size during the course of treatment. After the completion of chemotherapy (panel c), the tumor has dramatically decreased in size and the shape has changed significantly.
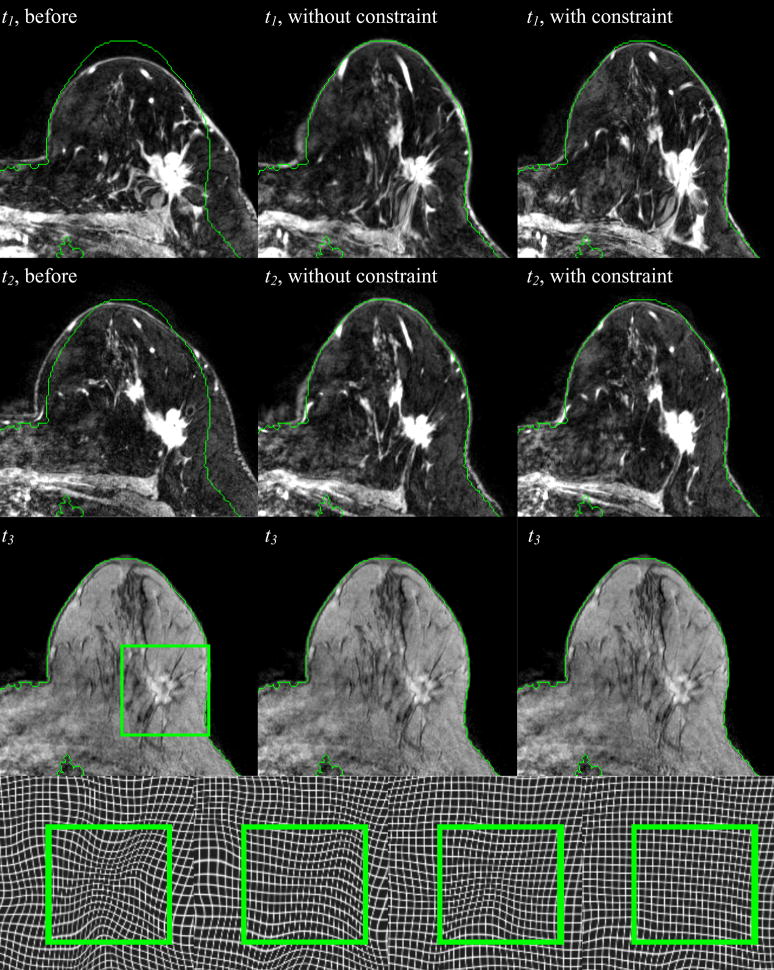
Figure 4 shows registration results obtained on the 3D high resolution MR images of the same patient. The first column shows the corresponding slice (i.e., the slice with the same index) in the volumes acquired at time t1, t2, and t3 when the volumes acquired at t1 and t2 are registered to the volume acquired at time t3 with a rigid body transformation. The second and third column show the same but obtained with non-rigid transformations computed with the original and modified ABA algorithm, respectively. Green contours are drawn on the target image and copied on the other images to facilitate visual assessment. Observe that the rigid body registration provides an initial and approximate registration. Notice also that in the results shown in the second column, the breast contours align accurately, while the tumor regions are deformed to match the corresponding one in the target, which causes dramatic shrinking of the tumor. Compared to the unconstrained approach, the algorithm with the additional constraint term matches the breast contours as well as normal tissues visible in the image, such as vessels and glandular breast tissues, accurately, while also keeping the shape and volume of the tumor from being substantially changed.
Figure 4.
Three axial slices at three different time points after rigid body registration (col. 1), after nonrigid registration without the constraint (col. 2), and with the constraint (col. 3). In the 4th row, the zoom-in deformation field without and with the constraint at t1 (the 1st and 2nd panels) and t2 (the 3rd and 4th panels) are shown, respectively.
The deformation fields generated with different algorithms are also shown in Figure 4. In the fourth row, the first two panels are the deformation fields registering the image at t1 to t3, without and with the constraint, respectively. The last two panels are the deformations registering the image at t2 to t3. The green square marks the tumor region. It is clear that using the proposed algorithm yields a deformation field without substantial contraction or expansion, thus indicating shape preservation. This is not the case with the unconstrained method.
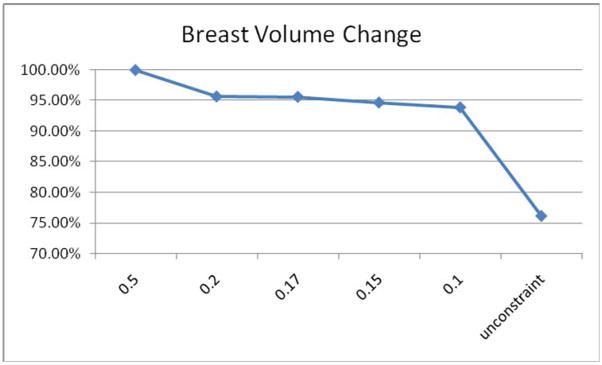
We have experimented with a range of values for the parameter α. Very large values of α lead to transformations that are very rigid. This produces transformations for which the shape of the tumor does not change at all but for which the breast as a whole is not registered correctly. Very small values of α produce transformations similar to those obtained with the original ABA algorithm. The influence of the constraint parameter α on the tumor volume is shown in Figure 5. The smaller the parameter α is, the smaller the constraint term weighs in the cost function, and, consequently, the less the tumor area is constrained. Through experimentation, we have determined that a value of 0.15 for alpha is a good compromise for the images we have dealt with so far.
Figure 5.
Breast volume change with different constraint parameters α. In this study, 0.15 is selected as the optimal value of α.
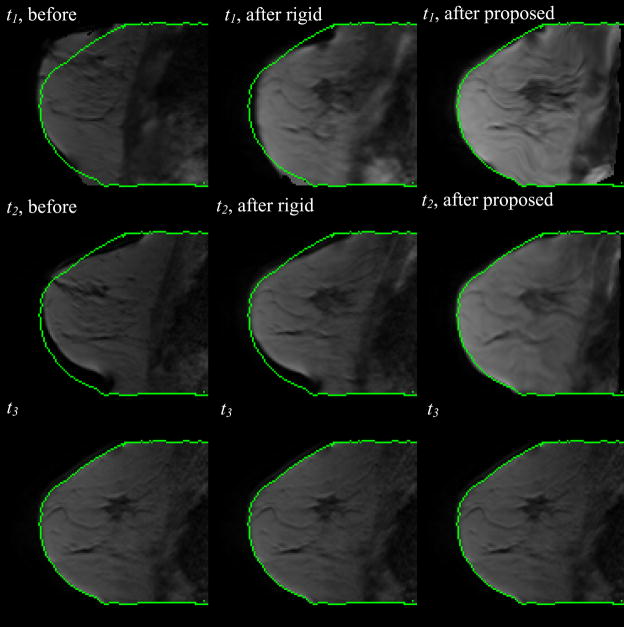
As described above, after registering the high resolution breast MR images and generating the transformations, we apply the obtained transformations to the low resolution parametric images. Figure 6 displays a central slice of the low resolution breast MR images at three time points and at different registration stages. It shows that after the proposed registration algorithm, the images pre-treatment and after the first cycle of treatment are aligned to the corresponding images acquired after all cycles of treatment accurately. These results also show that the tumor volume is preserved even though it has clearly changed when the data from t1 and t2 are compared to that from t3.
Figure 6.
After the registration is determined on the high resolution THRIVE images (see Figure 4), the detected transformation is applied to the lower resolution DCE-MRI data. The central slice for three time points before (column 1) and after rigid body registration (column 2), after the proposed algorithm (column 3), are shown. The three time points (t1, t2, and t3) correspond respectively to pre-treatment, post-one cycle of neoadjuvant chemotherapy, and after completion of chemotherapy.
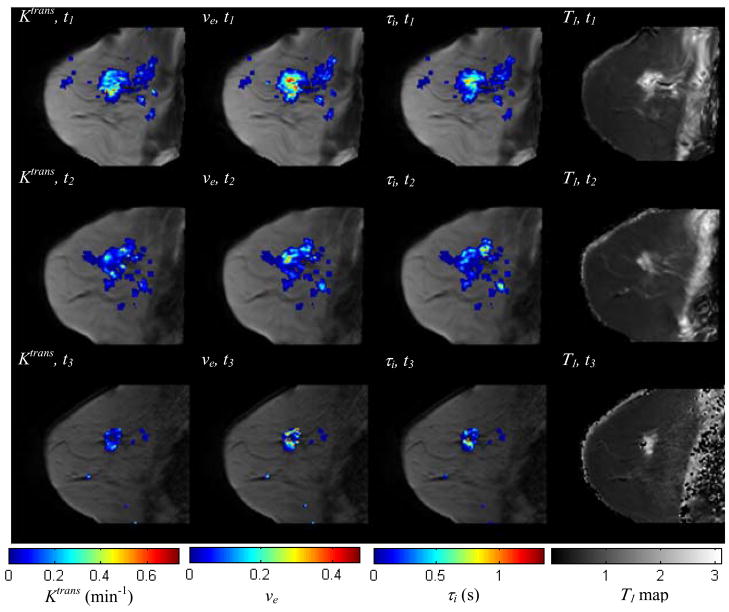
Figure 7 shows one central slice of the tumor at three time points after the proposed registration algorithm, with the parameters, Ktrans, ve, and τi, color-coded and superimposed on the anatomical images. A T1 map is also shown in this figure. Observe that not only the areas, but also the magnitude of nonzero parameter values are decreasing with time. Those parametric maps are aligned in the same spatial coordinate reference frame, and this is precisely the type of analysis that co-registration affords; i.e., we can compare Ktrans values from the same section obtained throughout treatment, and we can also explore the correlations between these three different parameters.
Figure 7.
The central slice of low resolution breast MR image volume at three time points after the proposed registration algorithm, with Ktrans, ve, τi, color-coded and superimposed (columns 1–3). The T1 maps at different time points are shown in column 4, without any overlay. Both the area and magnitude of nonzero parameter values are decreasing, indicating the spatial (physiological) changes that occur during the course of chemotherapy. Co-registration allows for the voxel-by-voxel analysis of these changes.
Figure 8 displays the central slice with two kinds of difference images of the three parameters, Ktrans, τi, and ve, superimposed: the difference between the post-one cycle of chemotherapy and the pre-treatment (t2−t1), and the difference between the completion of treatment and pre-treatment (t3−t1). It can be observed that the majority of voxels shows a decrease in all those parameters in the difference of (t2−t1), although there are some voxels showing an increase. For the difference of (t3−t1), nearly all voxels have shown a decrease in parameter values.
Figure 8.
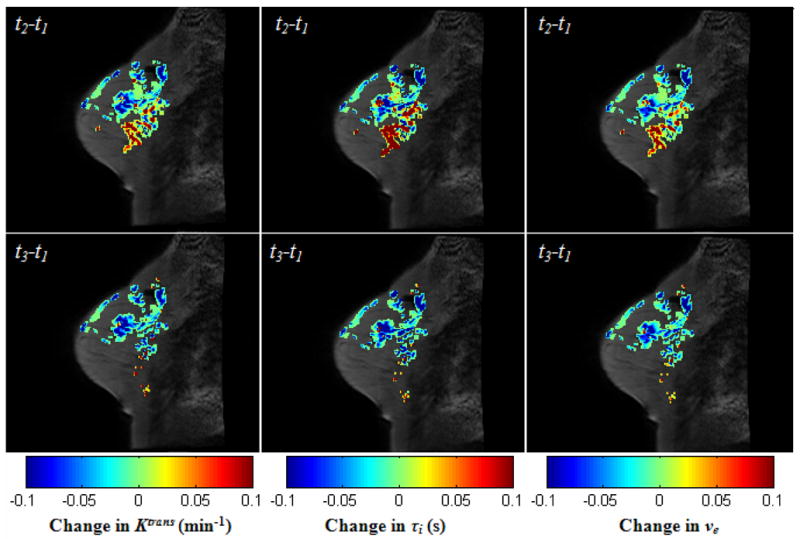
The central slice with two kinds of difference images of the three parameters, Ktrans, τi, and ve, superimposed: the difference between the post-one cycle of chemotherapy and the pre-treatment (t2−t1), and the difference between the completion of treatment and pre-treatment (t3−t1). Note that all of three parameters are decreasing in most voxels, although there’s an increase in some other voxels after the first cycle of treatment. After the completion of chemotherapy, nearly all values of three parameters decrease.
To analyze the change of the parameters quantitatively, the slopes of the parameter Ktrans from t1 to t2, t2 to t3, and t1 to t3, are calculated, for all voxels whose Ktrans values are non-zero at t1. The first row of figure 9 shows the central slice of the anatomical data with the slope values for t12, t23, and t13 shown from left to right on the three panels shown on that row. The corresponding slope distributions of the whole tumor volumes are shown in the second row. For the slopes of t12, 89% slopes have negative values, while for t13 97% slopes. For t23, only 28% of the slopes presented negative values, though it is much higher than those with positive values, which is only 4%. This indicates that, in this patient, most of the change in the parameters took place by the end of the first cycle of therapy.
Figure 9.
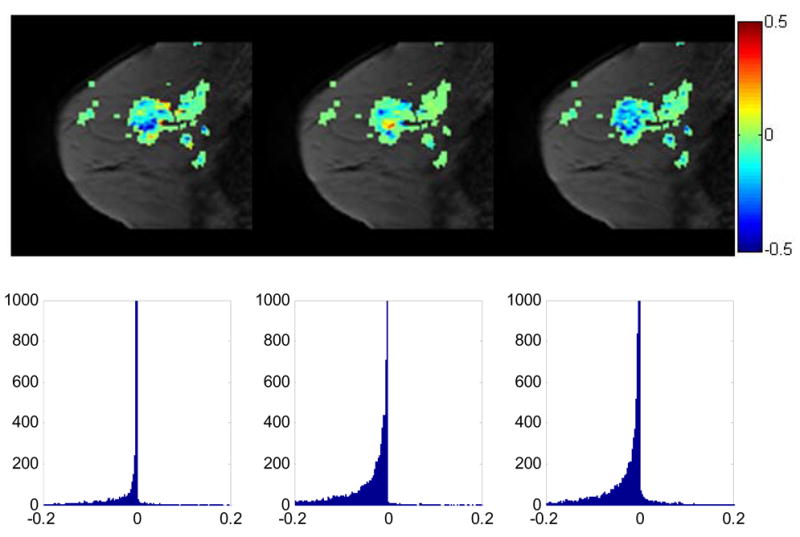
The central slice with the change of Ktrans values (the slopes) from t1 to t2, from t2 to t3, and from t1 to t3 superimposed, respectively (1st row); the zoomed histogram (2nd row) showing the distribution of Ktrans changes in the whole tumor volume for t12, t23, and t13. For the slopes of t12, 89% slopes have negative values, while for t13 97% slopes. For t23, although only 28% of the slopes presented negative values, it is much higher than those with positive values, which is 4%. It is anticipated that a large fraction of negative slopes will be predictive of positive response to treatment; we are currently testing this hypothesis in a larger sample set.
4. CONCLUSIONS
We have presented an algorithm for the registration of breast MR images obtained at different time points throughout the course of neoadjuvant chemotherapy. In general, registration of images acquired before and after therapy with intensity-based nonrigid registration algorithms will result in the deformation of both normal and cancerous tissue. As tumors typically change shape and volume significantly during treatment, registration algorithms will compress or expand tumors (depending on whether the tumor has reduced or increased in size) in the images before treatment to match those acquired later. Since it merely deforms the tumor shape at one point to the tumor shape at another, such an approach can lead to an inaccurate assessment of treatment response. Hence, the challenging task for longitudinal breast MR image registration is to register the normal tissues maximally while keeping the tumor from being distorted. The proposed algorithm extended the ABA algorithm through employing an additional term, in which the compression or expansion of tumor areas is constrained. The registration results for both the simulated and real high resolution T1 weighted MR breast images and the lower resolution physiological parametric maps show the utility of this constraint term.
As described in the introduction section, an alternative approach for the longitudinal breast MR image registration is proposed in [40], using a B-spline based registration algorithm; i.e, the B-spline control knots are forced to remain equidistant to keep the transformation of control points over tumor areas rigid. However those methods are not directly applicable to our registration algorithm. For our algorithm, the control points are the center locations of radial basis functions. The distances between the control points remain constant during the registration process. It is the coefficient of each basis function that controls the magnitude of deformation, not the spatial distance between functions. In the future, we will investigate if it is feasible to fix an optimal coefficient over the tumor region to preserve the tumor deformation.
We have also proposed a novel validation method to assess the proposed registration algorithm quantitatively. After simulating the post-treatment breast MR images, we obtain the known deformations, which can be used to evaluate different registration algorithms. The results on both the simulated images and the experimental data demonstrate the proposed registration algorithm leads to a more accurate registration result, compared with the unconstrained ABA algorithm. Ongoing efforts are exploring these results in a larger patient set.
Another novel aspect is that we have introduced the ability to compare, on a voxel-by-voxel basis, the physiological parameters obtained from sequential DCE-MRI exams. In the quantitative analysis of DCE-MRI breast cancer data obtained during the course of treatment, the primary goal is to use the changes in pharmacokinetic parameters as a means to assess and, ultimately, predict treatment response. If successful, such an approach would represent a significant advance past the currently accepted and clinically employed RECIST criteria [7]. We hypothesize that a fundamental limitation in being able to execute this analysis is in the current inability to rigorously compare both the temporal and spatial features of changes within DCE-MRI parameter sets obtained at different time points. Currently, such analyses are limited to manually drawn (or computer assisted segmentation of) tumor ROIs resulting in a mean parameter value for the ROI, or a distribution of parameter values from that ROI if histogram analysis is performed. However, these methods are limited in that they discard the spatial information associated with the parameter maps. In fact, one of the principle reasons parametric maps are made in DCE-MRI (or any other analysis technique) is that they allow the inhomogeneity inherent in many pathologies to be evaluated. By performing accurate co-registration, the temporal and spatial changes of DCE-MRI parameters can be explored and important information regarding the response to treatment can be investigated. In figures 8 – 9 we display simple subtraction and slopes of the different time points to assess what percentage of voxels show an increase or decrease in a particular parameter value. It is possible that the fraction of voxels showing a decrease (or increase) in a parameter—or a combination of all available parameters—could indicate positive (or negative) response to treatment. This is a hypothesis we are currently investigating.
Acknowledgments
We thank the National Institutes of Health for funding through NCI 1R01CA129961, NIBIB 1K25 EB005936, and NCI 1P50 098131 and the Vanderbilt-Ingram Cancer Center Institutional Grant (NIH P30 CA68485). We thank Ms. Donna Butler and Ms. Wanda Smith for expert technical assistance, and Dr. John Huff, M.D., for many informative discussions.
Footnotes
Publisher's Disclaimer: This is a PDF file of an unedited manuscript that has been accepted for publication. As a service to our customers we are providing this early version of the manuscript. The manuscript will undergo copyediting, typesetting, and review of the resulting proof before it is published in its final citable form. Please note that during the production process errors may be discovered which could affect the content, and all legal disclaimers that apply to the journal pertain.
References
- 1.New Report Looks at the Latest on Breast Cancer [Internet] American Cancer Society. 2007 Available from: http://www.cancer.org/docroot/NWS/content/NWS_1_1x_Breast_Cancer_Report_Death_Rate_Incidence_Continue_to_Drop.asp.
- 2.Yeh E, Slanetz P, Kopans DB, Rafferty E, Georgian-Smith D, Moy L, Halpern E, Moore R, Kuter I, Taghian A. Prospective Comparison of Mammography, Sonography, and MRI in Patients Undergoing Neoadjuvant Chemotherapy for Palpable Breast Cancer. Am J Roentgenol. 2005:867–877. doi: 10.2214/ajr.184.3.01840868. [DOI] [PubMed] [Google Scholar]
- 3.Buchholz TA, Davis DW, McConkey DJ, et al. Chemotherapy-induced apoptosis and Bcl-2 levels correlate with breast cancer response to chemotherapy. Cancer J. 2003;9:33–41. doi: 10.1097/00130404-200301000-00007. [DOI] [PubMed] [Google Scholar]
- 4.Mohsin SK, Weiss HL, Gutierrez MC, et al. Neoadjuvant Trastuzumab Induces Apoptosis in Primary Breast Cancers. J Clin Oncol. 2005;23:2460–2468. doi: 10.1200/JCO.2005.00.661. [DOI] [PubMed] [Google Scholar]
- 5.Stearns V, Singh B, Tsangaris T, et al. A Prospective Randomized Pilot Study to Evaluate Predictors of Response in Serial Core Biopsies to Single Agent Neoadjuvant Doxorubicin or Paclitaxel for Patients with Locally Advanced Breast Cancer. Clin Cancer Res. 2003;9:124–133. [PubMed] [Google Scholar]
- 6.Chakravarthy A, Kelley M, McLaren B, Truica C, Billheimer D, Mayer I, Grau A, Johnson D, Simpson J, Beauchamp D, Brown C, Pietenpol J. Neoadjuvant Concurrent Paclitaxel/Radiation in Stage II/III Breast Cancer. Clin Cancer Res. 2006;12:1570–1576. doi: 10.1158/1078-0432.CCR-05-2304. [DOI] [PubMed] [Google Scholar]
- 7.Therasse P, Arbuck SG, Eisenhauer EA, Wanders J, Kaplan RS, Rubinstein L, Verweij J, Glabbeke MC, van Oosterom AT, Christian MC, Gwyther SG. New guidelines to evaluate the response to treatment in solid tumors. J Natl Cancer Inst. 2000;92:205–216. doi: 10.1093/jnci/92.3.205. [DOI] [PubMed] [Google Scholar]
- 8.Choyke PL, Dwyer AJ, Knopp MV. Functional tumor imaging with dynamic contrast-enhanced magnetic resonance imaging. J Magn Reson Imag. 2003;17:509–520. doi: 10.1002/jmri.10304. [DOI] [PubMed] [Google Scholar]
- 9.Yankeelov TE, Gore JC. Dynamic Contrast Enhanced Magnetic Resonance Imaging in Oncology: Theory, Data Acquisition, Analysis, and Examples. Curent Medical Imaging Reviews. 2007;3:91–107. doi: 10.2174/157340507780619179. [DOI] [PMC free article] [PubMed] [Google Scholar]
- 10.Tofts PS. Modeling tracer kinetics in dynamic Gd-DTPA imaging. J Magn Reson Imag. 1997;7:91–101. doi: 10.1002/jmri.1880070113. [DOI] [PubMed] [Google Scholar]
- 11.Yankeelov TE, Rooney WD, Huang W, Dyke JP, Li X, Tudorica A, Lee J-H, Koutcher JA, Springer CS. Evidence for Shutter-speed variation in CR bolus-tracking studies of human pathology. NMR in Biomed. 2005;18:173–185. doi: 10.1002/nbm.938. [DOI] [PubMed] [Google Scholar]
- 12.Hayes C, Padhani AR, Leach MO. Assessing changes in tumour vascular function using dynamic contrast-enhanced magnetic resonance imaging. NMR in Biomedicine. 2002;15:154–163. doi: 10.1002/nbm.756. [DOI] [PubMed] [Google Scholar]
- 13.Checkley D, Tessier JJL, Wedge SR, Dukes M, Kendrew J, Curry B, Middleton B, Waterton JC. Dynamic contrast-enhanced MRI of vascular changes induced by the VEGF-signalling inhibitor ZD4190 in human tumour xenografts. Magn Reson Imaging. 2003;21:475–482. doi: 10.1016/s0730-725x(02)00644-6. [DOI] [PubMed] [Google Scholar]
- 14.Delille JP, Slanetz PJ, Yeh ED, Halpern EF, Kopans DB, Garrido L. Invasive ductal breast carcinoma response to neoadjuvant chemotherapy: noninvasive monitoring with functional MR imaging pilot study. Radiology. 2003;228:63–69. doi: 10.1148/radiol.2281011303. [DOI] [PubMed] [Google Scholar]
- 15.Martincich L, Montemurro F, De Rosa G, Marra V, Ponzone R, Cirillo S, Gatti M, Biglia N, Sarotto I, Sismondi P, Regge D, Aglietta M. Monitoring response to primary chemotherapy in breast cancer using dynamic contrast-enhanced magnetic respnance imaging. Breast Cancer Res Treat. 2004;83:67–76. doi: 10.1023/B:BREA.0000010700.11092.f4. [DOI] [PubMed] [Google Scholar]
- 16.Nagashima T, Sakakibara M, Nakamura R, Arai M, Kadowaki M, Kazama T, Nakatani Y, Koda K, Miyazaki M. Dynamic enhanced MRI predicts chemosensitivity in breast cancer patients. Eur J Radiol. 2006;60:270–274. doi: 10.1016/j.ejrad.2006.07.014. [DOI] [PubMed] [Google Scholar]
- 17.Yankeelov TE, Lepage M, Chakravarthy A, Niermann KJ, Kelley MC, Herman CR, McManus K, Gore JC. Integration of Quantitative DCE-MRI and ADC Mapping to Monitor Treatment Response in Human Breast Cancer: Initial Results. Magn Reson Imag. 2007;25:1–13. doi: 10.1016/j.mri.2006.09.006. [DOI] [PMC free article] [PubMed] [Google Scholar]
- 18.Cheung YC, Chen SC, Su MY, See LC, Hsueh S, Chang HK, Lin YC, Tsai CS. Monitoring the size and response of locally advanced breast cancers to neoadjuvant chemotherapy (weekly paclitaxel and epirubicin) with serial enhanced MRI. Breast Cancer Res Treat. 2003;78:51–58. doi: 10.1023/a:1022153327339. [DOI] [PubMed] [Google Scholar]
- 19.Chou CP, Wu MT, Chang HT, Lo YS, Pan HB, Degani H, Furman-Haran E. Monitoring breast cancer response to neoadjuvant systemic chemotherapy using parametric contrast-enhanced MRI: a pilot study. Acad Radiol. 2007;14:561–573. doi: 10.1016/j.acra.2007.02.005. [DOI] [PubMed] [Google Scholar]
- 20.Delille JP, Slanetz PJ, Yeh ED, Halpern EF, Kopans DB, Garrido L. Invasive ductal breast carcinoma response to neoadjuvant chemotherapy: noninvasive monitoring with functional MR imaging pilot study. Radiology. 2003;228:63–69. doi: 10.1148/radiol.2281011303. [DOI] [PubMed] [Google Scholar]
- 21.Martincich L, Montemurro F, De Rosa G, Marra V, Ponzone R, Cirillo S, Gatti M, Biglia N, Sarotto I, Sismondi P, Regge D, Aglietta M. Monitoring response to primary chemotherapy in breast cancer using dynamic contrast-enhanced magnetic resonance imaging. Breast Cancer Res Treat. 2004;83:67–76. doi: 10.1023/B:BREA.0000010700.11092.f4. [DOI] [PubMed] [Google Scholar]
- 22.Padhani AR, Hayes C, Assersohn L, Powles T, Makris A, Suckling J, Leach MO, Husband JE. Prediction of clinicopathologic response of breast cancer to primary chemotherapy at contrast-enhanced MR imaging: initial clinical results. Radiology. 2006;239:361–374. doi: 10.1148/radiol.2392021099. [DOI] [PubMed] [Google Scholar]
- 23.Pickles MD, Lowry M, Manton DJ, Gibbs P, Turnbull LW. Role of dynamic contrast enhanced MRI in monitoring early response of locally advanced breast cancer to neoadjuvant chemotherapy. Breast Cancer Res Treat. 2005;91:1–10. doi: 10.1007/s10549-004-5819-2. [DOI] [PubMed] [Google Scholar]
- 24.Nagashima T, Sakakibara M, Nakamura R, Arai M, Kadowaki M, Kazama T, Nakatani Y, Koda K, Miyazaki M. Dynamic enhanced MRI predicts chemosensitivity in breast cancer patients. Eur J Radiol. 2006;60:270–274. doi: 10.1016/j.ejrad.2006.07.014. [DOI] [PubMed] [Google Scholar]
- 25.Chang YC, Huang CS, Liu YJ, Chen JH, Lu YS, Tseng WY. Angiogenic response of locally advanced breast cancer to neoadjuvant chemotherapy evaluated with parametric histogram from dynamic contrast–enhanced MRI. Phys Med Biol. 2004;49:3593–3602. doi: 10.1088/0031-9155/49/16/007. [DOI] [PubMed] [Google Scholar]
- 26.Rieber A, Brambs H-J, Gabelmann A, Heilmann V, Kreienberg R, Kuhn T. Breast MRI for monitoring response of primary breast cancer to neo-adjuvant chemotherapy. Eur Radiol. 2002;12:1711–1719. doi: 10.1007/s00330-001-1233-x. [DOI] [PubMed] [Google Scholar]
- 27.Schott AF, Roubidoux MA, Helvie MA, Hayes DF, Kleer CG, Newman LA, Pierce LJ, Griffith KA, Murray S, Hunt KA, Paramagul C, Baker LH. Clinical and radiologic assessments to predict breast cancer pathologic complete response to neoadjuvant chemotherapy. Breast Cancer Res Treat. 2005;92:231–238. doi: 10.1007/s10549-005-2510-1. [DOI] [PubMed] [Google Scholar]
- 28.Yankeelov TE, Rooney WD, Xin Li, Springer CS. Variation of the Relaxographic “Shutter-Speed” for Transcytolemmal Water Exchange Affects CR Bolus-Tracking Curve Shape. Magn Reson Med. 2003;50:1151–1169. doi: 10.1002/mrm.10624. [DOI] [PubMed] [Google Scholar]
- 29.Port RE, Knopp MV, Brix G. Dynamic contrast-enhanced MRI using Gd-DTPA: Interindividual variability of the arterial input function and consequences for the assessment of kinetics in tumors. Magn Reson Med. 2001;45:1030–1038. doi: 10.1002/mrm.1137. [DOI] [PubMed] [Google Scholar]
- 30.Sivaramakrishna R. 3D Breast Image Registration - A Review. Technology in Cancer Research & Treatment. 2005;4:39–48. doi: 10.1177/153303460500400106. [DOI] [PubMed] [Google Scholar]
- 31.Guo Y, Sivaramakrishna R, Lu CC, Suri JS, Laxminarayan S. Breast image registration techniques: a survey. Med Biol Eng Comput. 2006;44:15–26. doi: 10.1007/s11517-005-0016-y. [DOI] [PubMed] [Google Scholar]
- 32.Rueckert D, Sonoda LI, Hayes C, Hill DLJ, Leach MO, Hawkes DJ. Non-rigid registration using free-form deformations: Application to breast MR images. IEEE Trans Med Imag. 1999;18:712–721. doi: 10.1109/42.796284. [DOI] [PubMed] [Google Scholar]
- 33.Tanner C, Schnabel JA, Chung D, Clarkson MJ, Rueckert D, Hill DLJ, Hawkes DJ. Volume and Shape Preservation of Enhancing Lesions when Applying Non-rigid Registration to a Time Series of Contrast Enhancing MR Breast Images. Medical Image Computing and Computer-Assisted Intervention. 2000;1935:327–337. [Google Scholar]
- 34.Rohlfing T, Maurer CR, Bluemke JDA, Jacobs MA. Volume-Preserving Nonrigid Registration of MR Breast Images Using Free-Form Deformation With an Incompressibility Constraint. IEEE Trans Med Imaging. 2003;22:730–741. doi: 10.1109/TMI.2003.814791. [DOI] [PubMed] [Google Scholar]
- 35.Miga MI. A new approach to elastography using mutual information and finite elements. Phys Med Biol. 2003;48:467–480. doi: 10.1088/0031-9155/48/4/304. [DOI] [PubMed] [Google Scholar]
- 36.Miga MI, Rothney MP, Ou JJ. Modality independent elastography (MIE): Potential applications in dermoscopy. Med Phys. 2005;32:1308–1320. doi: 10.1118/1.1895795. [DOI] [PubMed] [Google Scholar]
- 37.Ou JJ, Ong RE, Yankeelov TE, Miga MI. Evaluation of 3D modality-independent elastography for breast imaging: a simulation study. Phys Med Biol. 2008;53:147–163. doi: 10.1088/0031-9155/53/1/010. [DOI] [PubMed] [Google Scholar]
- 38.Wu Q, Whitman GJ, Fussell DS, Markey MK. Registration of DCE MR images for computer-aided diagnosis of breast cancer. Fortieth Asilomar Conference on Signals, Systems and Computers. 2006:826–830. [Google Scholar]
- 39.Mainardi L, Passera KM, Lucesoli A, Vergnaghi D, Trecate G, Setti E, Musumeci R, Cerutti S. A Nonrigid Registration of MR Breast Images Using Complex-valued Wavelet Transform. Journal of Digital Imaging. 2008;21:27–36. doi: 10.1007/s10278-007-9021-z. [DOI] [PMC free article] [PubMed] [Google Scholar]
- 40.Chittineni R, Su MY, Nalcioglu O. Breast MR registration for evaluation of Neoadjuvant chemotherapy response. Proc Intl Soc Magn Reson Med. 2008;16:3095. [Google Scholar]
- 41.Maes F, Collignon A, Vandermeulen D, Marchal G, Suetens P. Multimodality Image Registration by Maximization of Mutual Information. IEEE Trans Med Imaging. 1997;16:187–198. doi: 10.1109/42.563664. [DOI] [PubMed] [Google Scholar]
- 42.Press W, Teukolsky S, Vetterling W, Flannery B. The Art of Scientific Computing. 2. Cambridge: Cambridge University Press; 1994. Numerical Recipes in C. [Google Scholar]
- 43.Rohde GK, Aldroubi A, Dawant BM. The adaptive bases algorithm for intensity-based nonrigid image registration. IEEE Trans Med Imaging. 2003;22:1470–1479. doi: 10.1109/TMI.2003.819299. [DOI] [PubMed] [Google Scholar]
- 44.Wu Z. Multivariate compactly supported positive definite radial functions. Adv Comput Math. 1995;4:283–292. [Google Scholar]
- 45.Burr DJ. A dynamic model for image registration. Comput Graph Image Process. 1981;15:102–112. [Google Scholar]
- 46.Chui H, Rangarajan A. A new point matching algorithm for nonrigid registration. Comput Vis Image Underst. 2003;89:114–141. [Google Scholar]


