Abstract
Increasing evidence indicates that soluble aggregates of amyloid beta protein (Aβ) are neurotoxic. However, difficulty in isolating these unstable, dynamic species impedes studies of Aβ and other aggregating peptides and proteins. In this study, hydrogen–deuterium exchange (HX) detected by mass spectrometry (MS) was used to measure Aβ(1–40) aggregate distributions without purification or modification that might alter the aggregate structure or distribution. Different peaks in the mass spectra were assigned to monomer, low molecular weight oligomer, intermediate, and fibril based on HX labeling behavior and complementary assays. After 1 h labeling, the intermediates incorporated approximately ten more deuterons relative to fibrils, indicating a more solvent exposed structure of such intermediates. HX-MS also showed that the intermediate species dissociated much more slowly to monomer than did the very low molecular weight oligomers that were formed at very early times in Aβ aggregation. Atomic force microscopy (AFM) measurements revealed the intermediates were roughly spherical with relatively homogenous diameters of 30–50 nm. Quantitative analysis of the HX mass spectra showed that the amount of intermediate species was correlated with Aβ toxicity patterns reported in a previous study under the same conditions. This study also demonstrates the potential of the HX-MS approach to characterizing complex, multi-component oligomer distributions of aggregating peptides and proteins.
Keywords: amyloid beta protein (1–40), aggregation, hydrogen exchange
Introduction
β-amyloid peptide (Aβ) is the major component of neurotic plaques, one of the hallmarks of Alzheimer’s disease (AD; Haass and Selkoe, 2007; Turner et al., 2003). The “amyloid hypothesis” identifies aggregated forms of Aβ as the neurotoxic agent in the disease (Soto, 1999). In the past few years, growing evidence suggests that low molecular weight oligomeric species, such as Aβ-derived diffusible ligands (ADDLs) or protofibrils are also neurotoxic (Bucciantini et al., 2002; Kayed et al., 2003; Kirkitadze et al., 2002; Lambert et al., 1998) and may represent off pathway intermediates (Necula et al., 2007).
Amyloid fibril structure has been extensively studied by solid state NMR (Antzutkin et al., 2002; Petkova et al., 2004), mutagenesis (Williams et al., 2004), and hydrogen exchange (HX; Dzwolak et al., 2006; Hoshino et al., 2002; Kheterpal et al., 2000, 2006; Olofsson et al., 2006; Wang et al., 2003; Yamaguchi et al., 2004). According to HX-MS data, Aβ fibrils have significantly fewer solvent accessible backbone amide hydrogens than protofibrils isolated using size exclusion chromatography (SEC) or stabilized by calmidazolium chloride (CLC; Kheterpal et al., 2003a, 2006; Williams et al., 2005). The most significant difference in backbone solvent accessibility between fibril and protofibrils was observed in the fragment 20–34, which was shown to be more protected in the fibril than in protofibrils (Kheterpal et al., 2006). Using solid-state NMR, Aβ protofibrils were found to have very similar molecular structures as the Aβ fibril (Chimon and Ishii, 2005). These results are consistent with the idea that protofibrils are a fibril precursor, but with a less ordered structure. While structural information was obtained, the kinetics of aggregate interconversion was not thoroughly investigated. Traditional methods, like light scattering, SDS–PAGE or SEC can detect size distributions; however, light scattering is not very useful for complex distributions, and PAGE/SEC cannot provide structural information.
In this study, Aβ samples were examined by amide hydrogen–deuterium exchange labeling without the need for complex sample pre-purification or oligomer stabilizing agents. Subpopulations were assigned based on distinct deuterium exchange patterns and complementary atomic force microscopy (AFM) analysis. HX-MS showed intermediates have more solvent exposure than fibril and less than monomer. There was a correlation between abundance of intermediates measured here and previously reported neurotoxicity patterns studied under the same conditions. Taken together, the results support the hypothesis that Aβ is more toxic in oligomeric rather than fibrillar form. Further, the study demonstrates that HX-MS is a useful method for simultaneously measuring changes in structure and population distributions during protein and peptide aggregation.
Materials and Methods
Materials
Aβ(1–40) was purchased from Anaspec, Inc. (San Jose, CA) as 1.0 mg lyophilized aliquots. One lot of Aβ was used for all studies. Other chemicals were from Sigma (St. Louis, MO) unless specified.
Aβ Sample Preparation
Stock solutions of Aβ were prepared by dissolving an aliquot of Aβ in 100 µL 0.1% trifluoroacetic acid (TFA, Fluka, Buchs, Switzerland) to a concentration of 10 mg/mL at 25±0.5°C. After 45 min of dissolution in TFA, “fresh samples” were made by diluting the stock to a final concentration of 100 µM in PBS (10 mM NaH2PO4, 150 mM NaCl, pH 7.4). Aged samples were prepared by diluting TFA stock in PBS and then quiescently incubating at 37°C for 4, 10, or 72 h before labeling. Fibrils were prepared by incubating for 6 days under the same conditions and were washed immediately prior to labeling. Briefly, a 100 µL fibril sample was centrifuged at 13,000g for 10 min, then 90 µL supernatant was removed. To minimize sample losses, this was done only once. This washing step was not performed for other samples except as specified.
Congo Red Binding Assay
Congo Red solution (120 µM in PBS) was first filtered through 0.22 µm filter three times, and then mixed 1:9 vol/ vol with 100 µM Aβ samples aged for different aggregation periods. After 45 min incubation with Congo Red at room temperature, absorbance was measured at 405 and 541 nm by a SpectraMax Plus384 Microplate Reader (Molecular Devices, Sunnyvale, CA). For each aggregation period, at least three replicates were measured. The amount of Aβ fibril was calculated as previously described (Klunk et al., 1999): [AβFIB] = (541At/4780) − (403At/6830) – (403ACR/8620), where 541At and 403At are the total absorbance of the Congo Red-Aβ mixtures at 541 and 403 nm, respectively, and 403ACR is the absorbance of Congo Red alone in phosphate buffer. In the microplate reader, absorbance at 405 and 540 nm were assumed to be same as those at 403 and 541 nm (Lee et al., 2007).
Hydrogen Exchange Labeling
To initiate labeling, 45 µL of D2O (Cambridge Isotope Laboratories, Andover, MA, D 99.9%) was combined in a 1.5 mL Eppendorf centrifuge tube with a 5 µL solution of Aβ sample. The molar D% in the solvent was 90%, and the pH (as read) was 7.0. Labeling was carried out at ambient temperature for 10 s, 1 min, 10 min, 30 min, and 60 min unless otherwise specified. For washed fibrils, 90 µL D2O was added to 10 µL of fibril suspension to keep the molar D% of the final mixture at 90% during labeling. After labeling, the fibril sample was again centrifuged at 13,000g for another 10 min, and supernatant was carefully wicked off using filter paper.
After labeling, a mixture of 150 µL of dimethylsulfoxide (DMSO) and dichloroacetic acid (DCA, Fluka), 95:5 vol/vol, was used to rapidly dissociate aggregates back to monomer state and quench the labeling reaction (Whittemore et al., 2005). This step was performed at room temperature at pH 3.5 and completed in less than 5 s prior to LC/MS analysis.
HPLC Procedures
After quenching by DMSO/DCA, the mixture was injected into a 100 µL sample loop and loaded (Rheodyne 7725i) onto a C8 peptide trap cartridge (Micro TrapTM 1 mm ID × 8 mm, Michrom Bioresources, Inc., Auburn, CA). After desalting for approximately 1 min, a switching valve (Valco Instruments Co., Inc., Houston, TX) directed a 30–80% B gradient over 2 min into the C8 trap. Solvent A was ddH2O with 0.1% formic acid (Acros Organics, Morris Plains, NJ) and 0.01% TFA. Solvent B was HPLC grade acetonitrile (Burdick & Jackson, Muskegon, MI) with 0.2% formic acid. The eluent was sent directly to the electrospray ionization (ESI) source of an ion trap mass spectrometer (details below) at a flow rate of 50 µL/min. The gradient was provided by a Surveyor MS pump (Thermo Finnigan, San Jose, CA). To minimize the back-exchange during the analysis, all the columns, loops, lines and valves were precooled for 1 h and immersed in ice during all the experiments.
Mass Spectrometry and Fitting Methods
Aβ peaks, including +3, +4, +5, and +6 charge states, were observed in full scan mode, and the most abundant +4 state was selected for analysis. Data were collected in positive ion, zoom scan, and profile mode on a Thermo Finnigan LTQ linear quadrupole ion trap mass spectrometer (San Jose, CA) with a standard ESI source. The ESI voltage was 4.5 kV, capillary temperature 275°C, sheath gas flow rate 20 units, and tube lens voltage 135 V. All mass spectra presented were averages of approximately 600 scans.
Peak positions were calculated as the centroid mass for an isolated single peak. When multiple peaks were present, spectra were fit to the sum of two or three Gaussian peaks, using the solver algorithm in Microsoft Excel (Jorgensen et al., 2004). To avoid inclusion of positive noise outside the window of interest, the tails of the spectrum below 5% were not fit and peak widths were constrained. The position of each Gaussian peak used as the centroid mass. The amplitude and width were used to calculate the relative area of each peak. Triplicate samples were analyzed, and the standard deviation of the centroid mass was less than 1.5 Da and the relative standard deviation of the relative abundance was 10–15%.
In order to detect aggregates in mass spectra, they were dissolved back to a monomeric state using organic solvents as previously reported (Kheterpal et al., 2000; Wang et al., 2003; Whittemore et al., 2005). In our protocol, the mixture loaded to HPLC consisted of H2O/D2O/DMSO/DCA (2.5/ 22.5/71.2/3.8 vol%). The lower concentration of DMSO/ DCA relative to the previous application, DMSO/DCA (95/5 vol%; Whittemore et al., 2005), slowed dissolution rates. Thus, it was essential to evaluate how much aggregates were dissolved and recovered in the mass spectra. The total dissolution efficiency, f, was determined as the percentage of total ion count (TIC) area of aggregated samples relative to that of fresh samples for the same loading amount in mass (1 µg per injection). This efficiency was determined to be 85% for 4 and 10 h aged samples and 60% for the 72 h aged samples. These results compared favorably with approximately 50% recovery previously obtained for Aβ fibrils (Kheterpal et al., 2000).
Accounting for Back-Exchange
Back-exchange refers to the loss of incorporated deuterium labels due to exchange with HPLC solvents that contain exchangeable hydrogens (e.g., H2O) during analysis. For a fully labeled Aβ monomer, the number of backbone amide deuterons can decrease from 39 to 24 in just 8 min even at pH 3.5 and 4°C, as calculated by HXPep (program graciously provided by Dr. Zhongqi Zhang). Therefore, the analysis time was limited to approximately 2 min to minimize back exchange. To account for partial loss of deuterium labels due to back-exchange, the following correction method was adapted (Kheterpal et al., 2003b).
| (1) |
| (2) |
| (3) |
In Equations (1–3), MW is the measured average molecular weight of Aβ in H2O (4329.7 ± 0.5 Da), m0 is the centroid mass of unlabeled Aβ carried through the entire protocol, m100 is the centroid mass of completely labeled Aβ carried through the protocol, and m is the measured centroid mass for Aβ at various labeling times. N is the backbone amide protons available for the exchange, 39. The m100 of monomer was obtained by dissolving lyophilized Aβ in DMSO and diluting into D2O (Wang et al., 2003). DMSO can completely dissolve Aβ into a fully solvent exposed state (Kremer et al., 2000; Wang et al., 2003). Because DMSO has no exchangeable protons, the molar exchangeable D% in this solution was 100%. The m100 of fibril was obtained by processing Aβ exactly as described in the Aβ Sample Preparation Section, except that all the solutions were prepared in D2O instead of H2O. The m100 value for fibril and monomer were 4361.4 ± 0.1 and 4361.9 ± 0.2 Da, respectively. Thus, 7.3 and 6.8 deuterons were calculated as the back exchange (BE) in Equation 3 by using m100 from fibril and freshly prepared monomer, respectively. The latter was used as the standard BE in the paper (6.8 = 4329.7 + 39 − 4361.9). To adopt the above correction method, two additional points needed to be modified. First, solvents without D2O were used to elute the sample to the ESI source. In contrast, either 10% or 18.2% D2O presented in the in the previous application of this correction method (Kheterpal et al., 2003b). Thus, m0 equals MW in our protocol, and deuterons incorporated during analysis time (FE) should be neglected for our data. Secondly, in the labeling step, 90% instead of 100% D was used for our experiments (Kheterpal et al., 2000, 2003a, 2006). Therefore, in order to compare with literature data, the corrected deuterium content was defined as
| (4) |
where η is the fraction of deuterium in the labeling solvent, 0.9 for our study.
Hydrogen Exchange Control Experiments
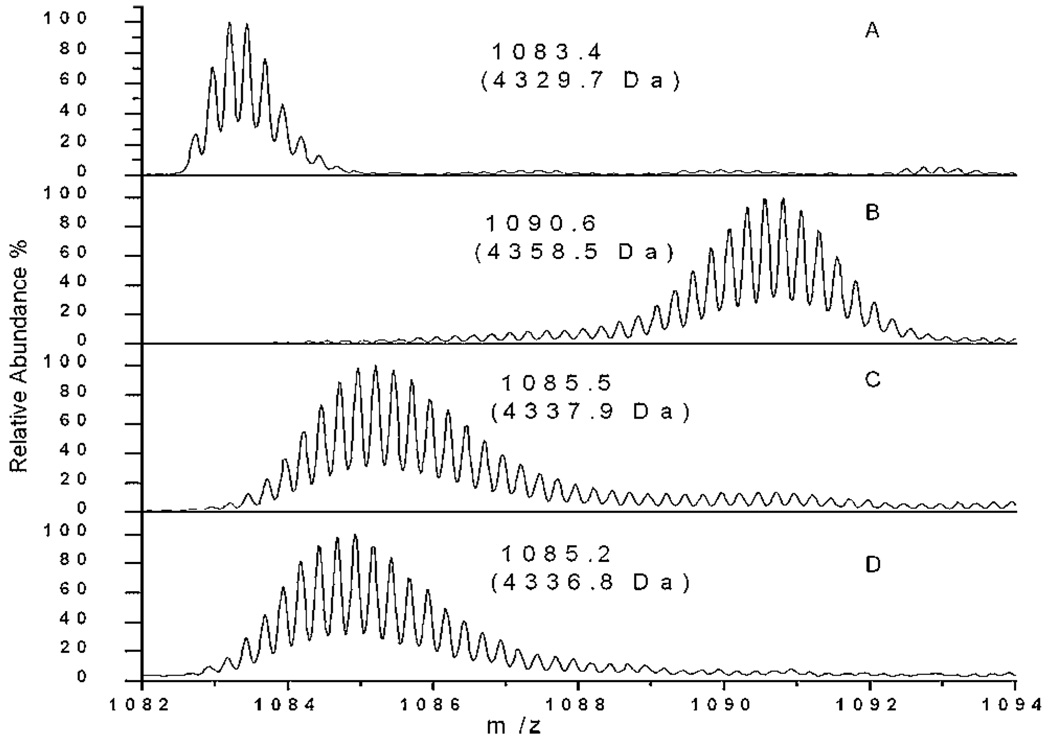
Useful MS reference spectra are shown in Figure 1. Figure 1A shows Aβ dissolved in DMSO and diluted into H2O at 100 µM. Immediately after preparation, 5 µL of this sample was diluted with 45 µL H2O, and 150 µL quench buffer was subsequently added. The mixture was injected as described in HPLC Procedures Section. The measured centroid mass was 4329.7 ± 0.5 Da, quite close to the theoretical mass (4329.9 Da). Freshly diluted Aβ was prepared as above and then 10-fold diluted with D2O. After 1 h labeling at 90% D, it was quenched and detected as shown in Figure 1B with a centroid mass 4358.5 ± 0.6 Da. Aβ has 39 amide backbone protons available for exchange, thus a maximum of 35.1 protons can be exchanged when 90% D used. The back-exchange removed 6.8 deuterons. So the calculated mass for this sample should be 4358.0 Da, which is in good agreement with the observation. Since all the following experiments were performed under same labeling conditions, this mass value was taken as the fully labeled control. The fibrils were prepared and processed as described above in the Aβ Sample Preparation Section. After 24 h labeling at 90% D, one major peak presented with the centroid mass (4337.9 ± 1.0 Da), shown in Figure 1C. The corrected deuterium content Dcorr is 16.6 ± 1.0, which is consistent with the reported value 17.2 ± 0.6 (Kheterpal et al., 2006). Therefore, our HX-MS protocol was capable of preserving sufficient labeling information with limited back exchange, and matching previous literature values for Aβ fibrils.
Figure 1.
Representative control Aβ mass spectra. (A) Unlabeled, freshly diluted Aβ; (B) completely labeled, freshly diluted Aβ in 90% D2O; (C) 24 h labeling of Aβ centrifuged 6-day fibril samples; (D) 24 h labeling of centrifuged 72 h Aβ samples (see Results Section). For details of centrifugation, see Aβ Sample Preparation Section. Only the most intense charge state (+4) is shown in zoom scan. The centroid molecular mass is shown in parentheses for each spectrum. Each spectrum is normalized to its own maximum intensity.
Atomic Force Microscopy
Images of Aβ as a function of aggregation were obtained at 22°C using a multimode atomic force microscope (Nanoscope IIIa; Digital Instruments, Santa Barbara, CA) equipped with a pico-force piezoscanner. Aβ samples were prepared as described above and then diluted to 10 µM immediately before application to a freshly cleaved mica surface. Aβ was allowed to bind to the mica surface for 5 min, and then washed three times with 0.01 M phosphate buffer (pH 7.2). The wetted samples and the AFM fluid cell were mounted onto the microscope stage. Fresh phosphate buffer was injected through the ports on the fluid cell during experiments to account for evaporation loss. Contact-mode imaging was carried out with a silicon nitride cantilever (200 mm × 18 mm; Park Scientific Instruments, Sunnyvale, CA) held in a fluid cell. Height and deflection images of Aβ in buffer were obtained with a scan rate of 1 Hz and an integral gain of 0.3.
Results
Congo Red Binding Assay
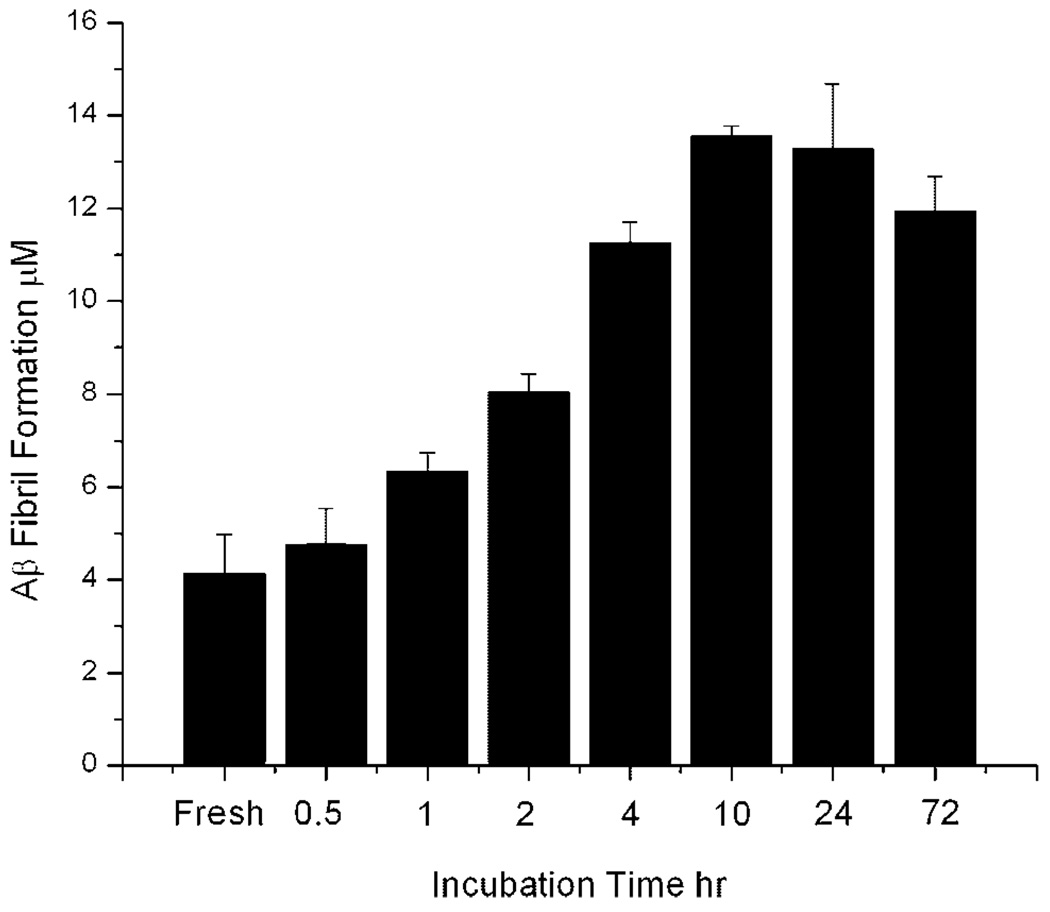
Congo Red binding was used to established the aggregation kinetics of Aβ under our conditions. As shown in Figure 2, the fibril formation using our dissolution and aggregation procedures had a short lag period. Within 1 h, a significant increase in Congo Red binding was observed, with saturation in binding occurring after 4 h. While the aggregation kinetics was rapid for our particular conditions, the relative amount of different oligomeric forms is uncertain, as Congo Red can bind at least both protofibril and fibril (Walsh et al., 1999).
Figure 2.
Congo Red binding measurements of Aβ aggregation as a function of incubation time. Aβ (100 µM) was quiescently incubated at 37°C as described in Aβ Sample Preparation Section.
Hydrogen Exchange Kinetics of Freshly Prepared and Aged Samples of Aβ
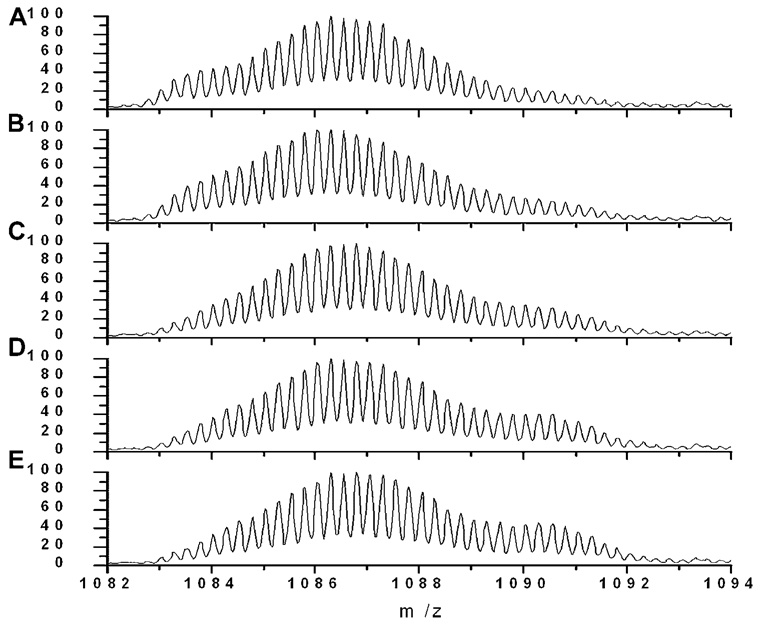
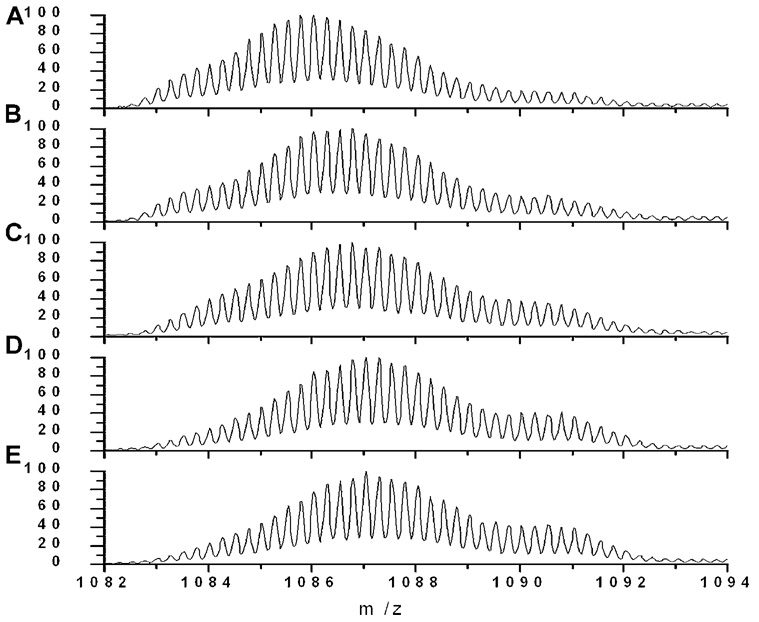
Hydrogen exchange labeling was carried out for fresh and aged samples of Aβ at different labeling times to assess how peptide aggregation affects peptide backbone solvent accessibility. Representative mass spectra of freshly prepared Aβ are shown in Figure 3. Bimodal isotope envelopes were observed at all labeling times for fresh Aβ samples. One of the components was a broader, low mass peak, and the other was a narrower, high mass peak. After 10 s labeling, the high mass peak was nearly half of the total signal and had a centroid (4358.0 ± 1.1 Da) within error of the fully labeled control (4358.5 ± 0.6 Da). This complete labeling indicates complete solvent exposure, consistent with the idea that freshly prepared sample contains a significant portion of unstructured, likely monomeric Aβ. The well-resolved second peak at lower mass is prominent in Figure 3, with a centroid approximately 13 Da less than monomer after 10 min labeling.
Figure 3.
Representative mass spectra of TFA/PBS fresh sample at different labeling times: (A) 10 s, (B) 1 min, (C) 10 min, (D) 30 min, and (E) 60 min. Each spectrum is normalized to its own maximum intensity.
Two peaks in a HX mass spectrum could arise from either two nonexchanging populations of peptide with different solvent exposure, or from a single population at equilibrium exchanging between folded and unfolded states in the EX1 kinetic regime. The more protected peak did not increase in mass dramatically with labeling time and decayed in amplitude as the experiment proceeded. This behavior is consistent with the EX1 kinetic regime of exchange, where the intrinsic labeling rate of solvent exposed residues is much greater than the rate of folding or association to a solvent protected state. In the EX1 regime, the relative fraction of the two species at zero labeling time indicates the relative proportion of protected and unprotected species at the beginning of the experiment (Qian and Chan, 1999). At the first time point (10 s) roughly half of the molecules were not fully labeled. This is consistent with previous studies indicating that freshly dissolved Aβ under similar conditions is a mixture of monomer and a very low molecular weight oligomers that migrates roughly as a dimer, as assessed by SEC and native PAGE (Lee et al., 2007; Pallitto and Murphy, 2001; Wang et al., 2003). Thus, it appears that the more protected peak in Figure 3 arises from low molecular weight oligomers, perhaps as small as dimer. The broad nature of the oligomer peak could be due to the stochastic labeling patterns that arise during intermediate degrees of labeling, and/or a distribution of species with slightly different degrees of oligomerization.
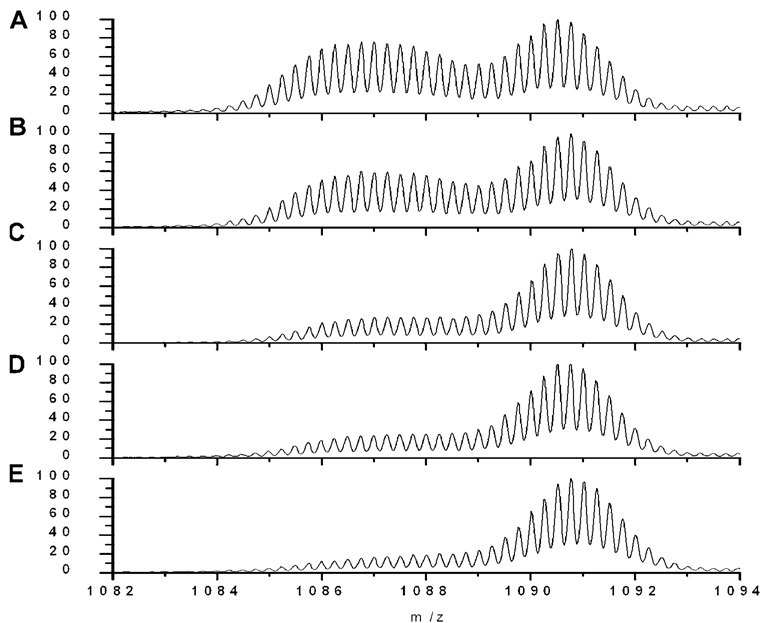
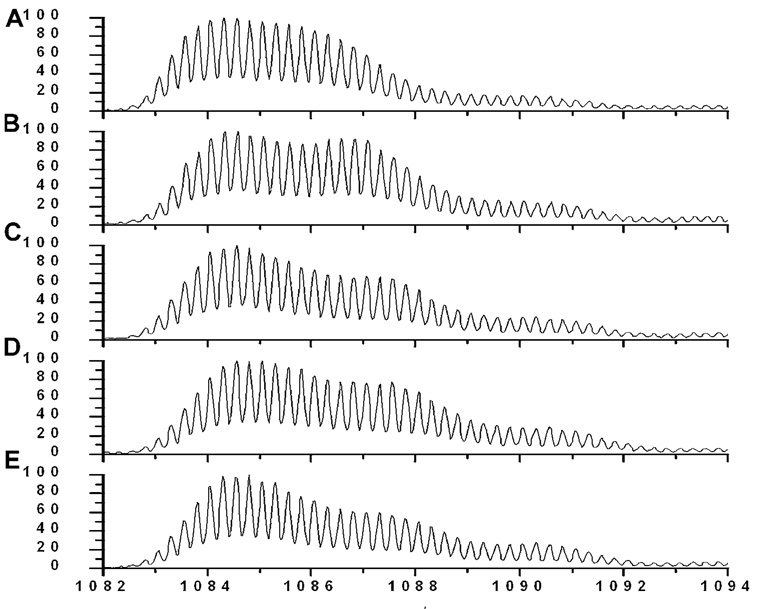
In mass spectra of the 4 h aged samples (Fig. 4), a wide mass envelope with multiple overlapping peaks extending from low to high mass range was observed, indicating that the species present after 4 h of aging had a very different distribution of solvent accessibilities. The predominant peak was labeled to an extent significantly less than monomer and more than the fibril peaks at all labeling times. After labeling for 1 h (Fig. 4E), this peak exhibited a centroid mass of 4343.3 ± 0.9 Da. The degree of labeling is significantly less than monomer (4358.0 ± 1.1 Da) and the low molecular weight oligomers observed in the freshly prepared peptide samples (4346.0 ± 0.9 Da). On the other hand, it is more solvent exposed than our fibril samples as well as those previously reported (Whittemore et al., 2005). A poorly resolved shoulder that is even more protected than the intermediate was most evident at short labeling time (10 s and 1 min) and became more poorly resolved at later times. This was observed consistently in replicates and 10 h aged samples (Fig. 5). The slower appearance of the fully labeled species compared to species observed in the freshly prepared Aβ samples indicates that a new (or unique) oligomeric species was present in the 4 h aged Aβ samples that had slower dissociation or unfolding kinetics compared to the low molecular weight oligomer in the fresh sample.
Figure 4.
Representative mass spectra of TFA/PBS 4 h aged samples at different labeling times: (A) 10 s, (B) 1 min, (C) 10 min, (D) 30 min, and (E) 60 min. Each spectrum is normalized to its own maximum intensity.
Figure 5.
Representative mass spectra of TFA/PBS 10 h aged samples at different labeling times: (A) 10 s, (B) 1 min, (C) 10 min, (D) 30 min, and (E) 60 min. Each spectrum is normalized to its own maximum intensity.
Figure 5 shows that 10 h aged samples produced HX-MS spectra very similar to that of 4 h aged samples (Fig. 4). For the 10 h aged samples, the major peak had a similar centroid mass after 1 h labeling (4342.9 ± 1.3 Da) as the predominant peak in the 4 h aged sample (4343.3 ± 0.9 Da). Further, the overall shape of the distribution and the slow growth rate of the fully labeled peak were also similar to the 4 h aged samples. Thus, we conclude that the 4 and 10 h aged samples contained similar distributions of oligomeric species with similar backbone solvent accessibility.
Distinctly different species distributions were observed for 72 h samples (Fig. 6). At 10 s labeling time, the mass distribution showed a broad peak that was located at low m/z range and a minor component at the fully solvent exposed mass. After 1 h labeling, the major component of the broad peak remained at the mass near that observed for fibrils that were formed upon 6 days of aggregation (4333.5 ± 0.3 Da). The middle peak (4342.4 ± 0.5 Da) showed a labeling trend similar to the predominant peak in 4 and 10 h aged samples. A small fraction of fully labeled peak was also observed.
Figure 6.
Representative mass spectra of TFA/PBS 72 h aged samples at different labeling times: (A) 10 s, (B) 1 min, (C) 10 min, (D) 30 min, and (E) 60 min. Each spectrum is normalized to its own maximum intensity.
To certify that the lowest mass peak arose from the fibrillar component the sample, the 72 h sample aged was centrifuged at 13,000g and resuspended to remove low molecular weight oligomers. After 24 h labeling, the washed pellet showed almost identical mass spectra (Fig. 1D) as the fibril sample after 24 h labeling (Fig. 1C). Both samples are almost devoid of peaks identified above as monomeric, low molecular weight oligomers, intermediates and contain only the most protected form of Aβ. In addition, the most protected peak in Figure 6 had comparable deuterium content to literature report of mature fibrils incubated under similar conditions. For 1 and 24 h labeling respectively, we observed a gain of 11.4 and 15.4 deuterons versus a literature report of 12.0 and 17.2 deuterons (Whittemore et al., 2005). These results also support the conclusion that the low mass peak in the 72 h sample (Fig. 6) arises from the fibrillar Aβ peptide subpopulation.
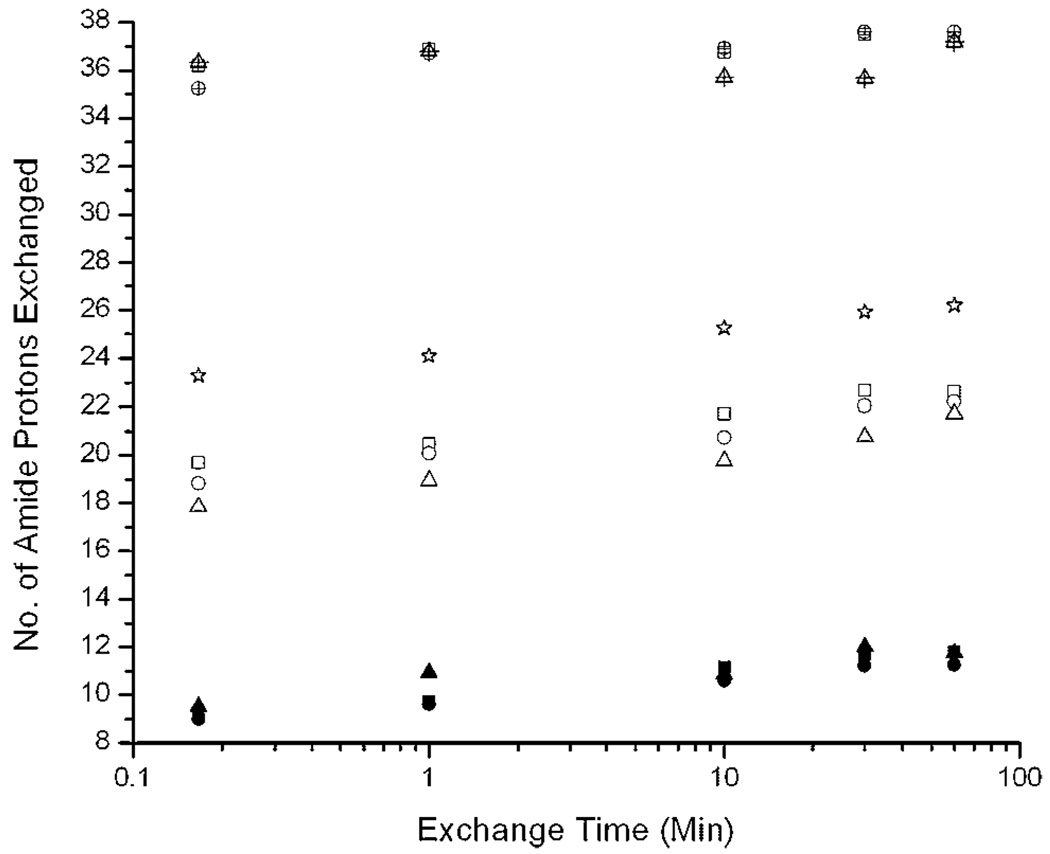
Figure 7 shows the corrected deuterium content, Dcorr, of each peak observed in the Aβ samples as a function of labeling time. It is clear from the mass spectra in Figure 4–Figure 6 that the relative abundance of each peak varied for samples aged for different times. However, the centroids the intermediate and fibril peaks increased only slightly with exchange time. Also, all aged Aβ samples showed peaks were observed with similar extent of labeling, suggesting the same aggregated species were present but with different relative abundance at different aggregation times. The low mass peak had a similar degree of deuteration as the washed fibrils as discussed above. The intermediate mass peak observed behaved analogously to Aβ protofibrils described by others (Kheterpal et al., 2003a; Williams et al., 2005). Because of differences in preparation and characterization procedures between this and other studies, we cannot make a specific oligomeric structural assignment in comparison to previous reports. However, it is clear that we are distinguishing different oligomeric forms of Aβ in terms of solvent accessibility. Further, the dissociation rates of these oligomeric forms are slow compared to the intrinsic labeling rates, such that EX1-like exchange was consistently observed.
Figure 7.
Number of amide protons exchanged versus exchange time for different peaks from samples aged for different times. Aging times: (square) 4 h, (circle) 10 h, (triangle) 72 h. Sample peaks, as referred to in text: (filled symbols) fibril peak, (open symbols) intermediates, (star) low molecular weight oligomers in fresh sample, (crossed symbols) monomer. All the values were calculated according to Equation (4) with peak centroids determined by nonlinear least squares fitting as described (see Materials and Methods Section). Symbol locations represent the average of three replicates. Averaged standard deviations for all the replicates were ±0.8 Da.
Finally, Figure 7 shows that the high mass peak in the aged samples incorporates more than 35 protons in 10 s, and then slowly gains a few deuterons. After 1 h labeling, it has a lower mass (4356.5 ± 1.1 Da) than the monomer in fresh sample (4358.0 ± 1.1 Da). Given the small fraction of this component, it is difficult to determine whether this difference is insignificant, or whether it reflects another protected state, perhaps a product of the sequential dissociation of partially protected oligomeric species or protofibrils (Kheterpal et al., 2003a) to structured monomer (Chen et al., 1997).
AFM Imaging
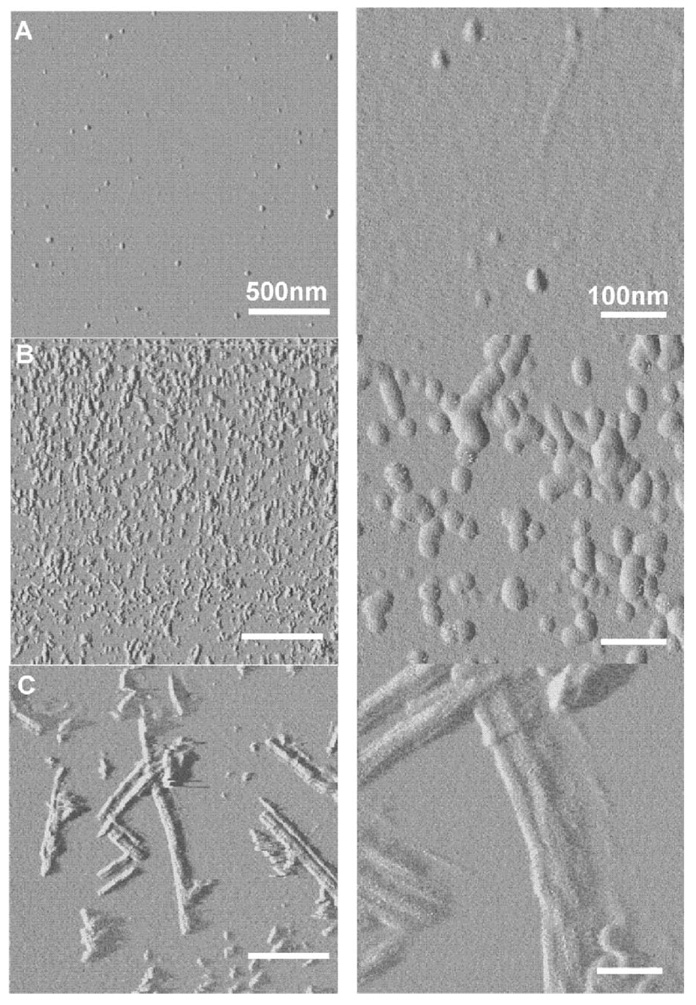
AFM imaging was used to complement the assignment of peaks in HX mass spectra to different oligomeric structures. Figure 8 shows a series of AFM images of fresh, 10 and 72 h aged Aβ samples. In the fresh sample, only a few isolated Aβ aggregates of 10–30 nm diameter were observed (Fig. 8A). These spots are larger than expected for individual monomeric Aβ (Stine et al., 2003), indicating they probably were small aggregates produced during sample preparation or that remained after peptide dissolution. However, they were present at much lower density compared to the aggregates observed at longer aging times (Fig. 8B and C). The 10 h sample (Fig. 8B) showed a much higher density of 30–50 nm ellipses. Interestingly, many of them appeared adhered to each other (Fig. 8B zoom), suggesting they were either in the process of aggregating into larger structures or came from dissolution of even larger aggregates. The 72 h sample (Fig. 8C) was a mixture of long fibril, short linear aggregates and a much smaller fraction of spherical aggregates like those observed for the 10 h samples. More spherical aggregates along with fibrils have been observed in 72 h aged Aβ samples in electron microscopy preparations (Lee et al., 2007). Figure 8 shows fibril diameters were approximately 15 nm and their lengths were greater than 100 nm. Figure 8 shows that fibrils were only present in the 72 h samples, also consistent with the above identification of the least protected species in the our HX spectra being fibril. Further, Figure 8 shows that the 72 h and especially the 10 h samples contained larger molecular weight intermediates, while fresh samples did not. This is consistent with the assignment of the predominant peak in the 10 h spectrum being due to these large molecular weight intermediates.
Figure 8.
Representative AFM images of (A) fresh, (B) 10 h, and (C) 72 h aged samples. The images in the right column correspond to zoomed images corresponding to those in the left column. The scale bar represents (left) 500 nm and (right) 100 nm.
Quantitative Analysis of Labeling Distributions
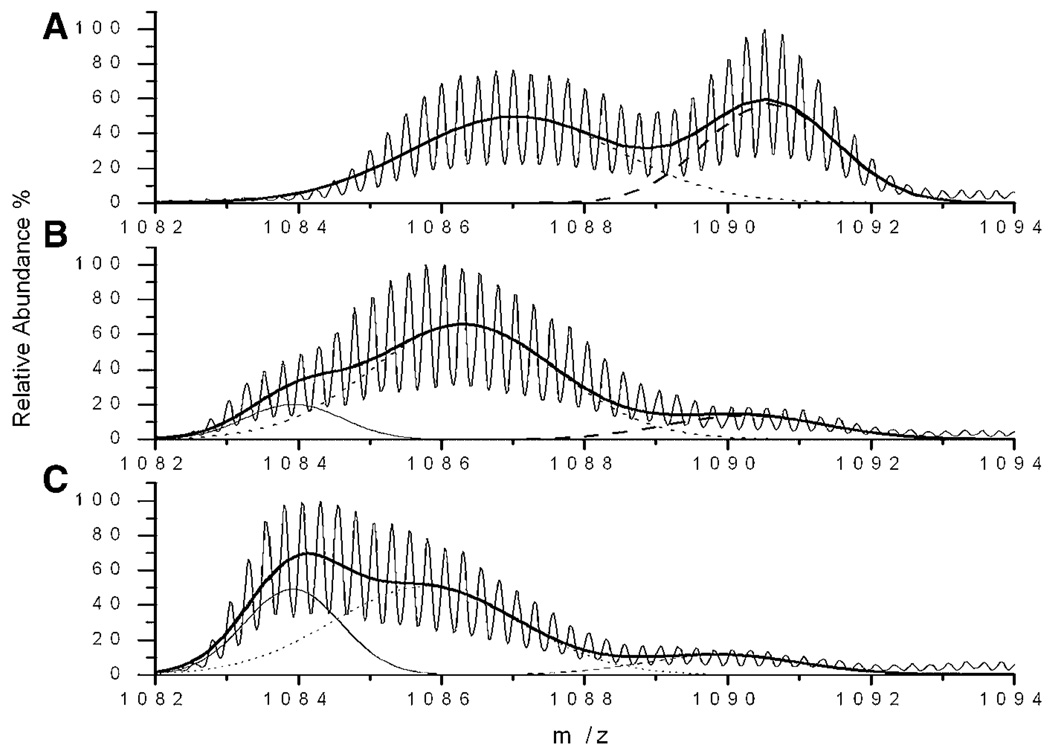
To further quantify distributions of deuterated species, it is important to consider whether the hydrogen exchange mass spectra at our shortest labeling times can be taken to represent a “pulsed labeling” situation (Deng et al., 1999). The first requirement for this interpretation is that complete isotope exchange of the peptide amide linkages of unfolded protein should be accomplished in the labeling time. This is certainly satisfied here based on the subsecond intrinsic rates for solvent exposed polypeptides at neutral pH (Bai et al., 1993). This is also confirmed by the appearance of a fully labeled peak in the fresh samples within 10 s labeling time (Fig. 3A). The second requirement is that the labeling time should be short relative to the time scale of the dynamics of interest. Based on Figure 4–Figure 6 we can conclude that oligomers dissociation to less protected forms or monomer requires much more than 10 s; even the characteristic dissociation of low molecular weight oligomers in Figure 3 is longer than 10 min. The final requirement is that the species of interest gains a different number of deuterons than the unprotected species during the labeling step. As the spectra in Figure 4–Figure 6 show, the intermediate and fibril gained a different number of deuterons after only 10 s labeling. Therefore, the relative abundance of each peak in the mass spectra obtained after 10 s labeling can be used to estimate the relative amounts of each species at the beginning of the labeling period. A representative example for the 10 s labeling of fresh, 10 and 72 h samples is shown in Figure 9.
Figure 9.
Representative curve fitting of hydrogen exchange mass spectra with monomer, intermediate and fibril peaks. The solid curve with many isotope peaks is the original mass spectrum. The Gaussian fits to the isotope distributions are (dashed) monomer, (dotted) intermediate, (thin solid) fibril. Thick solid curve is the ensemble curve of three fitted Gaussian peaks. Examples are shown for (A) 10 s labeling of fresh sample, (B) 10 s labeling of 10 h aged sample, and (C) 10 s labeling of 72 h aged sample.
From the information contained in the 10 s labeling mass spectra, a quantitative analysis was performed to convert relative peak areas into relative amounts of each subpopulation. In particular, we attempted to account for differences in dissolution efficiency that may occur in the rapid HPLC-MS analysis performed. For certain aged sample, that is, 4 h sample, the spectra were considered to consist of three components, (1) fibril, (2) intermediates, and (3) monomer. First, the total relative signal from the sum of the three peaks was measured compared to an equal amount of monomeric Aβ. This relation can be written
| (5) |
where i is the species (1 = fibril, 2 = intermediate, 3 = monomer), ai is the dissolution efficiency for species i, Xi is the actual fraction of species i in 4 h sample and f is the total dissolution efficiency of 4 h sample as defined in Materials and Methods Section.
From curve fitting, the relative area fractions, gi, of the three peaks were obtained from the data. These relative area fractions are related to the dissolution efficiencies and the relative abundances of each species through the following ratios:
| (6) |
From mass balance for the three components, we know that
| (7) |
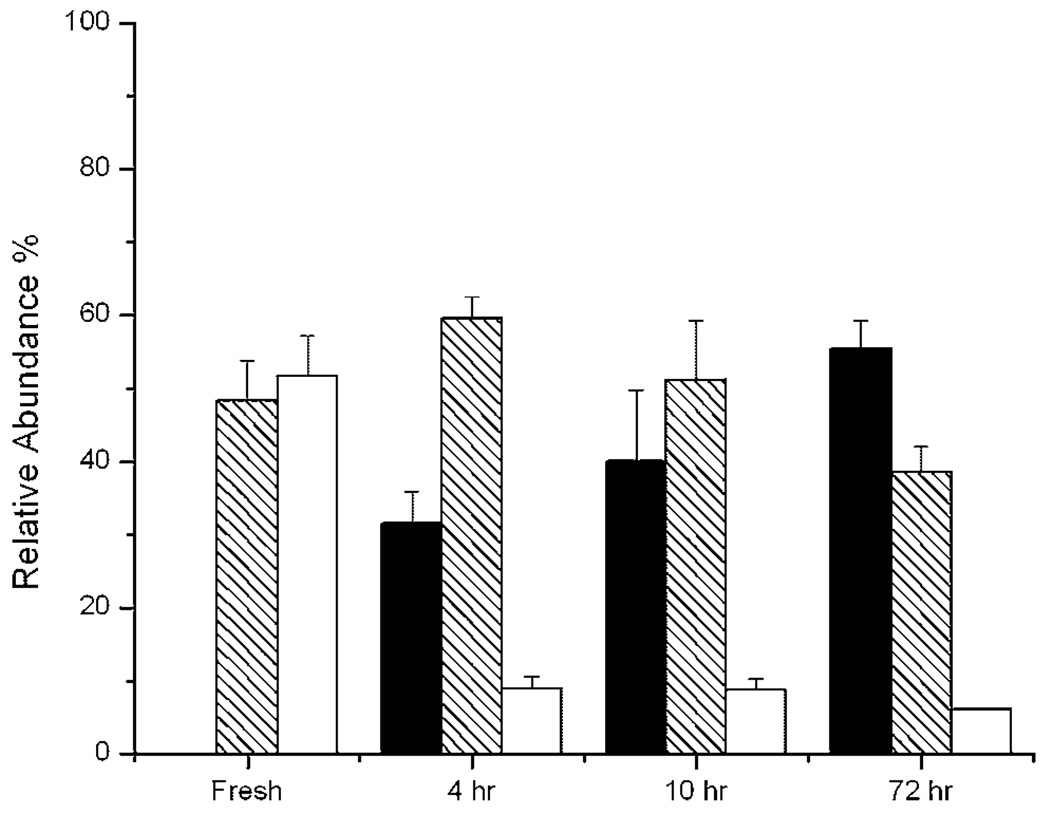
The dissolution efficiency of the reference (monomer sample) is unity (a3 = 1). Then, for each aged sample, the five unknowns are the a1, a2, and the Xi, but only four equations are available (the ratios in Eq. 6 yield two independent equations). Assuming that a1 and a2 are the same for different aging times because of the same dissolution conditions, we used two sets of measurements (f , gi) for two different aging times (e.g., 4 and 72 h) and eight relations from Eq. 5 to Eq. 7 to determine the eight unknowns (a1, a2, and three Xi for two aging times). All the unknowns were obtained from triplicates. The value of a1 was determined to be 0.28 ± 0.04, and a2 was 0.90 ± 0.10. The resulting fractions different oligomeric Aβ species is shown in Figure 10. Intermediates were around 60% of the samples aged for 4 and 10 h, while they were only 40% of the sample aged for 72 h. In contrast, the relative abundance of fibril increased from about 20% of the 4 h sample to about 60% of the 72 h sample. The relative abundance of monomer was approximately 10% in all the aged samples. In addition, the sum of the intermediate and fibril fractions was almost identical in the 4, 10, and 72 h samples. This would be consistent with Congo Red binding assay, if our large molecular weight intermediates bound Congo Red due to their large size (Walsh et al., 1999). In this regard, HX-MS was superior to the Congo Red assay, as it could distinguish intermediates and fibrils by their different solvent accessibilities. The qualitative correspondence between labeling distributions, Congo Red assay and AFM suggests that we are obtaining at least a qualitatively representative view of the distribution of oligomers structures in these samples.
Figure 10.
Relative abundance of Aβ oligomeric components in fresh and aged Aβ samples determined by hydrogen exchange mass spectrometry after 10 s labeling. For the fresh sample, the shaded bar is the low molecular weight oligomer (m/z∼ 1087.0), and open bar is the monomer (m/z∼ 1090.5). For aged samples, filled bars are fibril (m/z∼ 1083.7), shaded bars are intermediates (m/z∼ 1086.2), and open bars are monomer (m/z∼ 1090.0). The abundance of each species was fitted and calculated as described in Quantitative Analysis of Labeling Distributions Section.
Discussion
For the past two decades, HX-MS has been widely applied to characterize protein conformation. Its ability to directly study disordered and uncrystallizable aggregates (Nettleton et al., 2000; Tobler and Fernandez, 2002) makes it an appealing approach for analyzing Aβ oligomeric species. When studied in isolation, protofibrils, and fibrils of Aβ have all previously shown HX patterns distinct from monomer (Chen et al., 1997; Jablonowska et al., 2004; Kheterpal et al., 2000, 2003a; Kraus et al., 2003; Wang et al., 2003). However, purified fractions of each species were used for those studies, and mixtures were not investigated. Here, we have implemented a HX-MS technique that allows the simultaneous estimation of the solvent accessibility of each species, as well as the distribution of various structural species in an Aβ mixture. By making the HX-MS measurement directly on mixed, aged samples without pre-purification or use of stabilizing agents, there is greater assurance that Aβ structures and distributions obtained are representative of those present during in vitro toxicity studies. SEC has been be used to characterize soluble oligomer size distributions but do not provide structural information (Murphy, 2007; Pallitto and Murphy, 2001). Chemical modification methods such as PICUP (Bitan et al., 2003) are an alternative, but chemical modification comes with the possibility of introducing a change in Aβ structure during the measurement. The HX-MS approach developed here can be applied to mixtures without purification or introduction of chemical agents.
It should be acknowledged that as implemented here, HX-MS alone does not provide detailed information about the state of folding (e.g., secondary or tertiary structure) or degree of oligomerization of intermediates. Further, it is not possible to distinguish such species with high resolution (e.g., dimers from trimers, etc.). However, we have shown that combined with complementary analysis, the identity of resolved components in distributions can be made, and a quantitative analysis of the results is possible. This is particularly important for the intermediates which are challenging to study by any method—both those observed in the 4 and 10 h samples, as well as in the more rapidly dissociating intermediates observed in freshly diluted Aβ samples.
For the freshly prepared samples of Aβ, the ratio of monomer to low molecular weight oligomer is approximately 1:1. This indicates that a fair amount of structured oligomer was formed promptly once diluted into PBS buffer. The HX-MS measurement itself does not indicate the size of the oligomer, but it must be sufficiently strongly associated both structurally and kinetically to exclude solvent (Paterson et al., 1990). AFM image of fresh Aβ sample does not show many oligomers of significant size (AFM Fig. 8A), suggesting that if the protected species is an oligomer, it is small. Monomer, dimer and trimer, formed by Aβ(10–30) fragments in ammonium acetate pH 7.0, were reported to have similar, highly exposed (>90%) hydrogen exchange patterns after only 6 s (Jablonowska et al., 2004). This longer time constant for protection in our case is likely due to additional stability provided by the additional residues. In particular, residues 31–36 are proposed to be important components of β-sheet structure of fibril by both proline mutagenesis (Williams et al., 2004) and solid-state NMR (Petkova et al., 2004). Therefore, the species formed immediately upon dissolution of Aβ(1–40) into PBS is likely a distinct oligomeric species from the low molecular weight oligomer formed in ammonium acetate by Aβ(10–30).
The hydrogen exchange kinetic data for the fresh Aβ samples like that shown in Figure 3 were analyzed using a model for the EX1 exchange kinetics regime, assuming dissociation of a dimer to monomer (see Supplementary Information). While we have not established the protected species in Figure 3 is a dimer, this modeling approach provides a starting point for quantitative interpretation and comparison of the fresh sample HX-MS data with other studies (Fogle et al., 2006). Triplicates collected for a range of labeling times were fitted well by the model (see Supplementary Information). From the fit, a dissociation rate constant of 0.43 ± 0.08 (10−3 s−1) was obtained. This value is of the same order as the value of 0.92 ± 0.13 (10−3 s−1), obtained using for a similar model applied to surface plasmon resonance data for Aβ(1–40) under similar, although not identical conditions (Hu et al., 2006). This dissociation time scale is also consistent with the ability to separate a similar low molecular weight oligomer from monomer in longer than 30 min by SEC (Pallitto and Murphy, 2001). Moreover, in those studies, a comparable ratio of low molecular weight oligomer to monomer was observed in SEC chromatograms as we observe in the 10 s labeling time HX mass spectrum (Fig. 3A).
Monomeric Aβ made up a much smaller fraction of the initial labeling distribution for the 4 and 10 h aged samples (Fig. 4 and Fig. 5) compared to the freshly diluted Aβ samples. The relative abundance of the fully labeled Aβ peak increased only modestly with longer labeling times. This indicates a slow dissociation rate of the intermediate species to solvent exposed monomers with a time constant longer than our longest labeling time (1 h). For the 72 h aged sample (Fig. 6), similar behavior was observed. Our observation of no detectable fibril dissociation on 1 h time scale is consistent with previous reports of fibril dissociation occurring over much longer time scales (Cannon et al., 2004; Hasegawa et al., 2002). Similar behavior was also demonstrated for SH3 fibril (Carulla et al., 2005).
For fibril formation, we have insufficient kinetic data to propose a detailed kinetic model. However, a highly protected species corresponding to washed fibrils (Fig. 1C) is clearly observed in the HX-MS spectra of 72 h aged samples (Fig. 6) and that species can be isolated from lower the intermediates by centrifugation (Fig. 1D). More importantly, as shown in both the HX-MS (Fig. 5 vs. 6) and AFM (Fig. 8B vs. C), the predominant subpopulation changed from intermediates (4 and 10 h) to fibril (72 h). This indicates that these are at least temporal precursors of fibril. Recently, it has been proposed that oligomers are off-pathway intermediates (Necula et al., 2007). If so, under these conditions at least, they make up a significant fraction of material. Further, if they are to dissociate to more solvent exposed species before incorporation into fibrils, they do so with time constants much longer than our 1 h labeling times.
The proportion of intermediate present measured here is correlated with Aβ neurotoxicity reported in a previous study under the same aggregation conditions (Patel and Good, 2007). In that study, SY5Y cells treated with 100 µM Aβ pre-incubated for 4 and 8 h showed much lower relative viability than cell cultures exposed to fresh and 72 h aged Aβ. The mass spectrometry determinations of oligomer subpopulations made here (Fig. 10) showed that the intermediates are most abundant at 4 h, when toxicity was greatest. The AFM results further strengthened this correlation. In 4 h aged sample, the spherical species about 30–50 nm in diameter predominates (Fig. 8B). These intermediate aggregates only account for a small fraction of total Aβ in both fresh and long time aged samples (72 h). A similar correlation between the concentration of intermediates and toxicity has also been found by other groups, though the intermediates exhibit different morphologies and are given different names, including low molecular weight oligomers, ADDLs, spherical aggregates, and protofibrils (Bucciantini et al., 2002; Dahlgren et al., 2002; Demuro et al., 2005; Gong et al., 2003; Kayed et al., 2003, 2004; Kirkitadze et al., 2002; Lambert et al., 1998; Lee et al., 2007; Lesne et al., 2006; Walsh et al., 2002).
In summary, for the first time, hydrogen exchange detected by mass spectrometry has been used to estimate distributions of aggregates in Aβ samples. Complementary measurements with AFM allowed assignment of distinct contributions in the distribution to monomer, very low molecular weight aggregates, larger intermediates, and fibrils. Freshly dissolved Aβ contains two components, monomer and low molecular weight oligomers in roughly equal amounts. This oligomeric species dissociates on the time scale of minutes. Aged samples were mixtures of monomer, intermediates and fibrils, the proportions of which varied with aging time. The intermediates formed in 10 h were larger (30–50 nm) and dissociated much more slowly than the very low molecular weight oligomers that formed immediately in freshly dissolved Aβ samples. These aggregation intermediates also had a measurably lower degree of solvent exposure than fibrils. The proportion of these intermediates in Aβ samples correlated with the neurotoxicity of the sample, suggesting that these intermediates are one of the most toxic Aβ species. Further residue level characterization of these toxic intermediates may aid in the molecular design of agents that prevent Aβ toxicity associated with Alzheimer’s disease. The HX-MS methods developed here may also be useful for characterizing the behavior of other complex aggregating systems such as designed self-assembling peptides and proteins with intermediate folded states prone to aggregation.
Supplementary Material
This article contains Supplementary Material available at http://www.interscience.wiley.com/jpages/0006-3592/suppmat.
Acknowledgments
This work was supported by a grant from the National Institutes of Health (R01 NS042686) to TAG and EJF.
References
- Antzutkin ON, Leapman RD, Balbach JJ, Tycko R. Supramolecular structural constraints on Alzheimer’s β-Amyloid fibrils from electron microscopy and solid-state nuclear magnetic resonance. Biochemistry. 2002;41(51):15436–15450. doi: 10.1021/bi0204185. [DOI] [PubMed] [Google Scholar]
- Bai Y, Milne JS, Mayne L, Englander WS. Primary structure effects on peptide group hydrogen exchange. Proteins. 1993;17:75–86. doi: 10.1002/prot.340170110. [DOI] [PMC free article] [PubMed] [Google Scholar]
- Bitan G, Kirkitadze MD, Lomakin A, Vollers SS, Benedek GB, Teplow DB. Amyloid beta-protein (Abeta) assembly: Abeta 40 and Abeta 42 oligomerize through distinct pathways. Proc Natl Acad Sci. 2003;100(1):330–335. doi: 10.1073/pnas.222681699. [DOI] [PMC free article] [PubMed] [Google Scholar]
- Bucciantini M, Giannoni E, Chiti F, Baroni F, Formigli L, Zurdo J, Taddei N, Ramponi G, Dobson CM, Stefani M. Inherent toxicity of aggregates implies a common mechanism for protein misfolding diseases. Nature. 2002;416(6880):507–511. doi: 10.1038/416507a. [DOI] [PubMed] [Google Scholar]
- Cannon MJ, Williams AD, Wetzel R, Myszka DG. Kinetic analysis of beta-amyloid fibril elongation. Anal Biochem. 2004;328(1):67–75. doi: 10.1016/j.ab.2004.01.014. [DOI] [PubMed] [Google Scholar]
- Carulla N, Caddy GL, Hall DR, Zurdo J, Gairi M, Feliz M, Giralt E, Robinson CV, Dobson CM. Molecular recycling within amyloid fibrils. Nature. 2005;436(7050):554–558. doi: 10.1038/nature03986. [DOI] [PubMed] [Google Scholar]
- Chen X, Brining S, Nguyen V, Yergey A. Simultaneous assessment of conformation and aggregation of beta-amyloid peptide using electrospray ionization mass spectrometry. FASEB J. 1997;11(10):817–823. doi: 10.1096/fasebj.11.10.9271367. [DOI] [PubMed] [Google Scholar]
- Chimon S, Ishii Y. Capturing intermediate structures of Alzheimer’s beta-amyloid, A beta(1–40), by solid-state NMR spectroscopy. J Am Chem Soc. 2005;127(39):13472–13473. doi: 10.1021/ja054039l. [DOI] [PubMed] [Google Scholar]
- Dahlgren KN, Manelli AM, Stine WB, Baker LK, Krafft GA, LaDu MJ. Oligomeric and fibrillar species of amyloid-beta peptides differentially affect neuronal viability. J Biol Chem. 2002;277(35):32046–32053. doi: 10.1074/jbc.M201750200. [DOI] [PubMed] [Google Scholar]
- Demuro A, Mina E, Kayed R, Milton SC, Parker I, Glabe CG. Calcium dysregulation and membrane disruption as a ubiquitous neurotoxic mechanism of soluble amyloid oligomers. J Biol Chem. 2005;280(17):17294–17300. doi: 10.1074/jbc.M500997200. [DOI] [PubMed] [Google Scholar]
- Deng YZ, Zhang ZQ, Smith DL. Comparison of continuous and pulsed labeling amide hydrogen exchange/mass spectrometry for studies of protein dynamics. J Am Soc Mass Spectrom. 1999;10(8):675–684. doi: 10.1016/S1044-0305(99)00038-0. [DOI] [PubMed] [Google Scholar]
- Dzwolak W, Loksztejn A, Smirnovas V. New insights into the self-assembly of insulin amyloid fibrils: An H-D exchange FT-IR study. Biochemistry. 2006;45(26):8143–8151. doi: 10.1021/bi060341a. [DOI] [PubMed] [Google Scholar]
- Fogle JL, O’Connell JP, Fernandez EJ. Loading, stationary phase, and salt effects during hydrophobic interaction chromatography: [alpha]-Lactalbumin is stabilized at high loadings. J Chromatogr A. 2006;1121(2):209–218. doi: 10.1016/j.chroma.2006.04.015. [DOI] [PubMed] [Google Scholar]
- Gong YS, Chang L, Viola KL, Lacor PN, Lambert MP, Finch CE, Krafft GA, Klein WL. Alzheimer’s disease-affected brain: Presence of oligomeric A beta ligands (ADDLs) suggests a molecular basis for reversible memory loss. Proc Natl Acad Sci USA. 2003;100(18):10417–10422. doi: 10.1073/pnas.1834302100. [DOI] [PMC free article] [PubMed] [Google Scholar]
- Haass C, Selkoe DJ. Soluble protein oligomers in neurodegeneration: Lessons from the Alzheimer’s amyloid beta-peptide. Nat Rev Mol Cell Biol. 2007;8(2):101–112. doi: 10.1038/nrm2101. [DOI] [PubMed] [Google Scholar]
- Hasegawa K, Ono K, Yamada M, Naiki H. Kinetic modeling and determination of reaction constants of Alzheimer’s amyloid fibril extension and dissociation using surface plasmon resonance. Biochemistry. 2002;41(46):13489–13498. doi: 10.1021/bi020369w. [DOI] [PubMed] [Google Scholar]
- Hoshino M, Katou H, Hagihara Y, Hasegawa K, Naiki H, Goto Y. Mapping the core of the beta(2)-microglobulin amyloid fibril by H/D exchange. Nat Struct Biol. 2002;9(5):332–336. doi: 10.1038/nsb792. [DOI] [PubMed] [Google Scholar]
- Hu WP, Chang GL, Chen SJ, Kuo YM. Kinetic analysis of beta-amyloid peptide aggregation induced by metal ions based on surface plasmon resonance biosensing. J Neurosci Methods. 2006;154(1–2):190–197. doi: 10.1016/j.jneumeth.2005.12.016. [DOI] [PubMed] [Google Scholar]
- Jablonowska A, Bakun M, Kupniewska-Kozak A, Dadlez M. Alzheimer’s Disease A[beta] peptide fragment 10–30 forms a spectrum of metastable oligomers with marked preference for N to N and C to C monomer termini proximity. J Mol Biol. 2004;344(4):1037–1049. doi: 10.1016/j.jmb.2004.09.083. [DOI] [PubMed] [Google Scholar]
- Jorgensen TJD, Gardsvoll H, Dano K, Roepstorff P, Ploug M. Dynamics of urokinase receptor interaction with peptide antagonists studied by amide hydrogen exchange and mass spectrometry. Biochemistry. 2004;43(47):15044–15057. doi: 10.1021/bi048706j. [DOI] [PubMed] [Google Scholar]
- Kayed R, Head E, Thompson JL, McIntire TM, Milton SC, Cotman CW, Glabe CG. Common structure of soluble amyloid oligomers implies common mechanism of pathogenesis. Science. 2003;300(5618):486–489. doi: 10.1126/science.1079469. [DOI] [PubMed] [Google Scholar]
- Kayed R, Sokolov Y, Edmonds B, McIntire TM, Milton SC, Hall JE, Glabe CG. Permeabilization of lipid bilayers is a common conformation-dependent activity of soluble amyloid oligomers in protein misfolding diseases. J Biol Chem. 2004;279(45):46363–46366. doi: 10.1074/jbc.C400260200. [DOI] [PubMed] [Google Scholar]
- Kheterpal I, Zhou S, Cook KD, Wetzel R. Abeta amyloid fibrils possess a core structure highly resistant to hydrogen exchange. Proc Natl Acad Sci. 2000;97(25):13597–13601. doi: 10.1073/pnas.250288897. [DOI] [PMC free article] [PubMed] [Google Scholar]
- Kheterpal I, Lashuel HA, Hartley DM, Wlaz T, Lansbury PT, Wetzel R. A beta protofibrils possess a stable core structure resistant to hydrogen exchange. Biochemistry. 2003a;42(48):14092–14098. doi: 10.1021/bi0357816. [DOI] [PubMed] [Google Scholar]
- Kheterpal I, Wetzel R, Cook KD. Enhanced correction methods for hydrogen exchange-mass spectrometric studies of amyloid fibrils. Protein Sci. 2003b;12(3):635–643. doi: 10.1110/ps.0225703. [DOI] [PMC free article] [PubMed] [Google Scholar]
- Kheterpal I, Chen M, Cook KD, Wetzel R. Structural differences in A beta amyloid protofibrils and fibrils mapped by hydrogen exchange—Mass spectrometry with on-line proteolytic fragmentation. J Mol Biol. 2006;361(4):785–795. doi: 10.1016/j.jmb.2006.06.066. [DOI] [PubMed] [Google Scholar]
- Kirkitadze MD, Bitan G, Teplow DB. Paradigm shifts in Alzheimer’s disease and other neuro degenerative disorders: The emerging role of oligomeric assemblies. J Neurosci Res. 2002;69(5):567–577. doi: 10.1002/jnr.10328. [DOI] [PubMed] [Google Scholar]
- Klunk WE, Jacob RF, Mason RP. Quantifying amyloid β-peptide (Aβ) aggregation using the Congo Red-Aβ (CR-Aβ) spectrophoto-metric assay. Anal Biochem. 1999;266:66–76. doi: 10.1006/abio.1998.2933. [DOI] [PubMed] [Google Scholar]
- Kraus M, Bienert M, Krause E. Hydrogen exchange studies on Alzheimer’s amyloid-beta peptides by mass spectrometry using matrix-assisted laser desorption/ionization and electrospray ionization. Rapid Commun Mass Spectrom. 2003;17(3):222–228. doi: 10.1002/rcm.901. [DOI] [PubMed] [Google Scholar]
- Kremer JJ, Pallitto MM, Sklansky DJ, Murphy RM. Correlation of beta-amyloid aggregate size and hydrophobicity with decreased bilayer fluidity of model membranes. Biochemistry. 2000;39:10309–10318. doi: 10.1021/bi0001980. [DOI] [PubMed] [Google Scholar]
- Lambert MP, Barlow AK, Chromy BA, Edwards C, Freed R, Liosatos M, Morgan TE, Rozovsky I, Trommer B, Viola KL, et al. Diffusible, nonfibrillar ligands derived from Abeta 1–42 are potent central nervous system neurotoxins. Proc Natl Acad Sci. 1998;95(11):6448–6453. doi: 10.1073/pnas.95.11.6448. [DOI] [PMC free article] [PubMed] [Google Scholar]
- Lee S, Fernandez EJ, Good TA. Role of aggregation conditions in structure, stability, and toxicity of intermediates in the A beta fibril formation pathway. Protein Sci. 2007;16(4):723–732. doi: 10.1110/ps.062514807. [DOI] [PMC free article] [PubMed] [Google Scholar]
- Lesne S, Koh MT, Kotilinek L, Kayed R, Glabe CG, Yang A, Gallagher M, Ashe KH. A specific amyloid-beta protein assembly in the brain impairs memory. Nature. 2006;440(7082):352–357. doi: 10.1038/nature04533. [DOI] [PubMed] [Google Scholar]
- Murphy RM. Kinetics of amyloid formation and membrane interaction with amyloidogenic proteins. Biochim Biophys Acta. 2007;1768:1923–1934. doi: 10.1016/j.bbamem.2006.12.014. [DOI] [PubMed] [Google Scholar]
- Necula M, Kayed R, Milton S, Glabe CG. Small molecule inhibitors of aggregation indicate that amyloid beta oligomerization and fibrillization pathways are independent and distinct. J Biol Chem. 2007;282(14):10311–10324. doi: 10.1074/jbc.M608207200. [DOI] [PubMed] [Google Scholar]
- Nettleton EJ, Tito P, Sunde M BouchardM, Dobson CM, Robinson CV. Characterization of the oligomeric states of insulin in self-assembly and amyloid fibril formation by mass spectrometry. Biophys J. 2000;79(2):1053–1065. doi: 10.1016/S0006-3495(00)76359-4. [DOI] [PMC free article] [PubMed] [Google Scholar]
- Olofsson A, Sauer-Eriksson AE, Ohman A. The solvent protection of Alzheimer Amyloid-{beta}-(1–42) fibrils as determined by solution NMR spectroscopy. J Biol Chem. 2006;281(1):477–483. doi: 10.1074/jbc.M508962200. [DOI] [PubMed] [Google Scholar]
- Pallitto MM, Murphy RM. A Mathematical model of the kinetics of {beta}-Amyloid fibril growth from the denatured state. Biophys J. 2001;81(3):1805–1822. doi: 10.1016/S0006-3495(01)75831-6. [DOI] [PMC free article] [PubMed] [Google Scholar]
- Patel D, Good T. A rapid method to measure beta-amyloid induced neurotoxicity in vitro. J Neurosci Methods. 2007;161(1):1–10. doi: 10.1016/j.jneumeth.2006.10.004. [DOI] [PubMed] [Google Scholar]
- Paterson Y, Englander SW, Roder H. An antibody-binding site on cytochrome-C defined by hydrogen-exchange and 2-dimensional Nmr. Science. 1990;249(4970):755–759. doi: 10.1126/science.1697101. [DOI] [PMC free article] [PubMed] [Google Scholar]
- Petkova AT, Buntkowsky G, Dyda F, Leapman RD, Yau W-M, Tycko R. Solid state NMR reveals a pH-dependent Antiparallel [beta]-Sheet Registry in fibrils formed by a [beta]-Amyloid Peptide. J Mol Biol. 2004;335(1):247–260. doi: 10.1016/j.jmb.2003.10.044. [DOI] [PubMed] [Google Scholar]
- Qian H, Chan SI. Hydrogen exchange kinetics of proteins in denaturants: A generalized two-process model. J Mol Biol. 1999;286(2):607–616. doi: 10.1006/jmbi.1998.2484. [DOI] [PubMed] [Google Scholar]
- Soto C. Plaque busters: Strategies to inhibit amyloid formation in Alzheimer’s disease. Mol Med Today. 1999;5(8):343–350. doi: 10.1016/s1357-4310(99)01508-7. [DOI] [PubMed] [Google Scholar]
- Stine WB, Jr, Dahlgren KN, Krafft GA, LaDu MJ. In vitro characterization of conditions for amyloid-beta peptide oligomerization and fibrillogenesis. J Biol Chem. 2003;278(13):11612–11622. doi: 10.1074/jbc.M210207200. [DOI] [PubMed] [Google Scholar]
- Tobler SA, Fernandez EJ. Structural features of interferon-gamma aggregation revealed by hydrogen exchange. Protein Sci. 2002;11(6):1340–1352. doi: 10.1110/ps.3770102. [DOI] [PMC free article] [PubMed] [Google Scholar]
- Turner PR, O’Connor K, Tate WP, Abraham WC. Roles of amyloid precursor protein and its fragments in regulating neural activity, plasticity and memory. Progr Neurobiol. 2003;70(1):1–32. doi: 10.1016/s0301-0082(03)00089-3. [DOI] [PubMed] [Google Scholar]
- Walsh DM, Hartley DM, Kusumoto Y, Fezoui Y, Condron MM, Lomakin A, Benedek GB, Selkoe DJ, Teplow DB. Amyloid β-protein fibrillogenesis. J Biol Chem. 1999;274:25945–25952. doi: 10.1074/jbc.274.36.25945. [DOI] [PubMed] [Google Scholar]
- Walsh DM, Klyubin I, Fadeeva JV, Cullen WK, Anwyl R, Wolfe MS, Rowan MJ, Selkoe DJ. Naturally secreted oligomers of amyloid [beta] protein potently inhibit hippocampal long-term potentiation in vivo. Nature. 2002;416(6880):535–539. doi: 10.1038/416535a. [DOI] [PubMed] [Google Scholar]
- Wang SSS, Tobler SA, Good TA, Fernandez EJ. Hydrogen exchange-mass spectrometry analysis of beta-Amyloid peptide structure. Biochemistry. 2003;42(31):9507–9514. doi: 10.1021/bi0342766. [DOI] [PubMed] [Google Scholar]
- Whittemore NA, Mishra R, Kheterpal I, Williams AD, Wetzel R, Serpersu EH. Hydrogen-deuterium (H/D) exchange mapping of A ss(1–40) amyloid fibril secondary structure using nuclear magnetic resonance spectroscopy. Biochemistry. 2005;44(11):4434–4441. doi: 10.1021/bi048292u. [DOI] [PubMed] [Google Scholar]
- Williams AD, Portelius E, Kheterpal I, Guo J-t, Cook KD, Xu Y, Wetzel R. Mapping A[beta] amyloid fibril secondary structure using scanning proline mutagenesis. J Mol Biol. 2004;335(3):833–842. doi: 10.1016/j.jmb.2003.11.008. [DOI] [PubMed] [Google Scholar]
- Williams AD, Sega M, Chen ML, Kheterpal I, Geva M, Berthelier V, Kaleta DT, Cook KD, Wetzel R. Structural properties of A beta protofibrils stabilized by a small molecule. Proc Natl Acad Sci USA. 2005;102(20):7115–7120. doi: 10.1073/pnas.0408582102. [DOI] [PMC free article] [PubMed] [Google Scholar]
- Yamaguchi KI, Katou H, Hoshino M, Hasegawa K, Naiki H, Goto Y. Core and heterogeneity of beta(2)-microglobulin amyloid fibrils as revealed by H/D exchange. J Mol Biol. 2004;338(3):559–571. doi: 10.1016/j.jmb.2004.02.067. [DOI] [PubMed] [Google Scholar]
Associated Data
This section collects any data citations, data availability statements, or supplementary materials included in this article.
Supplementary Materials
This article contains Supplementary Material available at http://www.interscience.wiley.com/jpages/0006-3592/suppmat.


