

Abstract
Human mesenchymal stem cells (hMSC) are critical for tissue regeneration. How hMSC respond to genotoxic stresses and potentially contribute to aging and cancer remain underexplored. We demonstrated that ionizing radiation induced cellular senescence of hMSC over a period of 10 days, showing a critical transition between day 3 and day 6. This was confirmed by senescence-associated beta-galactosidase (SA-β-gal) staining, protein expression profiles of key cell cycle regulators (retinoblastoma (Rb) protein, p53, p21waf1/Cip1, and p16INK4A), and senescence-associated secretory phenotypes (SASPs) (IL-8, IL-12, GRO, and MDC). We observed dramatic cytoskeletal reorganization of hMSC through reduction of myosin-10, redistribution of myosin-9, and secretion of profilin-1. Using a SILAC-based phosphoproteomics method, we detected significant reduction of myosin-9 phosphorylation at Ser1943, coinciding with its redistribution. Importantly, through treatment with cell permeable inhibitors ((4,5,6,7-tetrabromo-1H-benzotriazole (TBB) and 2-dimethylamino-4,5,6,7-tetrabromo-1H-benzimidazole (DMAT)), and gene knockdown using RNA interference, we identified CK2, a kinase responsible for myosin-9 phosphorylation at Ser1943, as a key factor contributing to the radiation-induced senescence of hMSC. We showed that individual knockdown of CK2 catalytic subunits CK2α and CK2α′ induced hMSC senescence. However, only knockdown of CK2α resulted in morphological phenotypes resembling those of radiation-induced senescence. These results suggest that CK2α and CK2α′ play differential roles in hMSC senescence progression, and their relative expression might represent a novel regulatory mechanism for CK2 activity.
Keywords: mesenchymal stem cells, ionizing radiation, senescence, cytoskeletal reorganization, CK2
Introduction
Stem cells hold great potential for regenerative medicine but have also been implicated in cancer and aging (1). Mesenchymal stem cells (MSCs) are critical for maintenance and repair of various tissues including bone and cartilage (2). However, MSCs have been shown as a target for neoplastic transformation (3, 4). MSCs can also modulate tumor microenvironments. For example, hMSC within tumor stroma have been shown to secrete the chemokine CCL5 to promote breast cancer metastasis (5). Systems biology approaches are increasingly utilized to understand stem cells. Our proteomic and transcriptomic studies of hMSC have provided important insights into their proliferation and differentiation (6, 7). Advances in quantitative phosphoproteomics (8, 9) have opened up new possibilities for comprehensively elucidating protein phosphorylation and dephosphorylation, a predominant mechanism of signal transduction in mammalian cells.
Cellular senescence, a state of permanent cell cycle arrest, is linked to organism aging and tumorigenesis (10). Replicative (or proliferative) senescence results from telomere shortening, while oncogenic stress-induced senescence results from DNA or chromatin damages (10). One of the major phenotypic changes during senescence is cell enlargement and cytoskeleton flattening. More recently, cytokine/chemokine secretion has been shown to be another key phenotype associated with senescence (11-14). A large body of evidence suggests that senescence is triggered by the retinoblastoma protein (hereafter Rb) or p53 pathways, which activate the cyclin-dependent kinase (CDK) inhibitors p16INK4A (hereafter p16) and p21waf1/Cip1 (hereafter p21), respectively (15-17). However, the fundamental mechanism underlying senescence initiation, progression, and maintenance remains to be elucidated. Expression of p16 has been associated with replicative senescence of hMSC (18). During hMSC senescence, the nuclear lamina promotes telomere aggregation and centromere peripheral localization (19). We have shown that ionizing radiation (IR) inhibited the cell cycle progression of hMSC in a p53-dependent manner without impairing their in vitro osteogenic differentiation process (7). However, the long-term fate of these IR-treated hMSC has not been defined.
Protein kinase CK2 (previously termed “casein kinase 2”) is a ubiquitous and constitutively active Ser/Thr protein kinase. CK2 is a heterotetramer composed of two catalytic subunits (α and α′) and two regulatory subunits (β), with a general structure of α2β2, α′2β2, or αα′β2. Critical importance of CK2 is confirmed by genetic studies in mice showing that knockout of CK2α or CK2β results in embryonic lethality (20, 21), while knockout of CK2α′ results in defects in spermatogenesis (22). CK2 has a large number (>300) of substrates, and is involved in a myriad of cellular processes (23, 24). CK2 is upregulated in all cancers (25) and considered a potential target for cancer treatment (26). Despite intensive research, how CK2 regulates its activity and substrates remain elusive. Furthermore, the role of CK2 in hMSC, particularly related to proliferation and cellular senescence, has not been reported.
Herein, we describe the first comprehensive phenotypic and mechanistic study of X-ray-induced senescence of hMSC. We demonstrated that IR-induced senescence of hMSC was a highly complex and coordinated process, and CK2, particularly CK2α played a critical role in regulating the cytoskeletal reorganization during the senescence progression.
Materials and Methods
Cell Culture and SILAC
Human MSC were obtained from Lonza Group (Walkersville, MD). The log numbers included 4F0591 (derived from a 32-year old male), 4F1560 (derived from a 23-year old female), and 6F3502 (derived from a 21-year old male). Expanded hMSC were characterized as described (6). To minimize the effects of replicative senescence, hMSC at early passages (typical number: 5) were utilized. All comparisons between irradiated and non-irradiated hMSC were done using hMSC at the same passage and population doubling for particular time points.
Isotopic labeling of hMSC were performed using SILAC kits from Invitrogen (Carlsbad, CA). Media supplemented with L-Lysine HCl (Lys) and L-Arginine (Arg) were used for non-labeled control cells, while media supplemented with both [U-13C6]-L-Lysine HCl (*Lys) and [U-13C6, 15N4]-L-Arginine (*Arg) were used for double-labeled cells. Cell morphology, proliferation, and differentiation were monitored to ensure no adverse effects from the SILAC labeling alone. Efficiency of isotope incorporation was confirmed by mass spectrometry analysis of cellular proteins.
Gene Knockdown Using Small Interfering RNAs
Small interfering RNAs (siRNAs) with 3′-dTdT overhangs for CK2 and AllStars negative control were obtained from Qiagen (Valencia, CA). The specific sequences were: 5′-GAUGACUACCAGCUGGUUCdTdT-3′ (CK2a1 siRNA sense strand, targeting CK2α); 5′-CAGUCUGAGGAGCCGCGAGdTdT-3′ (CK2a2 siRNA sense strand, targeting CK2α′); and 5′-UCAAGAUGACUACCAGCUGdTdT-3′ (CK2a10 siRNA sense strand, targeting CK2α with 100% homology and CK2α′ with 90% homology). All siRNAs were annealed with complementary antisense strands with 3′-dTdT overhangs. Transfection was done with 10-20 nM siRNAs using HiPerFect reagents (Qiagen). To confirm the knockdown efficiency, cells were seeded with a 1×10⁵ cells/well density on 6-well plates, transfected the next day, and lysed 3 days or 6 days after transfection. Protein lysates were analyzed by Western blotting. For senescence assays, cells were seeded with a 2×10⁴ cells/well density on 12-well plates and transfected with desired siRNAs.
X-rays Irradiation and Inhibitors Treatment
X-ray irradiation was performed with 320 kVp X-rays (Pantak Inc., Branford, CT) (7). For SILAC experiments, double-labeled (*Lys, *Arg) and non-labeled (Lys, Arg) hMSC were irradiated with 4 Gy and 0 Gy X-rays, respectively. To study the short-term effects of CK2 inhibitors, cells were pre-treated with dimethyl sulfoxide [DMSO] (Sigma, St. Louis, MO) alone; 4,5,6,7-tetrabromo-1H-benzotriazole [TBB] (75 μM in DMSO); or 2-dimethylamino-4,5,6,7-tetrabromo-1H-benzimidazole [DMAT] (20 μM in DMSO) (Calbiochem, San Diego, CA); 3 hours prior to irradiation. Cells were supplemented with fresh media without inhibitors 3 hours after IR. To study the long-term effects of CK2 inhibitors, cells were incubated with media containing inhibitors for 3 days or 6 days.
TUNEL Assay, SA-beta-Galactosidase Staining, and Immunocytochemistry
For TUNEL staining, hMSC were seeded at 5,000 cells per well on 8-well chamber slides (ThermoFisher Scientific, Rochester, NY). Cells were irradiated the next day, incubated for 24 hrs, and labeled with TUNEL reaction mixtures (Roche Diagnostics, Indianapolis, IN). DNase I-treated hMSC were used as the positive control. Fluorescence images were collected by an Olympus BX60 microscope (Olympus, Center Valley, PA).
For senescence-associated β-gal staining, hMSC were seeded in triplicates on 12-well plates with the following cell density: 0 and 0.1 Gy, 0.1×10⁴/well; 1 Gy, 0.2×10⁴/well; and 4 Gy, 2×10⁴/well. Cells were irradiated the next day (Day 0), fixed with 4% paraformaldehyde at 30 mins, 3 hrs, 24 hrs, 3 days, 6 days, and 10 days after radiation, and stained with the SA-β-gal staining solution (Biovision, Mountain View, CA). Phase-contrast images were collected using a Nikon TMS microscope and a Hamamatsu Orca100 cooled digital CCD camera, using C-Imaging System software (Compix Inc., Irvine, CA). The numbers of blue-stained (SA-β-gal positive) cells and total cells were manually counted under the microscope and averaged for three regions within a sample well. Percentage of SA-β-gal positive cells was calculated accordingly. Standard deviation was calculated for triplicate experiments. Statistical analysis was performed using student's t-test to confirm specific differences between treatments (p<0.05, n=3).
For immunocytochemistry, cells grown on 8-well chamber slides were incubated with the mouse anti-actin antibody (Chemicon, Temecula, CA), followed by Alexa Fluor®488 goat anti-mouse IgG (Invitrogen). To stain actin filament, cells were incubated with rhodamine-phalloidin (Invitrogen) (6). Cells were counterstained with 4′, 6-diamidino-2-phenylindole (DAPI) nuclear staining. Fluorescence images were collected using an Olympus BX60 microscope (40× or 100×).
Preparation of Triton Soluble/Insoluble Fractions, Processing of Culture Media, and Immunoblotting Analysis
Cells were lysed with a buffer containing 0.5% Triton X-100, 50 mM Tris.HCl (pH7.5), 150 mM NaCl, phosphatase inhibitors cocktail I & II (Sigma, St. Louis, MO), and protease inhibitor cocktails (Roche Diagnostics, Indianapolis, IN) at 4°C. Lysates were centrifuged at 12,000 g for 10 min at 4°C. Supernatants were collected as the Triton soluble fraction. Pellets were washed, dissolved in 1×SDS sample buffer, and collected as the Triton insoluble fraction. Soluble fractions were quantified using a BCA assay kit (Novagen, Gibbstown, NJ).
To measure secreted proteins, media were collected at different time points after IR. Media were centrifuged at 2,000 g for 5 min to remove any cell pellets. Supernatants were fractioned into >50 kDa and 3-50 kDa components by centrifuging sequentially with Centriprep YM-50 and YM-3 (Millipore, Billerica, MA). Retentates were concentrated by Speedvac, quantified using BCA assay, resolved by SDS-PAGE, and subjected to silver staining-mass spectrometry or Western blotting analysis.
Immunoblotting analysis was performed as described (7, 27). Antibodies included mouse anti-actin and anti-GAPDH (Chemicon); rabbit anti-p53 and anti-profilin-1, and mouse anti-p21 (Cell Signaling, Danvers, MA); rabbit anti-MHC-A (i.e. myosin-9) and anti-MHC-B (i.e. myosin-10) (Covance, Berkeley, CA); rabbit anti-CK2α and anti-CK2α′ (Bethyl Laboratories, Montgomery, TX); rabbit anti-p16 (Santa Cruz Biotechnologies, Santa Cruz, CA); and mouse anti-human Rb (BD Biosciences, San Jose, CA).
2D-DIGE, Cytokine Chip Profiling, and Phosphoproteomic Profiling
2D-DIGE was performed as described (28). Cell lysates were labeled using CyDye (GE Healthcare, Piscataway, NJ) with Cy3, Cy2, and Cy5 for 0 Gy, 0.1 Gy, and 4 Gy, respectively.
To detect cytokine secretion, cell media (∼ 2 ml) were collected on day 1 and 3 and incubated on RayBio® Human Cytokine Antibody Array III (RayBiotech Inc., Norcross, GA). Arrays were developed by chemiluminescence and images were scanned with a Umax 2100 scanner. For quantitation, the average intensity of duplicate spots for each cytokine was normalized with that of positive controls on the same chip.
To profile the phosphoproteome, hMSC were lysed with Buffer B from the Invitrogen SILAC kit and digested with trypsin (1:50) at 37°C overnight. Phosphopeptides were enriched from around 150 μg of total lysates, using the PHOS-TRAP Phosphopeptide enrichment kit (Perkin Elmer, Shelton, CT). Procedures for in-gel trypsin digestion, LC/MS/MS, and data processing were performed as described (6, 27).
Results
Ionizing Radiation Induced Senescence of hMSC
We recently showed that IR induced cell cycle arrest of hMSC within 24 hrs after X-ray or 56Fe ion radiation, and the effects depended on radiation quality and dose (7). We investigated the long-term effects of X-rays in this study. As shown in Figure 1A, 4B and Supplementary Figure 1, IR induced hMSC senescence in a dose-dependent manner. At 4 Gy, majority of the cells became enlarged and flattened, and stained positive (blue, shown in grayscale) with SA-β-gal 10 days after irradiation. On average, 85% of cells became positive for 4 Gy as compared to 20% for 0 Gy (Figure 1B). The critical transition occurred between day 3 and 6. The background for 0 Gy was probably due to proliferative senescence (18). On the other hand, TUNEL staining failed to detect any radiation-induced apoptotic cells 24 hrs after IR, even for doses as high as 45 Gy (Supplementary Figure 2). Similar results were obtained for all three primary hMSC lines tested. Therefore, subsequent experiments were done with hMSC from log No. 6F-3502.
Figure 1.
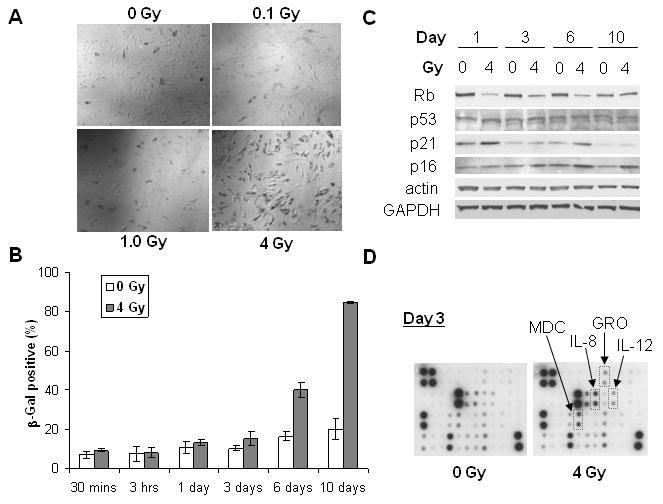
Senescence phenotypes of hMSC exposed to X-rays. (A) Representative images of SA-β-gal staining on day 10. Cells were irradiated with X-rays or kept as sham control (0 Gy). (B) Quantitation of SA-β-gal positive cells at different time points after IR. (C) Western blotting analysis of hMSC at different days after IR. Actin and GAPDH were used as the loading control. (D) Cytokine chip profiling of culture media for hMSC 3 days after IR. Secretion of MDC, GRO, IL-8, and IL-12 after 4 Gy is highlighted.
Figure 4.
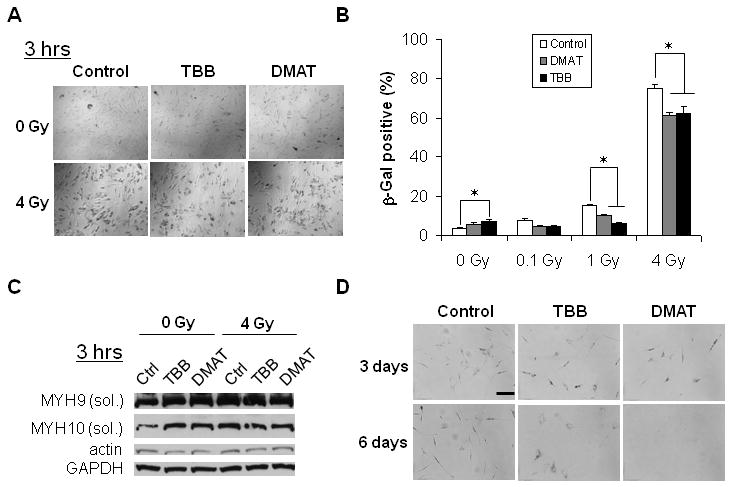
Effects of CK2 inhibition on IR-induced hMSC senescence. (A) Representative images of SA-β-gal staining 10 days after IR. (B) Quantitation of SA-β-gal positive cells on day 10 after short-term (3 hrs) inhibition of CK2 followed by exposure to different doses of IR (*p < 0.05). (C) Western blotting analysis of soluble myosin-9 (MYH9) and myosin-10 (MYH10) for hMSC pretreated with DMAT, TBB, or DMSO control for 3 hrs, and lysed 3 hrs after exposure to IR. Actin and GAPDH were used as the loading control. (D) Representative images of SA-β-gal staining of hMSC treated with DMAT, TBB, or DMSO control for 3 days and 6 days. Scale bar: 200 μm.
To further confirm IR-induced hMSC senescence, we analyzed expression profiles of Rb, p53, p21, and p16. We carried out pair-wise comparisons to minimize the time-dependent contributions from cell proliferation and background senescence. As shown in Figure 1C, both p53 and p21 were upregulated within 24 hours after IR, consistent with the cell cycle arrest (7). In addition, p21 showed biphasic activation and increased significantly on day 6 after IR. In contrast, Rb was significantly downregulated starting from day 1 and until day 6 after IR. Correspondingly, p16 gradually increased from day 1 to day 10 after IR, with the biggest changes on day 6 and day 10. These results suggested that p53-p21 pathway played a key role in IR-induced cell cycle arrest as we have shown previously (7), while the Rb-p16 pathway might play a more important role in IR-induced senescence of hMSC. The time-course of these markers' expression coincided with the critical transition between day 3 and 6 (Figure 1B).
Recent works have demonstrated that senescence is associated with SASPs (11-14). As shown in Figure 1D, hMSC secreted multiple cytokines/chemokines such as GRO, IL-8, IL-12, MDC (CCL22), VEGF, RANTES (CCL5), IL-7, MCP-1, and IL-6 under basal conditions, each of which shown as duplicate spots registered on the cytokine chip. IR induced significant upregulation of GRO, IL-8, IL-12, and MDC on day 3 but not for day 1 (data not shown). We noticed that all these cytokines/chemokines are NF-kB responsive genes. These data confirmed SASPs of hMSC senescence and suggested the possibility of NF-kB activation leading to secretion of NF-kB responsive chemokines.
Cytoskeleton Reorganized during Senescence Progression of hMSC
We used 3-color 2D-DIGE to profile expressions of soluble cytoplasmic proteins. As shown in Supplementary Figure 3, no significant changes occurred in abundant cytoplasmic proteins 24 hrs after radiation. However, we observed significant cytoskeletal reorganization (Figure 2A). Cells became increasingly enlarged and flattened from day 0 to day 10 after IR. Phalloidin staining demonstrated that actin filament became more spread out as soon as day 1. Furthermore, bulky senescent cells (day 6-10) showed some clear punctates in the cytoskeleton, suggesting its fluidity and deformation.
Figure 2.
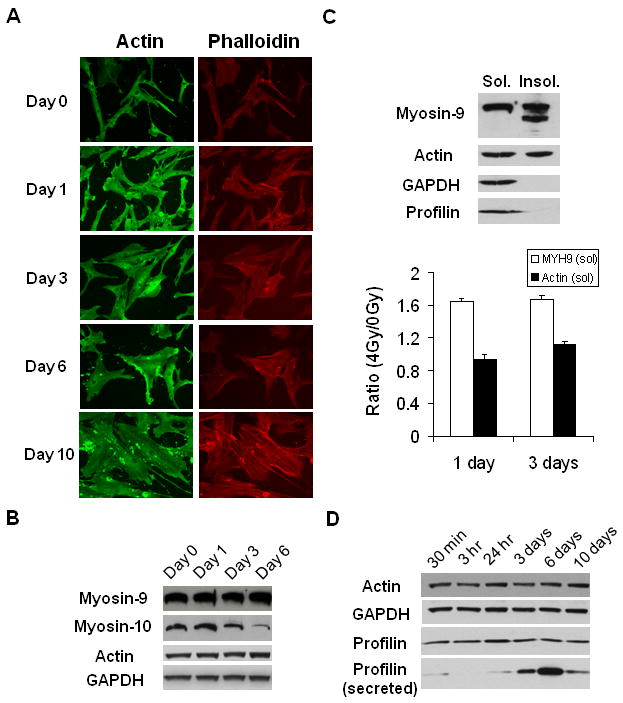
Cytoskeletal reorganization of hMSC exposed to X-rays. (A) Immunostaining of actin and actin filament (phalloidin staining) on different days after exposure to 4 Gy X-rays. (B) Western blotting analysis of myosins and actin in total cell lysates at different time points after IR. (C) Western blotting analysis and its quantitation of Triton X-100 soluble and insoluble fractions. The relative abundance of soluble myosin-9 and actin on day 1 and 3 after IR were quantified. GAPDH was used as the loading control. (D) Western blotting analysis of total cell lysates and culture media (for secreted profilin).
To further elucidate the cytoskeletal changes, we analyzed the expression of its key components during the senescence progression. As shown in Figure 2B, myosin-10, but not myosin-9 or actin, showed significant decrease from day 1-6. Since myosin-9 is much more abundant than myosin-10 in hMSC (mass spectrometry analysis, data not shown), we further analyzed the distribution of myosin-9. Actin and myosin-9 were observed in both Triton X-100 soluble and insoluble fractions (Figure 2C). In contrast, profilin-1, another important component of the cytoskeleton, showed up only in the soluble fractions. Interestingly, there were at least two major bands of myosin-9 in the insoluble fraction, with the lower molecular weight band presumably being a truncated form. The relative abundance of soluble myosin-9 and actin were normalized with GAPDH. Soluble myosin-9 significantly increased (∼1.6 fold) on both day 1 and 3 after IR. But the change of soluble actin (∼0.9-1.1 fold) was insignificant.
Reorganization and fluidity of the cytoskeleton was further demonstrated by secretion of profilin-1. Using mass spectrometry, we identified human profilin-1 as one of the proteins secreted to the culture media. Tandem MS spectrum (data not shown) identified the peptide TFVNITPAEVGVLVGK (aa39-54) from human profilin-1, which is distinct from the corresponding bovine peptide (having amino acid I instead of V at aa50). Western blotting confirmed that major secretion of profin-1 occurred between day 3-6 after IR (Figure 2D), consistent with the kinetics of the senescence progression (Figure 1).
Phosphoproteomics Identified Changes in Myosin-9 Phosphorylation during Senescence Progression of hMSC
HMSC proliferated normally in SILAC media without detectable morphological changes. To confirm the efficiency of SILAC labeling for primary hMSC, we analyzed actin bands from SILAC-labeled cell lysates separated on SDS-PAGE gels. Supplementary Figure 4 demonstrated full incorporation of targeted isotopic labels for protein quantitation.
We compared phosphoproteomic profiles of hMSC 1 or 3 days after exposure to 0 and 4 Gy X-rays, respectively. One of the most abundant phosphopeptides showing significant changes belonged to myosin-9. Tandem MS spectrum in Figure 3A and Mascot search confirmed pSer1943 from its peptide aa1937-aa1960. Figure 3B shows a representative MS spectrum of the triply charged aa1937-aa1960 with 1:1 mix of light (0 Gy) and heavy (4 Gy) labels. To quantify total myosin-9, its protein bands on SDS-PAGE gels for the 1:1 mix were cut out and quantified by mass spectrometry. Figure 3C shows the ratio between pSer1943 and total myosin-9, with the value for 0 Gy on day 1 normalized to 1.0. It is clear that relative pSer1943 amount was reduced significantly during cell proliferation (day 1 vs. day 3), and reduced more dramatically during the senescence progression from day 1 to day 3 (0 Gy vs. 4 Gy). We observed concurrent higher solubility of myosin-9 in the cytoskeleton of hMSC (Figure 2B). This raised the possibility that decrease of pSer1943 for myosin-9 increased its solubility in the cytoskeleton during hMSC senescence progression.
Figure 3.
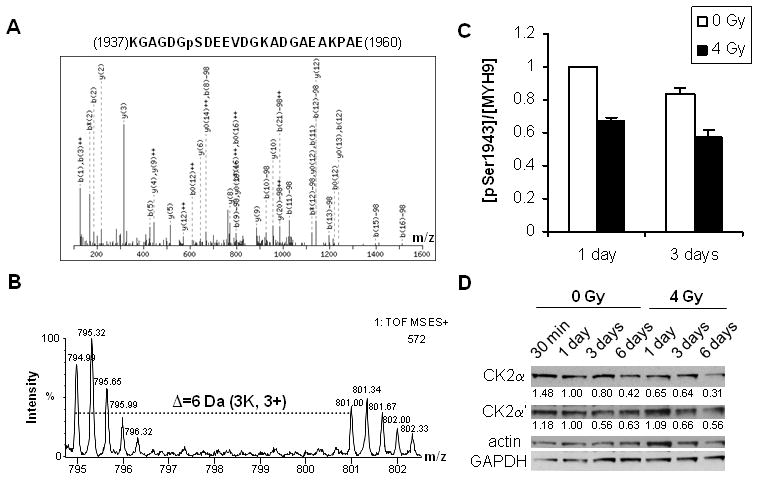
Quantitation of pSer1943 of myosin-9 and CK2 for hMSC exposed to X-rays. (A) MS/MS spectrum of peptide aa1937-aa1960 containing pSer1943. (B) A representative MS spectrum of peptide aa1937-aa1960 with 1:1 mix of light (0 Gy) and heavy (4 Gy) cell lysates. (C) The relative abundance of pSer1943 normalized with total myosin-9 on day 1 and 3. (D) Western blotting analysis of CK2 catalytic subunits CK2α and CK2α′ at different time points after IR. Actin and GAPDH were used as the loading control. Relative ratios were calculated with the value for 0 Gy at day 1 normalized to 1.0.
Since CK2 contributes to cell proliferation (23, 24) and has been convincingly shown to be the in vivo kinase for pSer1943 of myosin-9 (29-32), we measured the expression of CK2 catalytic subunits CK2α and CK2α′. As shown in Figure 3D, relative expression of both CK2α and CK2α′ decreased at later stages of hMSC proliferation (day 3 to day 6) regardless of radiation. But 4 Gy induced more significant reduction of CK2α than 0 Gy control (day 1 to day 6). Furthermore, the relative changes of CK2α on day 1 and day 3 matched those of pSer1943 shown in Figure 3C. On the other hand, the changes of CK2α′ was not significant between 0 Gy and 4 Gy, nor matched those of pSer1943. These results suggested that CK2α was involved in myosin-9 phosphorylation-associated cytoskeletal reorganization during hMSC senescence progression.
Inhibition of CK2 Increased Basal Senescence but Reduced IR-induced Senescence of hMSC
We chose to inhibit CK2 with two specific inhibitors DMAT and TBB. Figure 4A shows representative images of SA-β-gal staining (blue, shown in grayscale) for hMSC 10 days after IR. Figure 4B demonstrates that in the absence of IR, short-term (a total of 6 hrs) inhibition of CK2 slightly increased hMSC replicative senescence (control: 3.9%, TBB: 7.5%, p<0.05, student's t-test). On the other hand, short-term inhibition of CK2 substantially decreased IR-induced senescence. The percentage of senescent cells was decreased from 15% to ∼7% (p<0.05, student's t-test) and from 72% to ∼60% (p<0.05, student's t-test), for 1 Gy and 4 Gy, respectively.
We next determined the short-term effect of CK2 inhibition on cytoskeletal proteins. As shown in Figure 4C, both IR and CK2 inhibition significantly increased the Triton X-100 soluble fractions of myosin-9 and myosin-10. However, pretreatment with DMAT and TBB reduced the IR-induced increases. On the other hand, change in actin was not significant. These results are consistent with the view that decrease of pSer1943 due to CK2 reduction increases myosin-9 solubility during hMSC senescence (Figure 2 and 3).
We then investigated the effects of long-term inhibition of CK2. As shown in Figure 4D, 3-day treatment with DMAT and TBB increased the senescence population but significantly decreased the overall cell numbers. Treatment with DMAT for 6 days resulted in complete cell death, while with TBB resulted in some bulky cell similar to those of senescent cells (Figure 1A). The differential effects between DMAT and TBB were consistent with a recent study showing that TBB is a more specific CK2 inhibitor while DMAT induces significant off-target effects (33).
Knockdown of CK2 Catalytic Subunits Induced Senescence Phenotypes of hMSC
We first confirmed the knockdown efficiency using Western blotting. As shown in Figure 5A, CK2a1 siRNA reduced CK2α expression by 55% on day 3 and 65% on day 6, compared to respective controls (normalized to GAPDH as the loading control); CK2a2 siRNA reduced CK2α′ expression by 68% on day 3 and 91% on day 6, respectively. Interestingly, knockdown of CK2α increased CK2α′ expression by 26% (day 3) and 28% (day 6) relative to the control, but not vice versa. Knockdown of either CK2α or CK2α′ using CK2a10 siRNA was less efficient. It reduced CK2α expression by 11% and 41% on day 3 and day 6, respectively.
Figure 5.
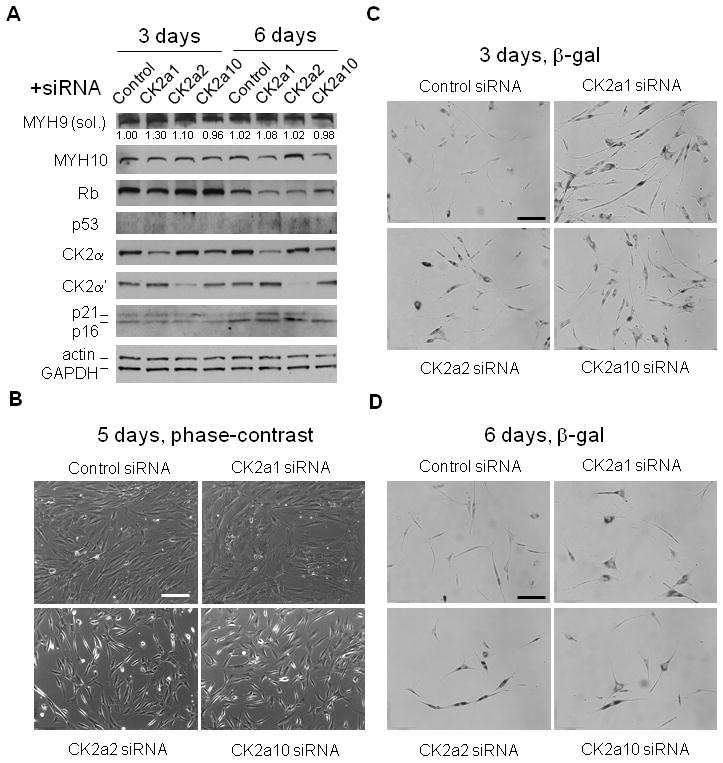
Effects of CK2 knockdown on hMSC senescence. (A) Western blotting analysis of hMSC 3 days and 6 days after transfection with respective siRNAs. Actin and GAPDH were used as the loading control. (B) Representative phase-contrast images of hMSC 5 days after siRNAs transfection. (C) Representative images of SA-β-gal staining of hMSC 3 days after siRNAs transfection. (D) Representative images SA-β-gal staining of hMSC 6 days after siRNAs transfection. Scale bars: 200 μm.
We next determined the expression of Rb, p53, p21, p16, and myosin after CK2 knockdown. Overall, Rb level was reduced from day 3 to day 6, consistent with its reduction after cell expansion. Relative to the control, knockdown of CK2α significantly decreased Rb on day 3, while knockdown of CK2α and CK2α′ individually both resulted in significant Rb reduction on day 6. Furthermore, both p16 and p21 significantly increased on day 6 after CK2α or CK2α knockdown, with increase of p21 on day 6 more significant for CK2α knockdown. On the other hand, soluble myosin-9 increased on day 3 while myosin-10 decreased substantially on day 6, for CK2α knockdown. These expression patterns, particularly those resulted from the CK2α knockdown, resembled those of IR-induced senescence (Figure 1C and 2).
We then examined whether knockdown of CK2α or CK2α′ led to hMSC senescence. Strikingly, knockdown of CK2α and CK2α′ induced dramatic changes in cell morphology of hMSC. As shown in Figure 5B, knockdown of CK2α led to enlarged and flattened cytoskeleton, similar to that of IR-induced senescent cells (Figure 1A). On the other hand, knockdown of CK2α′ resulted in enlarged yet elongated cytoskeleton. Partial knockdown of CK2α and CK2α′ using CK2a10 siRNA resulted in mixed structures. Finally, we carried out SA-β-gal staining of hMSC with CK2 knockdown. As shown in Figure 5C and 5D, the population of SA-β-gal positive (blue, shown in grayscale) cells significantly increased in knockdown cells on day 3 and 6.
Discussion
Cellular senescence contributes to aging and cancer (10, 34). A growing list of genes has been implicated in cellular senescence (35-37). However, the exact mechanisms underlying initiation, progression, and maintenance of cellular senescence remain to be defined. In this work, we conclusively demonstrated IR-induced senescence of hMSC. Furthermore, we showed that cytoskeletal reorganization regulated by CK2 might be one of the central features associated with the cellular senescence. We propose a simplified model for cytoskeletal reorganization during IR-induced hMSC senescence progression (Figure 6): IR decreases CK2α, which results in less Ser1943 phosphorylation of myosin-9 and its redistribution from cytoskeleton to cytoplasm (day 1-3); subsequently, myosin-10 is reduced and profilin-1 is secreted (day 3-6).
Figure 6.
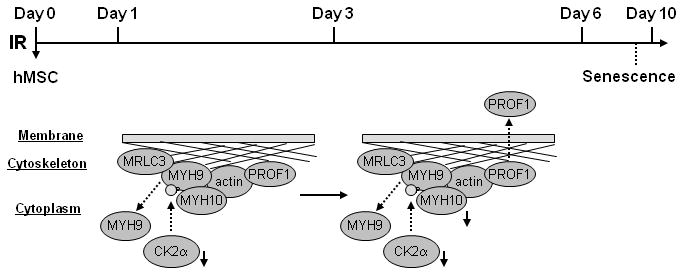
A scheme showing cytoskeletal reorganization during IR-induced senescence progression of hMSC. IR decreases CK2α, which results in less Ser1943 phosphorylation of myosin-9 and its redistribution from cytoskeleton to cytoplasm (day 1-3); subsequently, myosin-10 is reduced and profilin-1 is secreted (day 3-6).
Recent works have demonstrated that chemokines, cytokines, and growth factors play key roles in oncogene-induced senescence (11-14). IL-8 and GROα are regulated by NF-kB and C/EBP, and their binding to receptor CXCR2 reinforces senescence (12). IL-6 and IGFBP-7 have autocrine effects, preventing cell cycle progression once the senescence program is engaged (11, 13). At the paracrine level, the senescence-associated secretion of factors associated with tissue inflammation and malignancy is amplified by oncogenic Ras and restrained by the p53 tumor suppressor (14). In the case of IR-induced senescence of hMSC, we found that in addition to IL-8 and GRO, two other NF-kB targets genes, IL-12 and MDC, were also secreted. Although IL-6 was abundantly expressed and strongly secreted by hMSC, its secretion did not correspond to hMSC senescence. This suggests that SASPs are cell-type specific and/or stimuli-dependent. It will be interesting to investigate the roles of these cytokines and their corresponding receptors, including CXCR2, IL-12 receptor, and MDC receptor, in hMSC senescence.
One of the unique discoveries of our study was that cytokinesis may be perturbed through cytoskeletal reorganization. Non-muscle myosin II is a major component of actomyosin cytoskeleton and has been implicated in cytokinesis (38, 39). It contains myosin-9, myosin-10, and myosin regulatory light chain (MRLC3). Myosin-9 regulates cell motility and actomyosin–microtubule crosstalk (40), and plays an important role in mechanical response and lineage specification of hMSC (41). Phosphorylation is important in controlling myosin II assembly into filaments. For example, pSer19 of MRLC3 promotes filament assembly in vivo (42). Ser1943 phosphorylation of myosin-9 regulates motility of MDA-MB-231 carcinoma cells (31), and is involved in normal lamellar myosin II assembly control (43). Indeed, we demonstrated that pSer1943 of myosin-9 was directly associated with cytoskeletal reorganization during hMSC senescence. Profilins are small actin-binding proteins that regulate actin polymerization and control a complex network of molecular interactions (44). Both profilin-1 and IGFBP7 were downregualted in pancreatic cancer secretome (45), suggesting parallel responses between profilin-1 and senescence- or tumor-related cytokines. Interestingly, mammalian toll-like receptor 11 in dendritic cells was activated by a protozoan profilin-like protein, and this resulted in NF-kB activation and IL-12 production in dendritic cells (46). This opens up the possibility that cytoskeletal reorganization led to secretion of profilin-1, which induced NF-kB activation and subsequent secretion of NF-kB target cytokines.
We demonstrated mechanistically how CK2 regulated hMSC senescence. CK2 is required for cell cycle progression in Drosophila (47). It phosphorylates myosin-9 at Ser1943 in vivo (29-32). CK2 changes its cellular location and inhibits apoptosis of HeLa cells following ionizing radiation (48). Furthermore, CK2 phosphorylates and promotes promyelocytic leukemia gene (PML) degradation, which in turn reduces PML-induced senescence (49). Very recently, reversible phosphorylation of CK2α was shown to regulate mitotic progression (50). We showed a critical role of CK2 in regulating cytoskeletal reorganization through controlling pSer1943 of myosin-9. Importantly, we showed differential roles of the two catalytic subunits CK2α and CK2α′. CK2α seemed to play a more direct role in IR-induced senescence because knockdown of CK2α but not CK2α′, induced similar senescence phenotypes. CK2 is a constitutively active kinase and how its activity and substrates is regulated remains elusive. Possible mechanisms include localization, phosphorylation, and protein-protein interactions (23, 24). Our results suggest that modulation of the relative expression of CK2α and CK2α′ may be a potential new regulatory mechanism for CK2. Ongoing work will characterize the differential substrates of CK2α and CK2α′, and further elucidate the role of CK2 in cell cycle progression and senescence.
In summary, we have described a complex network for IR-induced senescence of hMSC. Future studies will investigate the role of hMSC senescence in aging and tumorigenesis.
Supplementary Material
Acknowledgments
We thank Drs. Judith Campisi and Jean-Philippe Coppé for commenting on the manuscript, Drs. Joe Gray, Mina Bissell and Song Li for suggestions, and Mr. Kevin Peet for administrative support. This work was supported by the Low Dose Radiation Research Program jointly funded by the U.S. Department of Energy (DOE) and the National Aeronautics and Space Administration (NASA), and by NIH R21GM077870. This work was performed under the auspices of the DOE, at the University of California/Lawrence Berkeley National Laboratory under contract No. DE-AC02-05CH11231.
Abbreviations
- SILAC
stable isotope labeling with amino acids in cell culture
- TUNEL
terminal dUTP nick-end labeling
- GAPDH
glyceraldehyde-3-phosphate dehydrogenase
- LC/MS/MS
liquid chromatography-tandem mass spectrometry
References
- 1.Beausejour CM, Campisi J. Ageing: balancing regeneration and cancer. Nature. 2006;443:404–5. doi: 10.1038/nature05221. [DOI] [PubMed] [Google Scholar]
- 2.Grove JE, Bruscia E, Krause DS. Plasticity of bone marrow-derived stem cells. Stem Cells. 2004;22:487–500. doi: 10.1634/stemcells.22-4-487. [DOI] [PubMed] [Google Scholar]
- 3.Rubio D, Garcia-Castro J, Martin MC, et al. Spontaneous human adult stem cell transformation. Cancer Res. 2005;65:3035–9. doi: 10.1158/0008-5472.CAN-04-4194. [DOI] [PubMed] [Google Scholar]
- 4.Serakinci N, Guldberg P, Burns JS, et al. Adult human mesenchymal stem cell as a target for neoplastic transformation. Oncogene. 2004;23:5095–8. doi: 10.1038/sj.onc.1207651. [DOI] [PubMed] [Google Scholar]
- 5.Karnoub AE, Dash AB, Vo AP, et al. Mesenchymal stem cells within tumour stroma promote breast cancer metastasis. Nature. 2007;449:557–63. doi: 10.1038/nature06188. [DOI] [PubMed] [Google Scholar]
- 6.Wang D, Park JS, Chu JS, et al. Proteomic profiling of bone marrow mesenchymal stem cells upon transforming growth factor β1 stimulation. J Biol Chem. 2004;279:43725–34. doi: 10.1074/jbc.M407368200. [DOI] [PubMed] [Google Scholar]
- 7.Kurpinski K, Jang DJ, Bhattacharya S, et al. Differential effects of x-rays and high-energy 56Fe ions on human mesenchymal stem cells. Int J Radiat Oncol Biol Phys. 2009;73:869–77. doi: 10.1016/j.ijrobp.2008.10.002. [DOI] [PubMed] [Google Scholar]
- 8.Olsen JV, Blagoev B, Gnad F, et al. Global, in vivo, and site-specific phosphorylation dynamics in signaling networks. Cell. 2006;127:635–48. doi: 10.1016/j.cell.2006.09.026. [DOI] [PubMed] [Google Scholar]
- 9.Matsuoka S, Ballif BA, Smogorzewska A, et al. ATM and ATR substrate analysis reveals extensive protein networks responsive to DNA damage. Science. 2007;316:1160–6. doi: 10.1126/science.1140321. [DOI] [PubMed] [Google Scholar]
- 10.Campisi J, d'Adda di Fagagna F. Cellular senescence: when bad things happen to good cells. Nat Rev Mol Cell Biol. 2007;8:729–40. doi: 10.1038/nrm2233. [DOI] [PubMed] [Google Scholar]
- 11.Wajapeyee N, Serra RW, Zhu X, Mahalingam M, Green MR. Oncogenic BRAF induces senescence and apoptosis through pathways mediated by the secreted protein IGFBP7. Cell. 2008;132:363–74. doi: 10.1016/j.cell.2007.12.032. [DOI] [PMC free article] [PubMed] [Google Scholar]
- 12.Acosta JC, O'Loghlen A, Banito A, et al. Chemokine signaling via the CXCR2 receptor reinforces senescence. Cell. 2008;133:1006–18. doi: 10.1016/j.cell.2008.03.038. [DOI] [PubMed] [Google Scholar]
- 13.Kuilman T, Michaloglou C, Vredeveld LC, et al. Oncogene-induced senescence relayed by an interleukin-dependent inflammatory network. Cell. 2008;133:1019–31. doi: 10.1016/j.cell.2008.03.039. [DOI] [PubMed] [Google Scholar]
- 14.Coppe JP, Patil CK, Rodier F, et al. Senescence-Associated Secretory Phenotypes Reveal Cell-Nonautonomous Functions of Oncogenic RAS and the p53 Tumor Suppressor. PLoS Biol. 2008;6:e301. doi: 10.1371/journal.pbio.0060301. [DOI] [PMC free article] [PubMed] [Google Scholar]
- 15.Chau BN, Wang JY. Coordinated regulation of life and death by RB. Nat Rev Cancer. 2003;3:130–8. doi: 10.1038/nrc993. [DOI] [PubMed] [Google Scholar]
- 16.Bargonetti J, Manfredi JJ. Multiple roles of the tumor suppressor p53. Curr Opin Oncol. 2002;14:86–91. doi: 10.1097/00001622-200201000-00015. [DOI] [PubMed] [Google Scholar]
- 17.Beausejour CM, Krtolica A, Galimi F, et al. Reversal of human cellular senescence: roles of the p53 and p16 pathways. EMBO J. 2003;22:4212–22. doi: 10.1093/emboj/cdg417. [DOI] [PMC free article] [PubMed] [Google Scholar]
- 18.Shibata KR, Aoyama T, Shima Y, et al. Expression of the p16INK4A gene is associated closely with senescence of human mesenchymal stem cells and is potentially silenced by DNA methylation during in vitro expansion. Stem Cells. 2007;25:2371–82. doi: 10.1634/stemcells.2007-0225. [DOI] [PubMed] [Google Scholar]
- 19.Raz V, Vermolen BJ, Garini Y, et al. The nuclear lamina promotes telomere aggregation and centromere peripheral localization during senescence of human mesenchymal stem cells. J Cell Sci. 2008;121:4018–28. doi: 10.1242/jcs.034876. [DOI] [PubMed] [Google Scholar]
- 20.Lou DY, Dominguez I, Toselli P, Landesman-Bollag E, O'Brien C, Seldin DC. The alpha catalytic subunit of protein kinase CK2 is required for mouse embryonic development. Mol Cell Biol. 2008;28:131–9. doi: 10.1128/MCB.01119-07. [DOI] [PMC free article] [PubMed] [Google Scholar]
- 21.Buchou T, Vernet M, Blond O, et al. Disruption of the regulatory beta subunit of protein kinase CK2 in mice leads to a cell-autonomous defect and early embryonic lethality. Mol Cell Biol. 2003;23:908–15. doi: 10.1128/MCB.23.3.908-915.2003. [DOI] [PMC free article] [PubMed] [Google Scholar]
- 22.Xu X, Toselli PA, Russell LD, Seldin DC. Globozoospermia in mice lacking the casein kinase II alpha′ catalytic subunit. Nat Genet. 1999;23:118–21. doi: 10.1038/12729. [DOI] [PubMed] [Google Scholar]
- 23.Allende JE, Allende CC. Protein kinases. 4. Protein kinase CK2: an enzyme with multiple substrates and a puzzling regulation. FASEB J. 1995;9:313–23. doi: 10.1096/fasebj.9.5.7896000. [DOI] [PubMed] [Google Scholar]
- 24.Meggio F, Pinna LA. One-thousand-and-one substrates of protein kinase CK2? FASEB J. 2003;17:349–68. doi: 10.1096/fj.02-0473rev. [DOI] [PubMed] [Google Scholar]
- 25.Trembley JH, Wang G, Unger G, Slaton J, Ahmed K. CK2: A key player in cancer biology. Cell Mol Life Sci. 2009 doi: 10.1007/s00018-009-9154-y. [DOI] [PMC free article] [PubMed] [Google Scholar]
- 26.Prudent R, Cochet C. New protein kinase CK2 inhibitors: jumping out of the catalytic box. Chem Biol. 2009;16:112–20. doi: 10.1016/j.chembiol.2009.01.004. [DOI] [PubMed] [Google Scholar]
- 27.Jang DJ, Guo M, Wang D. Proteomic and biochemical studies of calcium- and phosphorylation-dependent calmodulin complexes in Mammalian cells. J Proteome Res. 2007;6:3718–28. doi: 10.1021/pr0703268. [DOI] [PubMed] [Google Scholar]
- 28.Wang D, Jensen RH, Gendeh G, Williams KE, Pallavicini MG. Proteome and transcriptome analysis of retinoic acid-induced differentiation of human acute promyelocytic leukemia cells, NB4. J Proteome Res. 2004;3:627–35. doi: 10.1021/pr049976r. [DOI] [PubMed] [Google Scholar]
- 29.Kelley CA, Adelstein RS. The 204-kDa smooth muscle myosin heavy chain is phosphorylated in intact cells by casein kinase II on a serine near the carboxyl terminus. J Biol Chem. 1990;265:17876–82. [PubMed] [Google Scholar]
- 30.Kohlstedt K, Kellner R, Busse R, Fleming I. Signaling via the angiotensin-converting enzyme results in the phosphorylation of the nonmuscle myosin heavy chain IIA. Mol Pharmacol. 2006;69:19–26. doi: 10.1124/mol.105.016733. [DOI] [PubMed] [Google Scholar]
- 31.Dulyaninova NG, House RP, Betapudi V, Bresnick AR. Myosin-IIA heavy-chain phosphorylation regulates the motility of MDA-MB-231 carcinoma cells. Mol Biol Cell. 2007;18:3144–55. doi: 10.1091/mbc.E06-11-1056. [DOI] [PMC free article] [PubMed] [Google Scholar]
- 32.Yang F, Stenoien DL, Strittmatter EF, et al. Phosphoproteome profiling of human skin fibroblast cells in response to low- and high-dose irradiation. J Proteome Res. 2006;5:1252–60. doi: 10.1021/pr060028v. [DOI] [PubMed] [Google Scholar]
- 33.Pagano MA, Bain J, Kazimierczuk Z, et al. The selectivity of inhibitors of protein kinase CK2: an update. Biochem J. 2008;415:353–65. doi: 10.1042/BJ20080309. [DOI] [PubMed] [Google Scholar]
- 34.Ben-Porath I, Weinberg RA. When cells get stressed: an integrative view of cellular senescence. J Clin Invest. 2004;113:8–13. doi: 10.1172/JCI200420663. [DOI] [PMC free article] [PubMed] [Google Scholar]
- 35.Zhang H, Pan KH, Cohen SN. Senescence-specific gene expression fingerprints reveal cell-type-dependent physical clustering of up-regulated chromosomal loci. Proc Natl Acad Sci U S A. 2003;100:3251–6. doi: 10.1073/pnas.2627983100. [DOI] [PMC free article] [PubMed] [Google Scholar]
- 36.Mason DX, Jackson TJ, Lin AW. Molecular signature of oncogenic ras-induced senescence. Oncogene. 2004;23:9238–46. doi: 10.1038/sj.onc.1208172. [DOI] [PubMed] [Google Scholar]
- 37.Bavik C, Coleman I, Dean JP, Knudsen B, Plymate S, Nelson PS. The gene expression program of prostate fibroblast senescence modulates neoplastic epithelial cell proliferation through paracrine mechanisms. Cancer Res. 2006;66:794–802. doi: 10.1158/0008-5472.CAN-05-1716. [DOI] [PubMed] [Google Scholar]
- 38.Wong KC, D'Souza VM, Naqvi NI, Motegi F, Mabuchi I, Balasubramanian MK. Importance of a myosin II-containing progenitor for actomyosin ring assembly in fission yeast. Curr Biol. 2002;12:724–9. doi: 10.1016/s0960-9822(02)00790-x. [DOI] [PubMed] [Google Scholar]
- 39.Matsumura F. Regulation of myosin II during cytokinesis in higher eukaryotes. Trends Cell Biol. 2005;15:371–7. doi: 10.1016/j.tcb.2005.05.004. [DOI] [PubMed] [Google Scholar]
- 40.Even-Ram S, Doyle AD, Conti MA, Matsumoto K, Adelstein RS, Yamada KM. Myosin IIA regulates cell motility and actomyosin-microtubule crosstalk. Nat Cell Biol. 2007;9:299–309. doi: 10.1038/ncb1540. [DOI] [PubMed] [Google Scholar]
- 41.Engler AJ, Sen S, Sweeney HL, Discher DE. Matrix elasticity directs stem cell lineage specification. Cell. 2006;126:677–89. doi: 10.1016/j.cell.2006.06.044. [DOI] [PubMed] [Google Scholar]
- 42.Scholey JM, Taylor KA, Kendrick-Jones J. Regulation of non-muscle myosin assembly by calmodulin-dependent light chain kinase. Nature. 1980;287:233–5. doi: 10.1038/287233a0. [DOI] [PubMed] [Google Scholar]
- 43.Breckenridge MT, Dulyaninova NG, Egelhoff TT. Multiple regulatory steps control mammalian nonmuscle myosin II assembly in live cells. Mol Biol Cell. 2009;20:338–47. doi: 10.1091/mbc.E08-04-0372. [DOI] [PMC free article] [PubMed] [Google Scholar]
- 44.Witke W. The role of profilin complexes in cell motility and other cellular processes. Trends Cell Biol. 2004;14:461–9. doi: 10.1016/j.tcb.2004.07.003. [DOI] [PubMed] [Google Scholar]
- 45.Gronborg M, Kristiansen TZ, Iwahori A, et al. Biomarker discovery from pancreatic cancer secretome using a differential proteomic approach. Mol Cell Proteomics. 2006;5:157–71. doi: 10.1074/mcp.M500178-MCP200. [DOI] [PubMed] [Google Scholar]
- 46.Yarovinsky F, Zhang D, Andersen JF, et al. TLR11 activation of dendritic cells by a protozoan profilin-like protein. Science. 2005;308:1626–9. doi: 10.1126/science.1109893. [DOI] [PubMed] [Google Scholar]
- 47.Bettencourt-Dias M, Giet R, Sinka R, et al. Genome-wide survey of protein kinases required for cell cycle progression. Nature. 2004;432:980–7. doi: 10.1038/nature03160. [DOI] [PubMed] [Google Scholar]
- 48.Yamane K, Kinsella TJ. CK2 inhibits apoptosis and changes its cellular localization following ionizing radiation. Cancer Res. 2005;65:4362–7. doi: 10.1158/0008-5472.CAN-04-3941. [DOI] [PubMed] [Google Scholar]
- 49.Scaglioni PP, Yung TM, Cai LF, et al. A CK2-dependent mechanism for degradation of the PML tumor suppressor. Cell. 2006;126:269–83. doi: 10.1016/j.cell.2006.05.041. [DOI] [PubMed] [Google Scholar]
- 50.St-Denis NA, Derksen DR, Litchfield DW. Evidence for regulation of mitotic progression through temporal phosphorylation and dephosphorylation of CK2alpha. Mol Cell Biol. 2009;29:2068–81. doi: 10.1128/MCB.01563-08. [DOI] [PMC free article] [PubMed] [Google Scholar]
Associated Data
This section collects any data citations, data availability statements, or supplementary materials included in this article.