

Abstract
Purpose
Regulatory T cells (Treg) frequency/activity are increased in cancer patients and play a major in tumor escape. While disease progression is favored by the presence of Treg, mechanisms used by Treg to suppress anti-tumor immunity are unknown. The ectonucleotidases CD39 and CD73 are expressed in Treg and convert ATP into immunosuppressive adenosine. In this study, the involvement of the adenosinergic pathway in Treg-mediated suppression in HNSCC patients was evaluated.
Experimental Design
HNSCC patients with an active disease (AD) (n=19) and patients with no evident disease (NED) after therapy (n=14) were studied. Ectonucleotidase expression on CD4+ T cells and CD4+CD25high Treg was evaluated by flow cytometry and compared to normal controls (NC). Ectonucleotidase activity was also compared within these 3 groups. The data were analyzed for associations of ectonucleotidase expression/function with disease stage.
Results
The percentages and expression levels of CD39 and CD73 in CD4+ T cells and Treg were greater in HNSCC than NC and were highest in NED. Patients' Treg hydrolyzed ATP at higher rates and produced higher levels of adenosine than NC' Treg. The increased frequency and enzymatic activity of CD4+CD39+ cells corresponded to increased adenosine-mediated suppression of effector T cells, which was partly inhibited by ARL67156, an ectonucleotidase inhibitor, and by ZM241385, a selective A2a/A2b receptor antagonist.
Conclusions
CD39+ Treg frequency and adenosine-mediated suppression are significantly increased in HNSCC patients. The adenosinergic pathway is involved in Treg-mediated immunosuppression in cancer and its attenuation could be a promising immunotherapeutic strategy for patients with HNSCC.
Keywords: head and neck cancer, ectonucleotidases, regulatory T cells, tumor escape, adenosine
Introduction
Head and neck squamous cell carcinoma (HNSCC), arising from the mucosal epithelium, is the 5th most common type of cancer worldwide and the 6th most common cause of cancer related mortality (1, 2). Although advances in surgical methods, chemotherapy and radiation have improved patients' treatment and quality of life, the overall outcome and survival rate among patients with this disease have not notably improved (3). Therefore, novel therapeutic strategies are necessary for the treatment of HNSCC. Recent studies have focused on the dynamic interplay and coevolution of anti-tumor immune responses and tumor progression in HNSCC (4, 5). These studies have shown that T lymphocytes play a major albeit contradictory role in local tumor expansion, metastasis and neo-angiogenisis. In most human cancers, regulatory T cells (Treg), a small subset of CD4+ T cells, are significantly increased in the peripheral blood as well as in the tumor microenvironment (6, 7, 8). Treg are phenotypically defined as CD4+CD25highFOXP3+, and they modulate immune responses by suppressing functions of other T cells. To date, at least two types of Treg are known to exist in man: (a) naturally occurring Treg (nTreg), which develop in the thymus and are responsible for maintaining peripheral tolerance using cell contact-dependent or -independent suppression (9, 10) and (b) inducible Treg (Tr1) which arise in the periphery upon antigen exposure and suppress effector T cells mainly by cell contact-independent secretion of cytokines such as IL-10 and TGF-β (11, 12). The mechanisms responsible for suppression mediated by Treg in cancer patients are still poorly understood. It is possible that suppression mediated by Treg accumulating in the peripheral blood and/or at the tumor site of patients with cancer facilitate tumor escape from the host immune system and might also be partly responsible for poor responses of these patients to immunotherapy (13).
We have recently demonstrated that the frequency and suppressive function of Treg were persistently elevated in the peripheral blood of HNSCC patients with active disease (AD) as well as patients who were disease free (NED) after receiving oncologic therapy (8). These findings suggest that chemo- and/or radiation therapy have a significant impact on the phenotype, frequency and turnover dynamics of Treg. However, the full impact of Treg-mediated effects on disease progression and response to immunotherapy in HNSCC remains unclear.
It has been shown that murine and human Treg participate in the conversion of extracellular ATP and ADP to adenosine (14, 15, 16). The dephosphorylation of ATP and ADP to AMP is mediated by surface-associated CD39, while CD73 further reduces AMP to adenosine. Initially, Kobie et al reported that CD73 is overexpressed on Treg (16) and, based on the observations of Ohta and Sitkovsky (17), these investigators connected the ectoenzyme expression to downstream signaling via the A2a receptor on effector cells. Adenosine suppresses functions of immune effector T cells by binding to A2a receptors (A2aR) expressed on their cell surface (17-20). Subsequently, Robson's group identified CD39 overexpression in Treg, which functions up-stream of CD73 (14), and extended previous studies to establish the in vivo role of A2aR in immunosuppression. In aggregate, these earlier studies have established that Treg can mediate immunosuppression by contributing to the ATP breakdown and adenosine generation.
Here, we demonstrate that the frequency of CD4+CD39+ T cells in the periphery and their enzymatic activity (i.e., hydrolysis of ATP) are increased in HNSCC and, therefore, extracellular adenosine production is higher in these patients relative to normal controls (NC). Elevations in adenosine levels are responsible for suppressor functions of single-cell sorted CD4+CD39+ Treg in patients with an AD as well as those with NED after successful therapy. Further, HNSCC patients with a late disease stage have a significant higher frequency and activity levels of adenosine-generating CD4+CD39+ Treg than those with an early disease stage.
Materials and Methods
HNSCC patients and healthy volunteers
Peripheral venous blood samples were obtained from 33 HNSCC patients and 15 age-matched NC. All patients were seen in the Outpatient Clinic of the Department of Otolaryngology at the University of Pittsburgh Medical Center (UPMC) between November 2007 and July 2008. All subjects signed an informed consent approved by the Institutional Review Board of the University of Pittsburgh. The NC cohort included 4 females and 11 males with a mean age of 57 ± 12 years (range, 45 – 67 years). The patient cohort included 8 females and 25 males with a mean age of 62 ± 12 years (range, 41 – 77 years). The clinicopathologic data for the patient group are listed in Table 1. At the time of blood draws, 19 patients had an active disease (AD), including 18 newly diagnosed cases and one patient with a recurrent disease. The other 14 patients had no evidence of disease (NED) following oncologic therapies. In all of the patients a surgical removal of the primary tumor was performed and 7 patients additionally received an adjuvant radiochemotherapy. When applied, radiochemotherapy was finished from 3 weeks to 12 months prior to the time of blood draws for immunologic studies.
Table 1.
Clinicopathologic characteristics of enrolled HNSCC patients
| Age (years) | |
| mean range | 41-77 |
| Sex | |
| male | 25 |
| female | 8 |
| Tumor site | |
| nasopharynx | 2 |
| oral cavity | 13 |
| oropharynx | 3 |
| larynx | 12 |
| not determined | 3 |
| Tumor differentiation | |
| G1 | 8 |
| G2 | 15 |
| G3 | 2 |
| Gx | 8 |
| Tumor stage | |
| T1 | 8 |
| T2 | 8 |
| T3 | 2 |
| T4 | 4 |
| Tx | 11 |
| Nodal status | |
| N0 | 14 |
| N1 | 0 |
| N2 | 8 |
| N3 | 1 |
| Nx | 10 |
| Status at blood draw | |
| Active disease (AD) | |
| primary disease | 18 |
| recurrent disease | 1 |
| No evident disease (NED) | |
| primary disease | 12 |
| recurrent disease | 2 |
| Disease Stage (AD) | |
| Early stage | 10 |
| Advanced stage | 9 |
| Therapy before blood draw (NED) | |
| Surgery alone | 7 |
| Surgery + Radiochemotherapy | 7 |
Collection of peripheral blood mononuclear cells
Blood samples (20-30 mL) were drawn into heparinized tubes and centrifuged on Ficoll-Hypaque gradients (GE Healthcare Bioscience). PBMC were recovered, washed in AIM-V medium (Invitrogen), counted in a trypan blue dye, and immediately used for experiments.
Separation of Treg
CD4+CD25neg T cells, which served as responder cells (RC), were freshly isolated by negative selection from PBMC (NC and HNSCC), using the Regulatory T cell Separation Kit and AutoMACS (Miltenyi Biotech). CD4+CD39+ and CD4+CD25high Treg cells were single cell-sorted from PBMC following staining for lymphocytes with the relevant markers.
Antibodies
The following anti-human monoclonal antibodies were used for flow-cytometry: anti-CD3-ECD, anti-CD4-ECD, anti-CD4-PC5, anti-CD25-PC5, anti-FOXP3-FITC (clone: PCH101), anti-CD39-FITC, anti-CD39-PE, anti-CD73-PE, unconjugated anti-CD73 and anti-CTLA4-PE. Antibodies and their respective isotypes, which served as negative controls for surface as well as intracellular staining, were purchased from Beckman Coulter, except for anti-FOXP3 (clone PCH101), anti-CD39-FITC and anti-CD39-PE which were purchased from eBioscience. Also, anti-CD73-PE was purchased from BD Pharmingen. The anti-CTLA4-PE Ab was purchased from R&D Systems, and the unconjugated anti-CD73 Ab was purchased from SantaCruz. The FITC-conjugated AffiniPure Goat anti-mouse secondary antibody was purchased from Jackson ImmunoResearch. Before use, all Abs were titrated using activated as well as non-activated PBMC to determine the optimal staining dilution for each.
Surface and intracellular staining
Freshly isolated cells were stained for flow cytometry as previously described (1). Briefly, cells were incubated with the antibodies for surface markers for 30 minutes at 4°C in the dark and then fixed with 2% (w/v) paraformaldehyde in PBS for 15 min. Afterwards, the cells were permeabilized with 0.1% (w/v) saponin in PBS for 30 min and stained with Abs specific for intracellular markers for 30 min at 4°C in the dark. Cells were washed twice with 0.1% saponin in PBS, resuspended in a flow solution and immediately analyzed by flow cytometry. Appropriate isotype controls were included for each sample.
Flow cytometry
Flow cytometry was performed using a EPICS® XL-MCL flow cytometer equipped with Expo32 software (Beckman Coulter). The acquisition and analysis gates were restricted to the lymphocyte gate based on characteristic properties of the cells in the forward (FSC) and side scatter (SSC). FSC and SSC were set in a linear scale, and at least 105 cells were acquired for analysis, which was performed using the Coulter EXPO 32vl.2 analysis program. For additional analyses, gates were restricted to the CD3+CD4+, CD3+CD4+CD39+, CD3+CD4+CD73+, CD4+CD25high or CD4+FOXP3+ T cells subsets.
ATP hydrolysis assay
Magnetic cell-sorted CD4+CD25neg or CD4+CD25high cells (25 × 103/well) from the NC or HNSCC patients were incubated in wells of flat-bottom 96-well plates for 30 min with 10 μM of exogenous ATP (Sigma-Aldrich). Some wells were pre-incubated with ARL67156, an ectonucleotidase inhibitor (Sigma Aldrich), for 30 min prior to the addition of exogenous ATP at the final concentration of 250 μM. The concentration of “unhydrolyzed” ATP was determined by measuring the frequency of luminescent events (CPM) in a luciferase-based detection system (ATP Lite Luminescence ATP Detection Assay System purchased from PerkinElmer). The plates were examined in a Microplate Scintillation and Luminescence Counter (Packard). The average count was determined from triplicate wells. The percentage of ATP hydrolysis was determined by using the following formula: (1- (CPM ATPsample / (CPM ATPalone + CPM ATP for cellsalone)) × 100
Mass spectometric analysis of adenosine production
CD4+CD25neg or CD4+CD25high T cells (25,000 cells/well) from NC as well as HNSCC patients were incubated with 10 μM exogenous ATP in wells of 96-well flat bottom plates. To selected wells, ARL67156 or α,β-methylene ADP, an ecto-5′-NT/CD73 inhibitor (Sigma-Aldrich, 100 μM), was added. Cell supernatants were collected after various incubation time points. Samples were centrifuged and boiled for 2 min and stored on dry ice until analysis. Adenosine was measured on a Thermofinnigan LCQ Duo mass spectrometer equipped with electrospray ionization. The samples were separated using a C18 column (Eclipse XDB-C18, 4.6 × 150 mm, 5 um). A mobile phase consisted of 0.1% formic acid water and methanol solution. The flow rate of a mobile phase was 0.6 mL/min. The analytes were monitored with single-ion monitoring in the positive-ion mode; for adenosine the mass-to-charge ratio was 268; for 10-13C-adenosine (internal standard) the mass-to-charge ratio was 278. The internal standard (10-13C-adenosine) in supernatants is 10 pg/μL. The average concentration of adenosine was determined in duplicate wells.
Suppression Assays
Single cell-sorted CD4+CD39+ were tested for suppression of proliferation activity in co-cultures with autologous CD4+CD25neg responder cells (RC) as previously described (21). CFSE-labeled autologous CD4+CD25neg 105cells/well were incubated in wells of flat-bottom 96-well plates at the suppressor (S)/responder cell (RC) ratios of 1:1, 1:2, 1:5 and 1:10. Using the same assay format, either ARL67165 (250μM) or MRS1191 (0.5μM), purchased from Sigma Aldrich; ZM241385 (0.3μM), MRS1706 (0.5μM) or DPCPX (0.5μM) purchased from Tocris Bioscience; or neutralizing anti-TGF-β1 mAb and/or anti-IL-10 mAb (1μg/mL; both from R&D Systems), or appropriate isotype controls were added to selected wells 30 min prior to adding the S cells. To induce proliferation, RC were stimulated with plate-bound OKT-3 (2 μg/mL) and soluble anti-CD28 mAb (2 μg/mL) (Miltenyi) in the presence of 150 IU/mL IL-2 for 5 days. All CFSE data were analyzed using the ModFit software provided by Vertify Software house (Topsham) as previously described (21).
Immunoflourescence
HNSCC tissue samples were embedded in OCT and 5 mm frozen sections were cut in a cryostat, fixed for 10 min in cold acetone/ethanol (1:1) and dried at room temperature. The following anti-human Abs were used for staining: anti-CD4-FITC, CD25-PE (BD Pharmingen), anti-CD39, and anti-CD73 (Santa Cruz). As secondary Ab, Cy5-labeled donkey anti rabbit (Jackson ImmunoResearch) was used. To eliminate non-specific binding of secondary Abs, first tissue sections were incubated with 10% donkey serum for 1 h, and afterwards washed extensively in PBS. Sections were incubated with the primary Abs for 1 h at room temperature in a moist chamber. Next, slides were washed and incubated with the secondary Abs under the same conditions. Primary Abs were omitted in all negative controls. Sections were mounted in a mounting medium with DAPI (Vector Laboratories) in order to trace cell nuclei. Slides were evaluated in the Olympus Provis (Olympus, Japan) fluorescence microscope under 400 × mag. For digital image analysis the software Adobe Photoshop 6.0 version was used.
Statistical analysis
All data were presented as the means of at least three experiments ± 1 standard deviation (SD) and medians. The data were analyzed using the Kruskal Wallis test or Wilcoxon Mann Whitney test for comparisons across outcome groups (NC versus AD versus NED). Data are presented in box plots showing the mean, median and interquartile range. Changes in adenosine production and ATP hydrolysis were analyzed with the Student t test. Analyses were performed using SAS v9.1 (Cary, NC) or Stat Xact 8 and a significance level of 0.05 was assumed.
Results
Expression of CD39 on CD4+ T cells and Treg in the peripheral blood of HNSCC and NC
PBMC were obtained from NC and HNSCC patients who had either an active disease (AD) or had no evident disease (NED). The frequency of CD4+CD39+ T cells was initially examined by flow cytometry in the total CD3+CD4+ cell population in PBMC. Patients with AD had significantly higher frequency of CD4+CD39+ T cells than NC (12 ± 4% (median: 11.35) vs. 6 ± 4% (median: 5.5), p<0.01), (Figure 1A, B). Also the level of expression, i.e., the mean fluorescence intensity (MFI), of CD39 on CD4+ cells was increased in AD vs. NC (20 ± 4% (median: 20.0) vs. 14 ± 4% (median: 14.3); p<0.001; Figure 1C). CD4+ T cells of patients who were NED expressed even higher levels of CD39 (MFI: 24 ± 4 (median: 23.8) vs. 20 ± 4 (median: 20.0), p<0.001, Figure 1C) and these patients also had the highest frequency of CD4+CD39+ cells (15 ± 8% (median: 14.0) vs. 12 ± 4% (median: 11.35), p<0.01; Figure 1 A, B)
Figure 1. Increased CD39 expression in CD3+CD4+ and CD4+CD25high T cells in patients with HNSCC.

(A) Dot plots show percentages of CD39+ cells within the CD4+ T cell population in the peripheral blood of a representative NC and two HNSCC patients, one with an AD and one with NED. (B) The percentages of CD39+ T cells in the CD4+ T cell population of NC and of all patients were determined by flow cytometry. Data is obtained from at least 14 individual experiments per group. (C) The mean fluorescence intensity (MFI) for CD39 on CD4+ T cells in all patients and NC was determined by flow cytometry. (D) The percentages of CD39 expression and levels of expression (E) of CD39 in CD4+CD25high cells (cells with a MFI > 120 for CD25 expression) were determined by flow cytometry for at least 14 individual experiments per group.
Since CD25high and FOXP3 have been generally used as markers for human Treg, we have examined whether CD4+CD25high cells, of which 83 ± 10% were also FOXP3+ as previously reported by us ((8); range: 67-95%, n=15), expressed CD39. Gating on CD4+CD25high cells (i.e, MFI > 120; (8)), we observed higher expression levels and frequencies of CD39 compared to CD4+CD25neg cells in all three cohorts (data not shown). Further, the frequency and MFI of CD4+CD25high CD39+ were significantly higher in the peripheral blood of HNSCC than in NC, with the highest % and levels of CD39 expression observed in the peripheral blood of patients with NED (Figure 1D, E). Gating on CD4+CD39+ cells we observed that up to 80% of these cells were FOXP3+ and mostly CTLA-4+ in all three cohorts (data not shown).
Expression of CD73 in CD3+CD4+ T cells and Treg in the peripheral blood of HNSCC and NC
The final step in adenosine production is catalyzed by CD73, a 5′ectonucleotidase. Since adenosine is the metabolite responsible for immunosuppression of effector T cells, it was important to determine expression and activity of CD73 in CD4+ T cells and Treg. Similar to our previously reported data, intracellular staining for CD73 revealed that 75 ± 6% of CD4+CD25high are CD73+ compared to 15 ± 4% of non-Treg1. In CD3+CD4+ T cells, the level of CD73 expression was increased in AD patients compared to NC (data not shown). In Treg, the frequency as well as MFI of CD73 were increased in the peripheral blood of patients with HNSCC compared to NC, although the difference was not statistically significant (data not shown). Most of the CD4+CD73+ cells co-expressed FOXP3+ and CTLA4+ in all three cohorts (data not shown).
Correlation of CD39 expression with disease progression and radiochemotherapy
To determine whether any relationship could be established between percentages of CD39+ cells present in the peripheral circulation and disease progression, we divided HNSCC patients with AD into those with an early stage disease without lymph node metastasis and those with an advanced stage disease and involved lymph nodes (Table 1). The frequency of CD4+CD39+ T cells was significantly increased (p< 0.01) in patients with the late stage disease compared to those with the early disease stage (8 ± 5% (median: 8.15) vs. 11 ± 4% (median: 90.5), Figure 2A). A significant increase in the level of CD39 expression (MFI) was also observed in the late stage disease group (p< 0.01, data not shown). The percentage of CD39+ Treg within the CD4+CD25high subset was as well significantly higher in patients with the late stage disease (82 ± 11% (median: 80.7) vs. 89 ± 6% (median: 90.5), p< 0.03; Figure 2B).
Figure 2. Correlations of ectonucleotidase expression on T cell subsets with disease progression and surgery vs. surgery + radiochemotherapy.
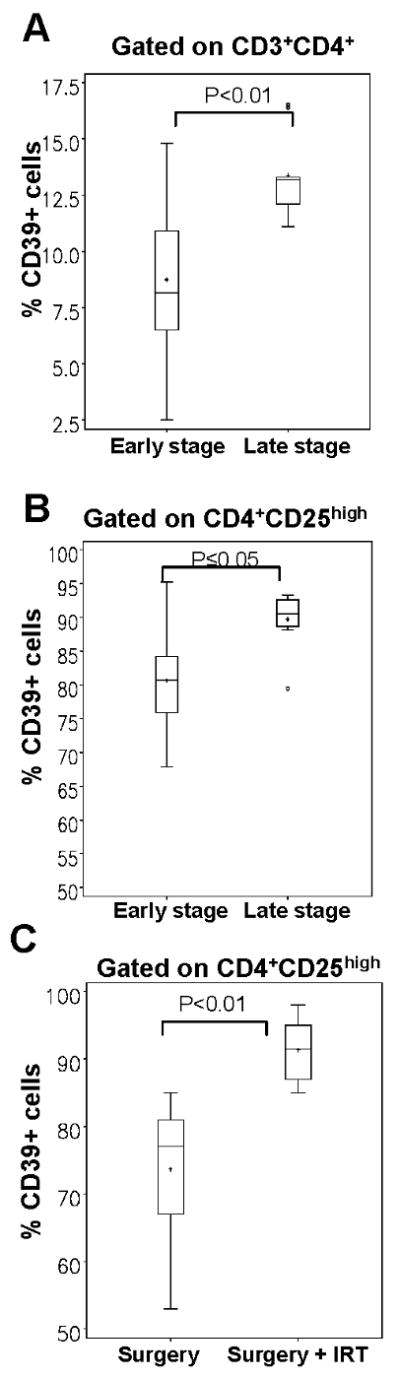
The AD cohort was subdivided into: a) patients with an early disease stage and b) with an advanced disease stage. Percentages and levels of CD39 expression are shown. Data are means ± SD. The frequency of CD39 expression on CD3+CD4+ cells (A) and on CD4+CD25high cells (B) was determined in AD patients, whereas early disease stage patients (n=10) were compared to patients with an advanced disease stage (n=9). (C) The NED cohort was subdivided into a) patients treated with surgery alone (n=7), and b) patients treated with surgery and combined radiochemotherapy (n=7). The frequency of CD39 expression was determined on CD4+CD25high Treg in both groups.
Within the NED patient cohort, a significant increase in the % of CD39+ Treg was observed in patients who were treated with surgery in combination with radiochemotherapy compared to patients treated with surgery alone (83 ± 6% (median: 77.0) vs. 92 ± 4 (median: 91.5), p<0.01, Figure 2C). Overall, these phenotypic data suggest that significant changes in the frequency of CD4+CD39+ and CD4+CD25highCD39+ cells occur with disease progression, and that therapy has a an impact on the frequency of CD4+CD39+ T cells in the peripheral circulation.
In situ analysis of CD39+ and CD73+ Treg in head and neck tumor tissues
Next, the presence and distribution of CD4+CD39+ Treg in HNSCC biopsy tissue was evaluated using multicolor immunofluorescence and confocal microscopy (Figure 3A-D). Tumor tissue sections were stained with labeled mAb. As shown in Figure 3C, CD4+CD25+CD39+ cells (violet) infiltrate the tumor tissue. In fact, most of the CD4+CD25+ cells (yellow) in the tumor, express CD39 and are localized in the proximity of CD4+CD25neg cells (green; see inset), suggesting that these cell subsets interact in situ. However, Treg are not the only cells in the tumor that express CD39. Endothelial cells have been reported to also express CD39 and show increased activity in the tumor microenvironment facilitating neoangiogenesis (22). As shown in Figure 3D, most of the CD73+ cells are co localized to CD4+CD25+ cells (violet). These cells seem to be arranged in clusters, which are localized close to effector T cells. Also, the tumor cells seem to express CD73. These findings support the conclusion that CD39+ Treg as well as CD73+ Treg accumulate in HNSCC tissues and are in a direct contact with effector T cells.
Figure 3. CD39 and CD73 expression on T cells in HNSCC tissues.
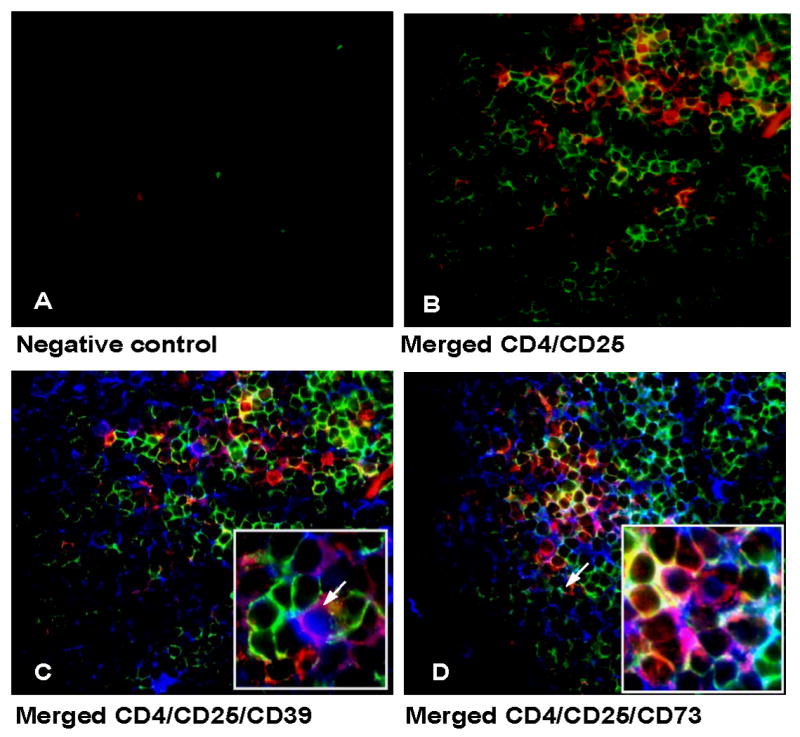
CD4+CD25+, CD4+ CD25+CD39+ as well as CD4+CD25+CD73+ T cells are shown in sections of a representative tumor of 5 examined (mag. × 400, Inset in 4C and 4D mag. × 600). (A) negative control (B) CD4+ cells are visible in green, CD25+ cells are red; CD4+CD25+ cells are yellow. (C) Section stained for CD4, CD25 and CD39. CD39+ cells appear blue; CD4+CD25+CD39+ cells are violet. CD4+CD25negCD39neg T cells appear red. (D) Section stained for CD4, CD25 and CD73. CD4+ cells are red, CD25+ cells appear green, CD73+ cells are blue. Localization of CD4+CD25+CD73+ Treg (violet) can be observed in the proximity of CD4+CD25neg cells (red).
Hydrolysis of exogenous ATP by Treg in HNSCC vs. NC
While the frequency and expression levels for the ectonucleotidases CD39 and CD73 on Treg was higher in HNSCC patients than NC, it was important to determine whether their enzymatic activities were also increased in parallel. Single cell-sorted CD4+CD25high cells were, therefore, obtained from the peripheral blood of subjects in all three cohorts and were incubated with 10 μM exogenous ATP for 60 min. Compared to NC, Treg of patients with AD or NED hydrolyzed significantly more ATP (Figure 4A; p<0.05). Upon the prior addition of ARL67156, a selective inhibitor of ecto-ATPases, the ability of Treg cells to hydrolyze ATP was significantly decreased in all three groups (Figure 4A, p<0.001). Subdivision of the AD group into early and advanced stage revealed an increase in Treg-mediated hydrolysis of ATP in cells obtained from patients with an advanced stage disease (data not shown).
Figure 4. Enzymatic activity of the ectonucleotidase CD39 in Treg obtained from HNSCC patients and NC and suppression mediated by CD4+CD39+ Treg ± various inhibitors.

(A) Single cell-sorted CD4+CD25high and CD4+CD25neg cells were plated in 96-well plates (25,000 cells/well) in serum-free medium with 10μM of exogenous ATP and unhydrolyzed ATP was measured after 30 min of incubation. The % hydrolysis was calculated based on a standard curve. ARL67156 (selective ecto-ATPase inhibitor) was added to selected wells. Asterisks indicate a significant difference (p<0.01) between cultures without and with the inhibitor. Data (means ± SD) are from 3 independent experiments. (B) MACS-sorted CD4+CD25neg cells (RC) were CFSE labeled and stimulated with plate-bound OKT-3 and soluble anti-CD28 in the presence of CD4+CD39+ cells and 150 IU/mL of IL-2 for 5 days. Cells were analyzed by flow cytometry and further analyzed using the ModFit program, gating on CD4+CFSE+ T-cell subsets. Suppression of CD4+CD25neg cell proliferation mediated by CD4+CD39+ cells at various RC/S ratios isolated from NC and patients with cancer is shown. (C) Suppression of proliferation of RC in the presence of CD4+CD39+ cells isolated from AD patients is shown. To selected wells, ZM241385, a selective A2a and A2bR antagonist, or ARL67156, an ectonucleotidase inhibitor, is added. (D) Suppression of proliferation of RC in the presence of CD4+CD39+ cells at various RC/S ratios isolated from NED patients is shown. To selected wells, ZM241385 or ARL67156 is added. (E) Suppression of proliferating RC in the presence of CD4+CD39+ Treg pretreated or not with ZM241385, neutralizing anti-TGF-β1 and anti-IL-10 mAbs or ZM241385 plus the two neutralizing mAbs. The p value is for differences in suppression levels between Treg treated with mAbs alone vs. Treg treated with mAbs plus ZM241385. The data (mean % suppression ± SD) in B-E were obtained from 3 independent experiments.
Adenosine production by Treg in HNSCC vs. NC cells
To further analyze the activity of the ectonucleotidases CD39 and CD73 in Treg, we compared the ability of CD4+CD25high Treg and autologous CD4+CD25neg cells obtained from patients with AD to produce adenosine following the addition of 10 uM of exogenous ATP. Adenosine levels were measured in the cell supernatants collected at various time points after ATP addition. The CD4+CD25high cells produced more adenosine than the CD4+CD25neg cells (Supplementary Table 1; p≤0.001). Compared to Treg of NC, those isolated from AD patients produced almost 6 times more adenosine after 60 min (Table 2). Also, when no exogenous ATP was added to the cultures, the amount of adenosine after 60 min measured in the supernatant of Treg from AD patients was significantly increased compared to that measured with Treg of NC (Table 2; p≤0.001). Upon co-incubation of CD4+CD25high cells with ARL67156, adenosine production was almost completely blocked (Table 2, p<0.001). Also, we observed a complete inhibition of adenosine production by CD4+CD25high cells when α,β-methylene ADP was added to selected wells (Table 2, p≤0.001).
Table 2.
Adenosine production by regulatory T cells obtained from the peripheral blood of normal donors and HNSCC patients a
| Adenosine measured (pg/uL) | ||
|---|---|---|
| NC | AD | |
| No Inhibitor | 131 ± 40 | 754 ± 147 |
| + ARL67156 | 35 ± 12 | 102 ± 21 |
| + α,β − methylene ADP | 10 ± 6 | 16 ± 8 |
Cells were incubated with exogenous ATP (10μM) and supernatants were collected after 60 min. Adenosine concentrations were measured using mass spectrometry. ARL67156, an ectonucleotidase inhibitor (250 uM/mL), or α, β- methylene ADP, a CD73 inhibitor (100μM/mL), were added to selected wells. Data represent 3 individual experiments (NC=normal control, AD= HNSCC patients with active disease).
Suppressor function of circulating CD4+CD39+ in HNSCC vs. NC
To analyze suppressor activity of CD4+CD39+ cells, single-cell sorted CD4+CD39+ cells suppressor cells (S) from freshly isolated PBMC were co-incubated with autologous CD4+CD25neg responder cells (RC) at different S/RC ratios. After a five-day culture, the mean suppressor activity of CD4+CD39+ cells at the 1S:1RC ratio was 38% ± 3 in NC, whereas in patients with AD an increase up to 82% ± 3 and in patients with NED up to 93% ± 5 was observed (Figure 4B). The suppression of proliferation linearly decreased upon further dilution of S (Figure 4B). Since Treg from HNSCC patients are increased in ectonucleotidase expression and activity, the generation of high levels of adenosine most likely contributes to the suppressive function of these cells.
Effects of ectonucleotidase inhibitors on suppression mediated by CD4+CD39+ cells
To further test the hypothesis that adenosine generated by Treg due to ectonucleotidase activity is responsible for immunosuppression of RC proliferation, additional co-cultures experiments were performed. Specifically, the addition of ARL67156, a structural analogue of ATP and an ectonucleotidase inhibitor, to co-cultures of CD4+CD39+ cells serving as S cells with autologous RC, resulted in a significant decrease of the suppression compared to cultures without the inhibitor in AD (82% ± 9 vs. 22% ± 1; p<0.001; Figure 4C) and NED patients (93% ± 5 vs. 23% ± 4; p<0.001; Figure 4D).
Effects of adenosine receptor antagonists on suppression mediated by CD4+CD39+ cells
Since the immunosuppressive effects of adenosine are known to be mediated via the A2AR, which is expressed on effector T cells (23), we expected to see a decrease of suppression in RC proliferation, when this receptor was blocked on effector T cells. Therefore, we added ZM241385, a selective A2a and A2b receptor antagonist, to the above described RC/S co-cultures. As expected, the addition of ZM241385 significantly blocked the suppression mediated by CD4+CD39+ cells at the 1S:1RC ratio in AD (20% ± 4 vs. 82% ± 9, p<0.001) and NED (25% ± 3 vs. 92% ± 4, p<0.001) as shown in Figure 4C, D). An almost complete block of CD4+CD39+ Treg-mediated immune suppression was observed after adding ZM241385 and neutralizing anti-TGF-β and anti-IL-10 mAbs to the co-cultures (9% ± 2 vs. 83% ± 3, p<0.001; Figure 4E). Addition of other adenosine receptor antagonists such as DPCPX, a selective A1 receptor antagonist, or MRS1191, a selective A3 receptor antagonist, or MRS1706, a selective A2b receptor antagonist did not show any effect on CD39+ T cell-mediated suppression on RC proliferation. In aggregate, the data suggest that suppression of effector T cell proliferation by CD39+ Treg is in part mediated by the engagement of the A2aR on these effector cells and in part on the ability of Treg to produce immunosuppressive cytokines, TGF-β1 and IL-10.
Discussion
In patients with cancer, Treg frequencies appear to correlate with the disease status and survival and seem to influence tumor progression (5, 6, 8, 24). Mechanisms known to be involved in enhanced Treg-mediated suppression seen in cancer patients include the involvement of immunosuppressive cytokines, IL-10 and TGF-β, the production and secretion of perforin and granzyme B as well as expression of Fas/FasL on Treg (8, 25). Another potential mechanism of suppression involves ectonucleotidase-mediated production of adenosine, which has long been known as one of the most suppressive factors for immune cells (16-20, 26, 27). While overexpression of ectonucleotidases in nTreg has been recently described in NC and patients with multiple sclerosis (15), ours is the first study describing the involvement of ectonucleotidases in Treg mediated suppression in cancer patients.
Several recent studies have emphasized the importance of the adenosinergic pathway in the process of tumor escape (19, 23, 28). While ATP is known to inhibit tumor cell growth, as shown for pancreatic, colorectal, prostate and esophagal cancers (29-32), ATP hydrolysis by ectonucleotidases, CD39 and CD73, yielding adenosine facilitates tumor cell proliferation and invasion and inhibits anti-tumor functions of cytolytic lymphocytes, macrophages and natural killer cells as well as accumulations of neutrophils (33-36). Adenosine also promotes neoangiogenesis by stimulating the proliferation of endothelial cells (37, 38) and vascular endothelial growth factors (VEGF) expression (39, 40). Further, the synthesis of pro-inflammatory cytokines, IL-2 and TNF-α, and adhesion of immune cells to the endothelium are inhibited by adenosine (41-43). In CD39 deficient mice, a significant inhibition of tumor angiogenesis, and of endothelial and inflammatory cell migration into tumor tissues and pulmonary metastases have been observed relative to WT mice (22). These in vivo data emphasize the importance of extracellular nucleotidases in modulating various stages of the tumor pathogenesis.
Various tumor types have been shown to express ectonucleotidases on their cell surface and produce adenosine (44-46). It has been reported that appreciable amounts of adenosine are present in the interstitial fluid/tumor microenvironment of solid tumors at concentrations sufficient to inhibit cell-mediated immune responses to tumor cells (47). Interestingly, both tumor cells and Treg appear to employ the adenosinergic pathway for down-regulating immune responses. The expression of CD39 and CD73 is upregulated on Treg present in the peripheral blood and tumor tissues of patients with HNSCC, which is in concert with an increased activity of these enzymes in Treg. Furthermore, CD4+CD39+ Treg accumulate in the tumor microenvironment, which is characterized by elevated levels of ATP due to the rapid proliferation and death of tumor cells. In this microenvironment CD4+CD39+CD73+ Treg are able to generate high levels of immunsuppressive adenosine. Also, extracellular adenosine enhances the generation of Treg as shown by us (unpublished data) and others (48). Adenosine mediates immunosuppression by binding to A2a R expressed on the surface of effector T cells (19, 20). A2aR-deficient mice show enhanced anti-tumor immune responses mediated by T cells, and a significant reduction in tumor growth compared to wild-type animals (23). In our study, blocking of these receptors on the surface of effector T cells decreased suppressor functions of Treg, confirming that the suppressive effects of Treg are mediated via A2aR signaling and, subsequently by an increase in the level of intracytoplasmatic cAMP. However, it remains unclear whether A2aR-mediated immune suppression has clinical significance or is implicated in cancer pathogenesis.
Experiments in murine models and our data strongly suggest that cancer progression of human cancer involves the up-regulation of the Treg-associated adenosinergic pathway. This study demonstrates for the first time a significant correlation between CD39 expression on Treg and the disease stage in HNSCC. Increased CD39 expression (percent positive cells and MFI) in T cells of patients with cancer is likely related to accumulation of Treg in the tumor and peripheral circulation as previously reported by us and others (6-8). This Treg accumulation might be related to inflammatory infiltrates and pro-inflammatory cytokines present in the tumor microenvironment, including that of HNSCC (49). The characteristics of the tumor microenvironment, specifically COX-2 and PGE2 expression, contribute to up-regulation of CD39 in Treg as indicated by our preliminary results (M. Mandapathil, unpublished data). While observed in a relatively small patient cohort, a differential ectonucleotidase expression on Treg of HNSCC patients with various disease stages may prove to be a significant biomarker of disease prognosis in the future.
A significantly increased ectonucleotidase expression and activity were observed in Treg of HNSCC patients who received adjuvant radiochemotherapy compared to those treated with surgery alone confirming previously published data by us in a cohort of NED HNSCC patients treated with radiochemotherapy (8). Both, radiation and chemotherapy lead to chronic tissue inflammation and oxidative stress. Infiltration of Treg and their accumulation in inflamed/damaged tissues likely represents a normal physiologic response. Therefore, it is not surprising that radiochemotherapy can induce accumulations of CD39+ Treg and enhance/maintain their enzymatic functions. During inflammation, ATP released from necrotic tumor cells as well as various inflammatory cell types, including mast cells, lymphocytes and macrophages is rapidly degraded to adenosine. Increased CD39 expression on inflammatory cells in chronic inflammation and in neoplastic formations has been previously reported (50) and might be a compensatory response to inflammation, pro-oxidative states or radiochemotherapy of Treg in cancer patients. Future studies are needed to determine whether CD39 and CD73 expression is regulated by the tissue microenvironment, e.g., hyproxia, and whether it synergizes with cAMP-induced signaling.
In summary, this study evaluates for the first time the involvement of adenosine in Treg-mediated immunosuppression in patients with HNSCC, which can be blocked by using A2aR antagonists and CD39 inhibitors. This knowledge could be important for the development of novel strategies aimed at enhancing the effectiveness of immune-based therapies for solid tumors. Potentially, application of A2aR antagonists in immune-competent cells and preventing CD39 activity on Treg and tumor cells, thus decreasing adenosine levels, might prove to be effective in enhancing anti-tumor immune responses.
Supplementary Material
Acknowledgments
Research Support: Research described in this article was supported in part by the NIH grants PO1 CA109688 (TLW) and DOD award BCO51720 (EG). Additional support was provided from Harry Lloyd Charitable Trust and the Hillman Foundation (EG). Dr. M. Szajnik is a postdoctoral fellow supported by the NHLBI contract HB-37-165 (TLW). Dr. M. Mandapathil is supported by Philip Morris International and IFORES Program.
Footnotes
Magis Mandapathil, Benedict Hilldorfer, Miroslaw J. Szczepanski, Malgorzata Czystowska, Marta Szajnik, Jin Ren, Stephan Lang, Edwin K. Jackson, Elieser Gorelik, Theresa L. Whiteside. Generation and accumulation of immunosuppressive adenosine by human CD4+CD25highFOXP3+ regulatory T cells (Treg). Article under review.
Statement of Translational Relevance: The data in this manuscript highlight the clinical importance of ectonucleotidase activity associated with regulatory T cells (Treg) in the head and neck squamous cell carcinoma (HNSCC). Treg in these patients have increased ectonucleotidase expression (CD39) and produce higher levels of extracellular adenosine, which mediates immunosuppression via A2aR expressed on effector T cells. We show that ATP hydrolysis, adenosine production and suppression of effector T cells by the patients' Treg positively correlate with high CD39 expression on Treg as well as disease activity. While the clinical significance of the CD39 overexpression in HNSCC patients remains to be confirmed, our data suggest that targeting of the adenosinergic pathway could be a therapeutic option for these patients.
References
- 1.Parkin DM, Bray F, Ferlay J, Pisani P. Global cancer statistics, 2002. CA Cancer J Clin. 2005;55:74–108. doi: 10.3322/canjclin.55.2.74. [DOI] [PubMed] [Google Scholar]
- 2.Fremgen AM, Bland KI, McGinnis LS, Jr, et al. Clinical highlights from the National Cancer Data Base, 1999. CA Cancer J Clin. 1999;49:145–58. doi: 10.3322/canjclin.49.3.145. [DOI] [PubMed] [Google Scholar]
- 3.Forastiere A, Koch W, Trotti A, Sidransky D. Head and neck cancer. N Engl J Med. 2001;345:1890–900. doi: 10.1056/NEJMra001375. [DOI] [PubMed] [Google Scholar]
- 4.Benchetrit F, Gazagne A, Adotevi O, et al. Cytotoxic T lymphocytes: role in immunosurveillance and in immunotherapy. Bull Cancer. 2003;90:677–85. [PubMed] [Google Scholar]
- 5.Toes RE, Ossendorp F, Offringa R, Melief CJ. CD4 T cells and their role in antitumor immune response. J Exp Med. 1999;189:753–6. doi: 10.1084/jem.189.5.753. [DOI] [PMC free article] [PubMed] [Google Scholar]
- 6.Liu L, Wu G, Yao JX, Ding Q, Huang SA. CD4+CD25high regulatory cells in peripheral blood of cancer patients. Neuro Endocrinol Lett. 2008;29:240–5. [PubMed] [Google Scholar]
- 7.Wolf AM, Wolf D, Steurer M, et al. Increase of regulatory T cells in the peripheral blood of cancer patients. Clin Cancer Res. 2003;9:606–12. [PubMed] [Google Scholar]
- 8.Strauss L, Bergmann C, Gooding W, Johnson JT, Whiteside TL. The frequency and suppressor function of CD4+CD25highFoxp3+ T cells in the circulation of patients with squamous cell carcinoma of the head and neck. Clinical Cancer Res. 2007;13:6301–11. doi: 10.1158/1078-0432.CCR-07-1403. [DOI] [PubMed] [Google Scholar]
- 9.Jonuleit H, Schmitt E, Stassen M, Tuettenberg A, Knop J, Enk AH. Identification and functional characterization of human CD4(+)CD25(+) T cells with regulatory properties isolated from peripheral blood. J Exp Med. 2001;193:1285–94. doi: 10.1084/jem.193.11.1285. [DOI] [PMC free article] [PubMed] [Google Scholar]
- 10.Dieckmann D, Plottner H, Berchtold S, Berger T, Schuler G. Ex vivo isolation and characterization of CD4(+)CD25(+) T cells with regulatory properties from human blood. J Exp Med. 2001;193:1303–10. doi: 10.1084/jem.193.11.1303. [DOI] [PMC free article] [PubMed] [Google Scholar]
- 11.Groux H, O'Garra A, Bigler M, et al. A CD4+ T-cell subset inhibits antigen-specific T-cell responses and prevents colitis. Nature. 1997;389:737–42. doi: 10.1038/39614. [DOI] [PubMed] [Google Scholar]
- 12.Roncarolo MG, Bacchetta R, Bordignon C, Narula S, Levings MK. Type 1 T regulatory cells. Immunol Rev. 2001;182:68–79. doi: 10.1034/j.1600-065x.2001.1820105.x. [DOI] [PubMed] [Google Scholar]
- 13.Wada J, Yamasaki A, Nagai S, et al. Regulatory T-cells are possible effect prediction markers of immunotherapy for cancer patients. Anticancer Res. 2008;28:2401–8. [PubMed] [Google Scholar]
- 14.Deaglio S, Dwyer KM, Gao W, et al. Adenosine generation catalyzed by CD39 and CD73 expressed on regulatory T cells mediates immune suppression. J Exp Med. 2007;204:1257–65. doi: 10.1084/jem.20062512. [DOI] [PMC free article] [PubMed] [Google Scholar]
- 15.Borsellino G, Kleinewietfeld M, Di Mitri D, et al. Expression of ectonucleotidase CD39 by Foxp3+ Treg cells: hydrolysis of extracellular ATP and immune suppression. Blood. 2007;110:1225–32. doi: 10.1182/blood-2006-12-064527. [DOI] [PubMed] [Google Scholar]
- 16.Kobie JJ, Shah PR, Yang L, Rebhahn JA, Fowell DJ, Mosmann TR. T regulatory and primed uncommitted CD4 T cells express CD73, which suppresses effector CD4 T cells by converting 5′-adenosine monophosphate to adenosine. J Immunol. 2006;177:6780–86. doi: 10.4049/jimmunol.177.10.6780. [DOI] [PubMed] [Google Scholar]
- 17.Ohta A, Sitkovsky M. Role of G-protein-coupled adenosine receptors in downregulation of inflammation and protection from tissue damage. Nature. 2001;414:916–20. doi: 10.1038/414916a. [DOI] [PubMed] [Google Scholar]
- 18.Panther ES, Corinti M, Idzko YH. Adenosine affects expression of membrane molecules, cytokine and chemokine release, and the T-cell stimulatory capacity of human dendritic cells. Blood. 2003;101:3985–90. doi: 10.1182/blood-2002-07-2113. [DOI] [PubMed] [Google Scholar]
- 19.Sitkovsky MV, Ohta A. The ‘danger’ sensors that STOP the immune response: the A2 adenosine receptors? Trends Immunol. 2005;26:299–04. doi: 10.1016/j.it.2005.04.004. [DOI] [PubMed] [Google Scholar]
- 20.Lokshin A, Raskovalova T, Huang X, Zacharia LC, Jackson EK, Gorelik E. Adenosine-mediated inhibition of the cytotoxic activity and cytokine production by activated natural killer cells. Cancer Res. 2006;66:7758–65. doi: 10.1158/0008-5472.CAN-06-0478. [DOI] [PubMed] [Google Scholar]
- 21.Strauss L, Whiteside TL, Knights A, Bergmann C, Knuth A, Zippelius A. Selective survival of naturally occurring human CD4+CD25+Foxp3+ regulatory T cells cultured with rapamycin. J Immunol. 2007;178:320–29. doi: 10.4049/jimmunol.178.1.320. [DOI] [PubMed] [Google Scholar]
- 22.Jackson SW, Hoshi T, Wu Y, et al. Disordered purinergic signaling inhibits pathological angiogenesis in CD39/Entpd1-null mice. Am J Pathol. 2007;171:1395–04. doi: 10.2353/ajpath.2007.070190. [DOI] [PMC free article] [PubMed] [Google Scholar]
- 23.Ohta AE, Gorelik SJ, Prasad F. A2A adenosine receptor protects tumors from antitumor T cells. Proc Natl Acad Sci USA. 2006;103:13132–37. doi: 10.1073/pnas.0605251103. [DOI] [PMC free article] [PubMed] [Google Scholar]
- 24.Koyama K, Kagamu H, Miura S, et al. Reciprocal CD4+ T-cell balance of effector CD62Llow CD4+ and CD62LhighCD25+ CD4+ regulatory T cells in small cell lung cancer reflects disease stage. Clin Cancer Res. 2008;14:6770–9. doi: 10.1158/1078-0432.CCR-08-1156. [DOI] [PubMed] [Google Scholar]
- 25.Cao X, Cai SF, Fehniger TA, et al. Granzyme B and perforine are important for regulatory T cell-mediated suppression of tumor clearance. Immunity. 2007;27:635–46. doi: 10.1016/j.immuni.2007.08.014. [DOI] [PubMed] [Google Scholar]
- 26.Sitkovsky MV, Kjaergaard J, Lukashev D, Ohta A. Hypoxia-adenosinergic immunosuppression: tumor protection by T regulatory cells and cancerous tissue hypoxia. Clin Cancer Res. 2008;14:5947–52. doi: 10.1158/1078-0432.CCR-08-0229. [DOI] [PubMed] [Google Scholar]
- 27.Hoskin DW, Mader JS, Furlong SJ, Conrad DM, Blay J. Inhibition of T cell and natural killer cell function by adenosine and its contribution to immune evasion by tumor cells. Int J Oncol. 2008;32:527–35. [PubMed] [Google Scholar]
- 28.Buffon A, Wink MR, Ribeiro BV. NTPDase and 5′ ecto-nucleotidase expression profiles and the pattern of extracellular ATP metabolism in the Walker 256 tumor. Biochim Biophys Acta. 2007;1770:1259–65. doi: 10.1016/j.bbagen.2007.05.004. [DOI] [PubMed] [Google Scholar]
- 29.Yamada T, Okajima F, Akbar M. Cell cycle arrest and the induction of apoptosis in pancreatic cancer cells exposed to adenosine triphosphate in vitro. Oncol Rep. 2002;9:113–7. [PubMed] [Google Scholar]
- 30.Höpfner M, Maaser K, Barthel B. Growth inhibition and apoptosis induced by P2Y2 receptors in human colorectal carcinoma cells: involvement of intracellular calcium and cyclic adenosine monophosphate. Int J Colorectal Dis. 2001;16:154–66. doi: 10.1007/s003840100302. [DOI] [PubMed] [Google Scholar]
- 31.Janssens R, Boeynaems JM. Effects of extracellular nucleotides and nucleosides on prostate carcinoma cells. Br J Pharmacol. 2001;132:536–46. doi: 10.1038/sj.bjp.0703833. [DOI] [PMC free article] [PubMed] [Google Scholar]
- 32.Wang MX, Ren LM, Shan BE. Inhibitory effects of extracellular adenosine triphosphate on growth of esophageal carcinoma cells. World J Gastroenterol. 2005;11:5915–9. doi: 10.3748/wjg.v11.i38.5915. [DOI] [PMC free article] [PubMed] [Google Scholar]
- 33.Huang S, Apasov S, Koshiba M, Sitkovsky M. Role of A2a extracellular adenosine receptor-mediated signaling in adenosine-mediated inhibition of T-cell activation and expansion. Blood. 1997;90:1600–10. [PubMed] [Google Scholar]
- 34.Bouma MG, Jeunhomme TM, Boyle DL, et al. Adenosine inhibits neutrophil degranulation in activated human whole blood: involvement of adenosine A2 and A3 receptors. J Immunol. 1997;158:5400–8. [PubMed] [Google Scholar]
- 35.Cronstein BN, Kubersky SM, Weissmann G, Hirschhorn R. Engagement of adenosine receptors inhibits hydrogen peroxide (H2O2) release by activated human neutrophiles. Clin Immunol Immunopathol. 1987;42:76–85. doi: 10.1016/0090-1229(87)90174-7. [DOI] [PubMed] [Google Scholar]
- 36.MacKenzie WM, Hoskin DW, Blay J. Adenosine inhibits the adhesion of anti-CD3-activated killer lymphocytes to adenocarcinoma cells through an A3 receptor. Cancer Res. 1994;54:3521–6. [PubMed] [Google Scholar]
- 37.Barcz E, Sommer E, Sokolnicka I, et al. The influence of theobromine on angiogenic activity and proangiogenic cytokines production of human ovarian cancer cells. Oncol Rep. 1998;5:517–20. doi: 10.3892/or.5.2.517. [DOI] [PubMed] [Google Scholar]
- 38.Ethier MF, Chander V, Dobson JG., Jr Adenosine stimulates proliferation of human endothelial cells in culture. Am J Physiol. 1993;265:H131–8. doi: 10.1152/ajpheart.1993.265.1.H131. [DOI] [PubMed] [Google Scholar]
- 39.Pueyo ME, Chen Y, D'Angelo G, Michel JB. Regulation of vascular endothelial growth factor expression by cAMP in rat aortic smooth muscle cells. Exp Cell Res. 1998;238:354–8. doi: 10.1006/excr.1997.3864. [DOI] [PubMed] [Google Scholar]
- 40.Grant MB, Tarnuzzer RW, Caballero S. Adenosine receptor activation induces vascular endothelial growth factor in human retinal endothelial cells. Circ Res. 1999;85:699–06. doi: 10.1161/01.res.85.8.699. [DOI] [PubMed] [Google Scholar]
- 41.Eigler A, Greten TF, Sinha B, Haslberger C, Sullivan GW, Endres S. Endogenous adenosine curtails lipopolysaccharide-stimulated tumour necrosis factor synthesis. Scand J Immunol. 1997;45:132–9. doi: 10.1046/j.1365-3083.1997.d01-377.x. [DOI] [PubMed] [Google Scholar]
- 42.Sajjadi FG, Takabayashi K, Foster AC, Domingo RC, Firestein GS. Inhibition of TNF-alpha expression by adenosine: role of A3 adenosine receptors. J Immunol. 1996;156:3435–42. [PubMed] [Google Scholar]
- 43.Szabó C, Scott GS, Virág L, et al. Suppression of macrophage inflammatory protein (MIP)-1alpha production and collagen-induced arthritis by adenosine receptor agonists. Br J Pharmacol. 1998;125:379–87. doi: 10.1038/sj.bjp.0702040. [DOI] [PMC free article] [PubMed] [Google Scholar]
- 44.Kittel A, Garrido M, Varga G. Localization of NTPDase1/CD39 in normal and transformed human pancreas. J Histochem Cytochem. 2002;50:549–56. doi: 10.1177/002215540205000412. [DOI] [PubMed] [Google Scholar]
- 45.Dzhandzhugazyan KN, Kirkin AF, thor Straten P, Zeuthen J. Ecto-ATP diphosphohydrolase /CD39 is overexpressed in differentiated human melanomas. FEBS Lett. 1998;430:227–30. doi: 10.1016/s0014-5793(98)00603-6. [DOI] [PubMed] [Google Scholar]
- 46.Spychala J, Lazarowski E, Ostapkowicz A, Ayscue LH, Jin A, Mitchell BS. Role of estrogen receptor in the regulation of ecto-5′-nucleotidase and adenosine in breast cancer. Clin Cancer Res. 2004;10:708–17. doi: 10.1158/1078-0432.ccr-0811-03. [DOI] [PubMed] [Google Scholar]
- 47.Blay J, White TD, Hoskin DW. The extracellular fluid of solid carcinomas contains immunosuppressive concentrations of adenosine. Cancer Res. 1997;57:2602–5. [PubMed] [Google Scholar]
- 48.Zarek PE, Huang CT, Lutz ER, et al. A2A receptor signaling promotes peripheral tolerance by inducing T-cell anergy and the generation of adaptive regulatory T cells. Blood. 2008;111:251–9. doi: 10.1182/blood-2007-03-081646. [DOI] [PMC free article] [PubMed] [Google Scholar]
- 49.Whiteside TL. Immunobiology of head and neck cancer. Cancer Metastasis Rev. 2005;24:95–105. doi: 10.1007/s10555-005-5050-6. [DOI] [PubMed] [Google Scholar]
- 50.Duarte MM, Loro VL, Rocha JB, et al. Enzymes that hydrolyze adenine nucleotides of patients with hypercholesterolemia and inflammatory processes. FEBS J. 2007;274:2707–14. doi: 10.1111/j.1742-4658.2007.05805.x. [DOI] [PubMed] [Google Scholar]
Associated Data
This section collects any data citations, data availability statements, or supplementary materials included in this article.