

Abstract
Objective
Functional MRI was used to determine differences in patterns of cortical activation between children who suffered perinatal left middle cerebral artery (MCA) stroke and healthy children performing a silent verb generation task.
Methods
Ten children with prior perinatal left MCA stroke (age 6–16 years) and ten healthy age matched controls completed an executive language activation task. FMRI scans were acquired on a 3T scanner using T2* weighted gradient echo, echo-planar imaging (EPI) sequence. Random Effects Analysis and Independent Component Analysis (ICA) were used to compute activation maps.
Results
Both analysis methods demonstrated alternative activation of cortical areas in children with perinatal stroke. Following perinatal stroke, typical left dominant productive language areas in the inferior frontal gyrus were displaced to anatomical identical areas in the right hemisphere (p=0.001). In addition, stroke patients showed more bilateral activation in superior temporal and anterior cingulate gyri and increased activation in primary visual cortex when compared to healthy controls. There was no relation between lesion size and the degree of right hemisphere activation. ICA analysis showed that the healthy controls had a negative correlation with the time course in the right inferior frontal gyrus in the same region that was activated in stroke subjects.
Interpretation
This functional MRI study in children revealed novel patterns of cortical language reorganization following perinatal stroke. The addition of ICA is complementary to Random Effects analysis, allowing for the exploration of potential subtle differences in pathways in functional MRI data obtained from both healthy and pathological groups.
Keywords: fMRI, language, stroke, independent component analysis, random effects analysis, childhood
Introduction
Recent functional MRI (fMRI) studies have focused on language processing in childhood.1–5 These studies have shown, consistent with earlier studies using invasive techniques such as the intracarotid amytal test and intraoperative cortical mapping, that although both hemispheres are involved in most types of language tasks, brain activation is dominant in the left hemisphere for semantic language processing.6, 7 Subsequent to corroborating the ‘classical language model’ of left hemispheric dominance in language processing, this imaging technique has been used to further explore developmental aspects of the cortical organization of language functions. There is ample evidence that left hemispheric dominance for language is present very early in life 8 and that it becomes more left lateralized throughout childhood 4, 9. Combining neuroimaging results from normal children with data following unilateral cerebral damage offers further insight into the neuroplasticity and reorganization of eloquent cortex.
Perinatal stroke, an event that occurs most often in the territory of the brain supplied by the left middle cerebral artery (MCA), can devastate classical language areas in the left frontal and temporal regions within the MCA distribution. In children who suffer from perinatal stroke, the remarkable plasticity of the developing brain in both cognitive and motor functioning has been well documented.10–12 The overall cognitive and motor outcomes are better in this group of patients compared to those with similar insults occurring later in life11, 13 as documented by studies investigating the impact of early brain lesions on cognitive functioning14, 15. These findings support the notion that early rather than late brain injury leads to a more complete functional recovery associated with more pronounced cortical plasticity.
Recently, scientists have embraced non-invasive neuroimaging methods such as PET and fMRI to further investigate the neuroplasticity-related recovery following cerebral injury. Studies in adults who suffered strokes16–21 have attempted to determine whether recovery from aphasia is due to reorganization within the affected hemisphere or if language processing is more likely subserved by corresponding cortical areas in the contralateral hemisphere.22 Both patterns have been demonstrated, suggesting that multiple factors may influence post-stroke reorganization and recovery.
Functional neuroimaging studies have shown several different cortical reorganization patterns corresponding to language function following early brain injury. Studies in adults using the intracarotid Amobarbital procedure 23, 24 and PET 25, 26 have revealed a right hemispheric shift of language dominance when the left hemisphere language areas were affected by an early injury. In contrast, other studies in children have found that areas of activation may be displaced within the affected left hemisphere27, 28. Recent functional MRI studies have produced similarly inconsistent results. Some have shown that early subcortical damage resulted in dramatic right hemisphere reorganization of language functions29–31, whereas others have found less striking contralateral reorganization following lesions with a later onset.32, 33 There are only few case reports describing a shift in language dominance to the right hemisphere following perinatal stroke 34, including one from our group.35
To date, the mechanisms of redistribution of functional language areas following early left cortical injury remain unclear. The wide variability in the results of studies focusing on post-stroke language recovery in patients with early injury is likely related to differences in inclusion/exclusion criteria, timing of evaluation after the insult and different techniques and data analysis methods. Following stroke in early life, it remains unknown exactly how the size, location, age of onset, and type of lesion (e.g. cortical/subcortical) as well as other complicating factors (e.g., epilepsy) affect cortical regions and their connections responsible for language functions.
In this study, we aimed to test the hypothesis that early injury to left-hemisphere language areas due to perinatal stroke will lead to a shift of cortical language representation to the right hemisphere when compared to healthy children. To test this hypothesis, this study investigated the pattern of brain activation associated with executive language processing in a relatively homogeneous group of children with a history of perinatal, ischemic, left MCA stroke using functional MRI and a silent verb generation task. The secondary hypothesis was that the lesion size would influence cortical reorganization. This hypothesis was tested by comparing the size of cerebral loss and the cortical activation pattern as well as hemispheric dominance in this group of children by using voxel by voxel regression model. In addition, we compared cortical components for semantic language processing obtained by independent component analysis in order to investigate whether the significantly activated cortical areas found with GLM analysis correspond to temporally related components.
Subjects & Methods
Subjects
Subjects in the stroke group were recruited through the Division of Neurology at Cincinnati Children’s Hospital Medical Center (CCHMC) in Cincinnati, OH, USA. All children were native English speakers and were included in the study based on history, clinical examination and radiological evidence of left MCA chronic ischemic stroke. The MRI scans required for inclusion in the study were evaluated by a board certified neuro-radiologist. The medical charts of the patients were reviewed for secondary diagnoses such as epilepsy. Children with sickle cell disease and vasculopathies at the time of imaging were excluded. The control group consisted of an equal number of healthy children who were matched for age and handedness to the patient group. These subjects were randomly drawn from a large database of healthy pediatric subjects who were recruited for a study of language development in healthy children.2, 5 Controls had no history of neurological or psychiatric disorder, they had normal physical and neurological exams and were not taking chronic medication. Written informed consent was obtained from the parents or legal guardians, and the subjects gave either verbal or written assent. The research protocol was approved by the CCHMC Institutional Review Board.
Intelligence Testing
The Wechsler Intelligence Scale for Children, Third Edition (WISC-III)36 was administered to characterize the subjects, as well as to detect possible relations between IQ, extent of lesion, and lateralization of language in the stroke subjects. Subject information is summarized in Table 1.
Table 1.
| Subject | Age | Sex | Extent of lesion (percentage left hemisphere loss) | Handedness | Focal onset epilepsy | VIQ | PIQ | FSIQ | LI Frontal | LI Posterior |
|---|---|---|---|---|---|---|---|---|---|---|
| 1 | 6 | F | 8% | L | − | 95 | 90 | 92 | −0.21 | −0.23 |
|
| ||||||||||
| 2 | 7 | M | 9% | L | − | 101 | 82 | 92 | 0.26 | 0.21 |
|
| ||||||||||
| 3 | 9 | F | 29% | L | + | 65 | 60 | 60 | −0.23 | −0.37 |
|
| ||||||||||
| 4 | 9 | F | 19% | L | − | 73 | 70 | 69 | 0.37 | −0.43 |
|
| ||||||||||
| 5 | 11 | F | 38% | L | + | 71 | 63 | 64 | −0.36 | −0.28 |
|
| ||||||||||
| 6 | 12 | F | 11% | R | + | 76 | 99 | 86 | −0.91 | −0.09 |
|
| ||||||||||
| 7 | 13 | M | 14% | L | − | 105 | 100 | 103 | −0.41 | 0.28 |
|
| ||||||||||
| 8 | 13 | M | 17% | L | + | 82 | 62 | 70 | −0.67 | −0.58 |
|
| ||||||||||
| 9 | 15 | M | 41% | L | + | 80 | 72 | 74 | −0.71 | −0.92 |
|
| ||||||||||
| 10 | 16 | M | 7% | R | + | 91 | 82 | 86 | −0.26 | 0.04 |
|
| ||||||||||
| Perinatal Stroke group: | Healthy control group | |||||||||
| No. of subjects: 10 | No. of subjects = 10 | |||||||||
| Age: Mean = 11.1 SD = 3.3 | Age: Mean = 11.6 SD = 3.2 | |||||||||
| VIQ: Mean = 84 SD = 13.4 | VIQ: Mean = 108 SD = 14.2 | |||||||||
| FSIQ: Mean = 80 SD = 14.1 | FSIQ: Mean = 108 SD = 11.7 | |||||||||
Language Activation Tasks
The details of verb generation task are provided in our previous publications 2, 4, 5. Briefly, a 30 seconds on-off block-design fMRI paradigm was used. The Verb Generation (VG) task is based on a task initially developed for PET imaging 37 that involves the auditory presentation of a series of concrete nouns. The subject hears a noun every five seconds and is required to silently generate as many verbs associated with that noun as possible during the 5 second interval. For example, if the noun “ball” is presented, the subject might generate the verbs “throw,” “kick,” and “hit.” The subject is instructed to think the verbs silently, without saying them, in order to minimize the motion artifact associated with speech. We elected to use audio presentation because we have found that it produces stronger lateralization than visual presentation of noun prompts 2.
Bilateral finger tapping is used as the control task for the VG task. Like VG, the sensory-motor response to bilateral finger tapping has been extensively investigated and patterns of activation associated with this task are well understood. In order to parallel the initiation of response when a noun is presented in the VG task and to provide an control for auditory stimulation, the subject is asked to tap his or her fingers against the thumb sequentially for one cycle each time a target tone is heard. The target tone is centered on 400Hz with 25% frequency modulation and is presented at 5 seconds intervals during the 30 second control blocks to parallel the timing of the nouns presented during the VG blocks.
This control task accomplished three objectives: 1) to provide control for cortical activation associated with sublexical auditory processing; 2) to prevent the subject from continuing to generate verbs during the control period; 3) and to provide a reference area of activation within the motor strip as an independent means of validating subject compliance.
Children were trained to complete the VG task prior to entering the scanner. Our experience with performing fMRI in pediatric subjects has led us to develop an effective desensitization and training regimen that improves the rate of success for fMRI in children.38 An alternative set of verbs is used for the training session as not to influence the performance. Within scanner compliance to the task has been subsequently assessed by administering a post-scan quiz of recall of nouns given during the active part of the task to selected healthy children (n=51) enrolled in a related study. In this subsequent study, correct recall was well above chance, ranging from 82% in young children (7–8 years old) to 88% in older children (10–18 years old) and the difference in noun recall between these groups was not significant. Although this is not a direct real-time measure of performance, these measures suggest that our subjects should be able to adequately perform the VG task. The stroke subjects almost all had their MRI performed prior to the application of this recall measure in our center. Therefore, these results were not reproduced in the stroke group.
FMRI Data Acquisition
The details of the MR data acquisition and analysis were previously reported 4, 5. Imaging was carried out on a 3T Bruker Biospec MRI scanner. EPI-fMRI scan parameters were: TR = 3000 ms, TE = 38 ms, BW = 125 kHz, matrix = 64 × 64, FOV = 25.6 × 25.6 cm, slice thickness = 5 mm, 24 slices acquired covering the whole brain. 110 time frames were acquired, for a total scan time of 5 minutes and 30 seconds; the first 10 frames were discarded to allow the spins to reach relaxation equilibrium. In addition to the fMRI data, a multi-echo reference scan was collected for geometric distortion correction.39 A high-resolution T1-weighted 3-D anatomical scan was obtained using a modified driven equilibrium Fourier transform (MDEFT) protocol: TR = 15 ms, TI = 550 ms, TE = 4.3 ms, FOV = 25.6×19.2×16.2, flip angle = 20° to provide images for anatomical localization of the activation maps.40, 41 This acquisition yielded spatial resolution with sufficient signal to noise ratio and contrast between grey and white matter for manual and semi-automated segmentation of regional brain volumes.42
fMRI data analysis
The fMRI image processing was performed with CCHIPS (Cincinnati Children’s Hospital Image Processing System) software that runs in the IDL software environment (IDL 6.1; Research Systems Inc, Boulder, CO). CCHIPS generates statistical parametric maps from fMRI data with options for spatial or temporal filtering for mapping data onto stereotactic coordinates, and for generating composite activation maps across multiple subjects. A Hamming filter was applied to raw EPI data prior to reconstruction to reduce the truncation artifacts at the edges of k-space and to reduce high-frequency noise in the images. Geometric distortion of the EPI images was corrected via the multi-echo reference method.39 The fMRI data were then co-registered to further reduce the effects of motion artifact using a previously developed pyramid co-registration algorithm.43 Data with excessive motion artifact were discarded, using the criterion of median voxel displacement 3 mm. This cutoff was selected to allow for inclusion of as many data sets as possible, while excluding poor data that were unusable even after motion correction.
The data were transformed into Talairach space to allow for group comparisons and composite mapping of activation of the stroke and control groups.44 In the stroke group, abnormal brain anatomy complicated the identification of the anterior and posterior commissures used as anatomical landmarks for the Talairach coordinate frame. However, in each case estimates of the anterior and posterior commissure locations were possible and affine transformation was applied to the images resulting in transformed images in the Talairach framework. Transformed images were inspected and did not appear to be distorted in the vicinity of the lesions.
The fMRI data was processed using the General Linear Model.45 Z-score maps were computed and used in further estimations of the lateralization indices (LIs) as described below. A voxel by voxel group comparison was performed using random effect analysis45 in order to find regions of significant group activation; composite group activation maps in the Talairach frame were spatially filtered using a Gaussian kernel of 4 mm. Specificity was further improved using the clustering method.46 A nominal z-score of 5, combined with a cluster size of 5, resulted in a corrected p-value of < 0.001 per cluster as determined via a Monte Carlo simulation.47
Independent Component Analysis (ICA)
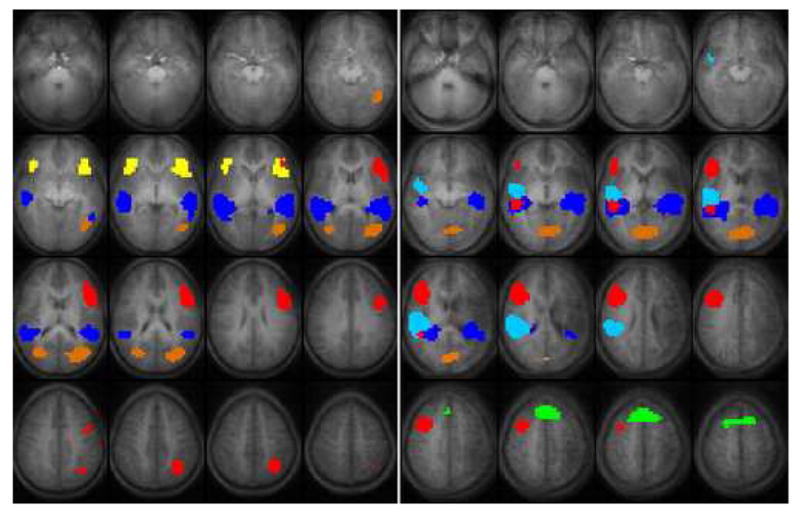
Independent Component Analysis was used to further explore subtle network elements embedded in our data.48 This method has been used previously by our group to make group statistical inferences from fMRI data.49 ICA is a data driven analysis strategy that does not rely on prior knowledge of the task performed and identifies spatially independent components that have identical time courses. The multi-step algorithms used to extract ICA maps from our fMRI data have been described in detail in our previous publications.49 Briefly, each data set is preprocessed by normalizing the voxel time courses to a percent change from the mean, and the number of time points for ICA processing is reduced via Principal Component Analysis (PCA) to 40 points in the time dimension: this has been shown empirically to be a sufficient number of retained components.50 The data from all subjects in each group then is concatenated into a single time course (10 × 40 = 400 time points). This concatenated time series is again reduced to 50 points in the time dimension via PCA. A greater number of components are kept after the second data reduction stage because not all components are expected to be present in all subjects (each subject is expected to have unique artifactual components related to motion and cardiac and respiratory effects). Allowing a greater number of components minimizes the likelihood of these artifactual components mixing into the task-related ones.49 The FastICA51 method was repeated 25 times to estimate independent components, and the components were validated via hierarchical agglomerative clustering.52 The components selected for display are the components with the greatest correlations of the associated time courses with the on–off task reference function (shifted by 3 seconds to account for the hemodynamic delay). The components displayed in Figure 4 were thresholded to Z > 4.0 (p < 0.0001, random-effects analysis, uncorrected). Applying the ICA to this data set will increase the understanding whether the components obtained by this analysis are consistent with the cortical areas found by GLM analysis. This could give further insight in how these components form a network contributing to the performed VG task.
Figure 4.
Extent of lesion
To allow for evaluation of the extent of lesion and type of reorganization of the language areas an estimation of the lesion size was calculated as follows. In the T1 weighted anatomical images, both grey and white matter was separated from CSF and surrounding tissue; this was followed by manual masking of the cerebellum, brain stem, and eyes. A ratio between the left and right hemisphere volumes was calculated. This is an acceptable method of structural data management as studies have determined that even though there may be a significant difference between the left and right hemispheric volumes, it does not exceed 1%.53 The left/right ratio was then converted to a percentage of left cerebral hemisphere volume lost due to the stroke (Table 1).
Regional Lateralization Indices
Lateralization indices (LIs) were calculated as the sum of activated pixels in the left hemisphere region of interest (ROI) minus the sum of activated pixels in the right hemisphere ROI divided by the sum of activated pixels in the left and right hemispheres [LI = (ΣL − ΣR)/(ΣL + ΣR)]. This formula yields values between −1 (only right hemispheric activation) and + 1 (only left hemispheric activation). Values between −0.1 and 0.1 are interpreted as bilateral activation.2 The regions of interest previously used in calculating the LI in the normal population 2, 4 were too small to include possible newly recruited areas in patients with stroke. In order to detect a possible ipsilateral reorganization of language areas, the size of the ROI was increased to include activation that might lie outside ROIs typically used for the VG task include the inferior frontal gyrus (IFG) and the superior and middle temporal gyri.54 Thus, two ROIs were used in our study: a “frontal” ROI was used for the anterior language areas, covering most of the lateral part of the frontal lobe (Brodmann areas 44, 45, 46, 47, and part of 6 and 9). A “posterior ROI” focused around Wernicke’s area, including the posterior superior and middle temporal gyri, perisylvian area, and supramarginal gyrus (including parts of BAs 20, 21, 37, 38, 39 and 42).
The ROIs constitute areas with approximately 800–1000 voxels in each hemisphere and the activated voxels are included without clustering. It has been shown that the LI is largely dependent on the threshold used for the calculation.55 When the threshold is set too low there is a substantial amount of ‘noise’ used in the calculation, lowering the LI’s. When thresholds are set too high, significantly activated voxels might be excluded. Hence, we chose a relative conservative p-value (single-tailed, p < 0.01) as a threshold for activation of voxels to include a sufficient number of voxels for the LI calculation in each subject. A Mann-Whitney-U test was used to compare the LI’s between both groups.
Results
Despite the good success rates obtained by our laboratory in pediatric neuro-imaging, failure rates in children are still higher than in adults due to subject motion and failure to tolerate the confined space inside the MRI scanner.38 We found these problems to be exaggerated in the stroke group recruited for this study and failure rates were higher than in the healthy control group.
Seventeen subjects in the stroke group completed the functional MRI scans but there was unacceptable motion exceeding our threshold in 5 subjects. Therefore, these 5 subjects were excluded from further analysis. One of the remaining 12 subjects was excluded from further analysis because of noncompliance with the fMRI task. One subject was excluded after further review of the history and anatomical images revealing periventricular leukomalacia without sufficient evidence of cortical involvement. Thus, the stroke group included 10 children aged 6–16 years and the control group consisted of 10 children of the same age with an equal ratio of male to female and left/right-handedness. In Table 1 the details of the stroke group are given with a summary of the control group. The individual LI scores of the stroke subjects are shown in this table, where the average IQ for the control group is reported. The IQ scores of the control group were significantly higher (p = 0.002 for VIQ and p = 0.001 for FSIQ) as calculated by a Mann-Whitney-U test.
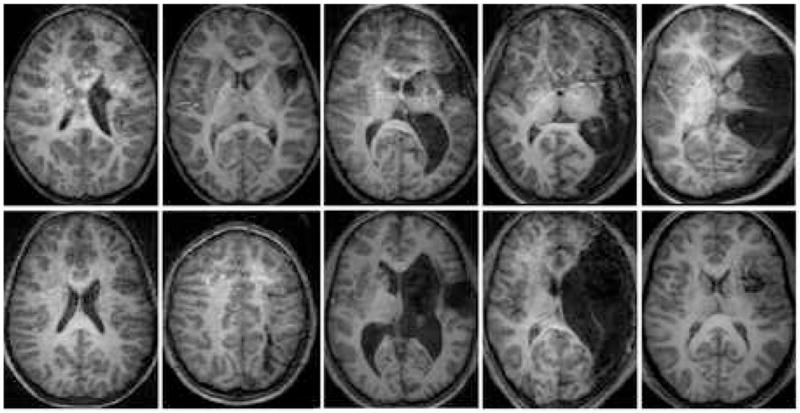
Activation maps of the subjects who completed the functional imaging were interpretable on an individual basis and composite maps in the Talairach frame were calculated for each group. Figure 1 provides an overview of the T1 weighted anatomical scans for the subjects included in the stroke group. A single slice containing the lesion of interest is selected for display in Figure 1.
Figure 1.
Cortical activation
Patterns of cortical activation in the control group were consistent with data from our previously published larger pediatric study population2. Using random effect analysis of the GLM maps, a composite activation map for the verb generation task was calculated for each group in the Talairach reference frame and displayed in Figure 2. At the threshold selected for display in Figure 2 (z = 7.5, cluster size = 5, corrected p < 0.001), the composite map for healthy children demonstrates cortical activation for this productive language task that is mostly confined to the left hemisphere in Broca’s and Wernicke’s Areas2, 5. Additional activation is seen in the anterior cingulate (left > right), left caudate and the left middle frontal gyrus.
Figure 2.
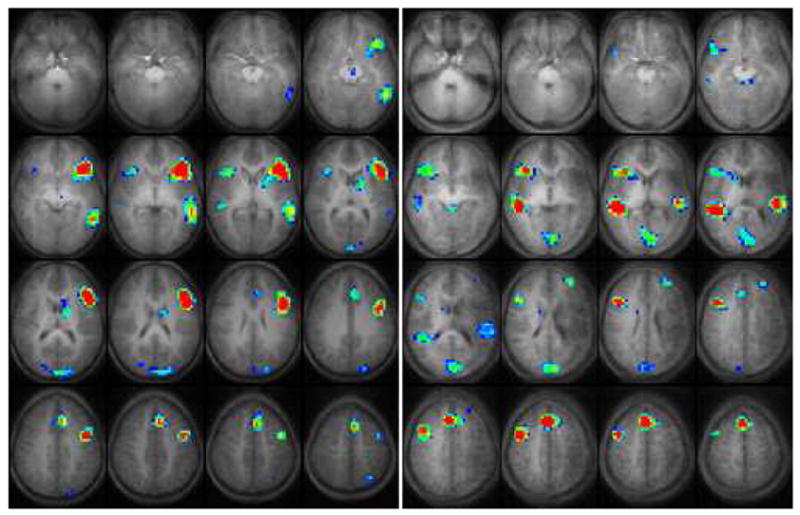
During the control task, activation was seen in the precentral, postcentral, middle frontal, supplementary motor and medial occipital gyri, and in the precuneus, anterior cingulate, and subcortical regions during the finger tapping task (not shown) in both groups.
Several differences are evident in the composite activation patterns for the stroke group compared with the healthy control group in Figure 2. In the stroke group, fMRI cortical activation is concentrated in the inferior and middle frontal gyri of the right hemisphere. These activated cortical areas are nearly a mirror image of the left frontal lobe activation for this task seen in the healthy control group. Some degree of activation was seen in the left frontal lobe either adjacent to or remote from the area affected by the stroke. We are reluctant to report exact gyral locations of left hemisphere activation for the stroke group because of the anatomical variations due to stroke. No significant difference in size and strength of activation was seen for the right hemispheric frontal activated regions in the stroke group compared with the activated regions in the left hemisphere of the control group, as measured by the number of activated voxels and respective z-scores. An important qualitative difference for these areas is that the activation seems to be more concentrated in the dorsal part of the right frontal lobe (BA 46 and 9) in the stroke group.
Differences are also apparent between the stroke and control groups in the activation pattern within the temporal lobe. This activation is primarily located in the left middle temporal gyrus in the control group, whereas this activation shows a more bilateral distribution in the stroke group. In the unaffected right hemisphere of the stroke group the activation pattern is similar to the activation seen within the left hemisphere in the control group, though it includes superior temporal gyrus and does not appear to extend as far posterior into the angular gyrus. Activation within the affected left hemisphere in the stroke group shows a different distribution than found in the healthy controls with activation in the left middle temporal gyrus and superior temporal gyrus shifted somewhat anterior and superior to the typical pattern. This shift may be due to the structural changes from the stroke with displacement of the remaining vital left hemisphere structures.
In both groups, there is significant activation in the anterior cingulate gyrus. This area of activation is larger and bilaterally distributed in the stroke group, whereas in the healthy control group it is confined to the dominant left hemisphere. Additionally, there are areas of activation that appear larger in the stroke group when compared to the healthy controls, including the activation seen in the occipital lobe (predominantly in the cuneus, and additionally small parts of the precuneus and lingual gyrus; BA 17&18). Activation was also larger in the basal ganglia (in particular caudate and putamen). The significantly activated cortical locations with the corresponding Brodmann Areas are listed in Table 2.
Table 2.
| Stroke Group | Control Group | ||||
|---|---|---|---|---|---|
| Localization of activation | Hemisphere | Brodmann Area | Volume† | Brodmann Area | Volume |
| Inferior frontal gyrus | Left | - | - | 44 | 366 |
| 45 | |||||
| 47 | |||||
|
| |||||
| Right | 44 | 207 | 45 | 40 | |
| 45 | |||||
| 47 | |||||
|
|
|||||
| Middle frontal gyrus | Left | 46‡ | 59 | 9 | 27 |
|
| |||||
| Right | 9 | 96 | - | - | |
|
|
|||||
| Medial temporal gyrus | Left | - | - | 21 | 142 |
|
| |||||
| Right | 21 | 80 | 21 | 19 | |
|
|
|||||
| Superior temporal gyrus | Left | 22‡ | 104 | - | - |
| 42 | |||||
|
| |||||
| Right | 22 | 73 | - | - | |
|
|
|||||
| Anterior Cingulate Gyrus | Left | 32 | 79 | 32 | 61 |
|
| |||||
| Right | 32 | 61 | 32 | 12 | |
|
|
|||||
| Medial Frontal Gyrus | Bilateral | 8 | 29 | 8 | 21 |
|
|
|||||
| Cuneus/Precuneus Lingual Gyrus | Bilateral | 17 | 323 | 18 | 25 |
| 18 | |||||
|
| |||||
| Caudate Nucleus Putamen | Bilateral | Left | |||
Measured as number of voxels (p < 0.001) in Figure 2
Displaced perilesional activation within left hemisphere of stroke subjects.
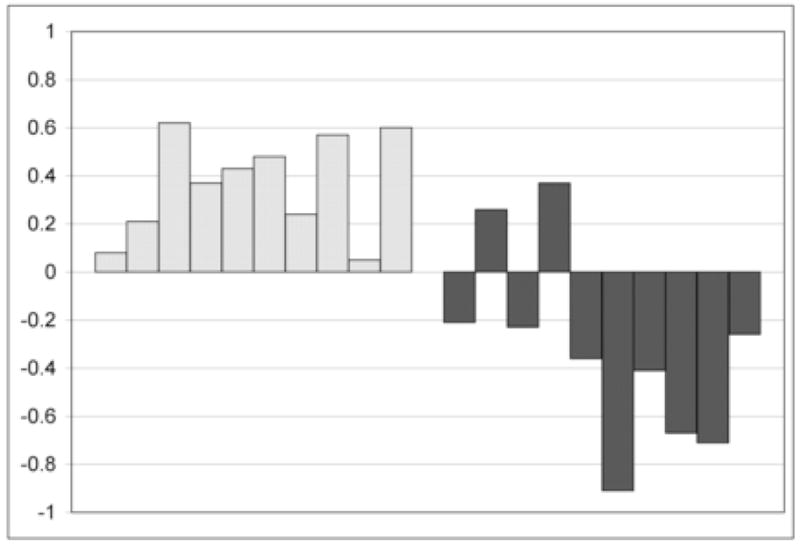
The lateralization indices for both ROI’s are listed for the stroke group in Table 1 and the distribution of the LI in the frontal ROI for both groups is shown in Figure 3. In the healthy control group, there are two subjects who have bilateral activation within this ROI and the remaining eight have language lateralized to the left hemisphere. In the stroke group, two are left hemispheric dominant within this ROI (|LI|<0.1) and eight subjects are right hemisphere dominant. This difference in language lateralization is significant for the ‘frontal’ ROI (p = 0.0014) and for the ‘posterior’ ROI data (not shown; p = 0.004).
Figure 3.
Independent Component Analysis (ICA)
Applying ICA to the fMRI data from the verb generation task gives additional insight into how different cortical regions are involved in the processing of this executive language task. This data driven analysis produces spatially independent components that share identical temporal characteristics, corresponding to the cortical responses from the auditory input and the covert production of language. GLM analysis on the other hand, produces robust activation in pixels that have time courses defined by a hemodynamic reference function, determined a priori. Because the ICA is not constrained to detect only the activation that follows the a priori time course, it is complementary to the GLM analysis56 and reveals additional differences between the study groups in regard to the underlying neuronal circuitry for semantic language processing.
The independent components for the verb generation task in both groups are displayed in Figure 4, using different colors for each component. In the healthy control group, ICA demonstrates a bilateral component in the superior and middle temporal gyri (dark blue). Additionally, this analysis shows a bilateral inferior frontal component (yellow) within the healthy control group that is separate from the lateralizing frontal component (red). The bilateral frontal component as seen with ICA is not as strongly present in the GLM analysis and is an additional finding to the lateralizing frontal (red) component. The component in the temporal lobe (dark blue) corresponds to cortical activation seen in the GLM analysis and seems to be more bilaterally distributed in the ICA. In the control group there is one other component that is novel compared to the GLM analysis (orange), this activation is seen on the parietal lobe (BA 39). Overall, this analysis generates components strongly correlating to the activation calculated by the GLM analysis in the control group showing a comparable image.
ICA shows again differences and similarities between the stroke and control group. The bilateral temporal lobe activation (superior and middle temporal gyrus) consists of two separate areas in the stroke group (light and dark blue components). The dark blue component is bilaterally distributed comparable to the dark blue component in the control group. The additional light blue area makes the total activation within the temporal lobe larger in the right hemisphere in this study group, where the ICA shows bilateral activation in the control group.
A bilateral frontal component seen in the control group (inferior and middle frontal gyrus; yellow component) is too weak in the stroke group to be displayed as a significant component to this task. In the stroke group the frontal activation is confined to the lateralizing component (red) in the stroke group. The lateralizing frontal component (red) constitutes the inferior frontal gyrus (BA 44/45/47) and parts of the middle frontal gyrus (BA 6/9). This component corresponds to the lateralized frontal activation as seen in the GLM analysis (Figure 2). In both groups this frontal component has the strongest correlation with the time course.
The superior frontal lobe component (green; anterior cingulate gyrus, BA 32 and small part of the medial frontal gyrus) is also seen in the ICA and corresponds fairly well to the activation seen within this area in the GLM analysis, even though it is somewhat different in appearance.
As in the stroke group, an additional bilateral cortical component is seen in the occipital lobe (orange, BA 18, cuneus and part of the lingual gyrus). This activation is more superiorly organized than the occipital activation seen in the GLM analysis, where in the control group there is no occipital activation in the GLM analysis.
Another interesting finding using ICA is that this right lateralized frontal hemispheric component in the stroke group is also present in the healthy control group with a similar spatial distribution (not shown). In the healthy controls, this component surprisingly has a negative correlation to the time course of this task, with a weak percent signal change compared to the positive BOLD activation. Thus, in the healthy controls ICA finds a weak negative change in the BOLD response in the right frontal lobe in the same area where stroke patients show a positive BOLD response. Extracting the time courses from this component and calculating their correlations to the task gave a significant difference between groups, again showing a positive correlation in the stroke group and a negative correlation to the time course in the healthy control group. These anatomically identical components raise some questions regarding the underlying mechanism of the negative BOLD response seen in the normal control group.
Extent of cerebral loss
To study the effect of lesion size on the distribution of cortical activation patterns we included in the analysis the percentage of left-hemispheric volume loss. We used a non-linear regression model on a voxel by voxel basis to find cortical areas with a correlation between volume loss and amount of activation (z-scores). This analysis did not result in a significant correlation pattern. To find a possible relationship between the size of the lesion and interhemispheric reorganization of language areas we examined the correlation between the extent of the lesion and LI. Again, using non-linear regression methods we did not find any significant correlations between LI and lesion size.
Discussion
Our findings lead us to four conclusions. First, cortical activation patterns for language production are shifted to the right hemisphere in children with a history of perinatal left MCA stroke. The right hemisphere cortical activation found in the stroke group is almost identical to the expressive language areas classically seen in the left hemisphere of normal subjects, with the exception of a more dorsal concentration of the activation in the frontal language areas. Second, the size of the stroke does not appear to affect the interhemispheric distribution of the activated cortical areas. Rather, it appears that both large and small perinatal lesions of the left hemisphere result in a significant shift of expressive language functions towards the right hemisphere. Third, additional components activated in the stroke group during the VG task suggest that the stroke patients recruit different brain regions in support of this function as compared with healthy children, which could imply atypical cortical activation pathways. Finally, the negative BOLD response in the right frontal hemisphere observed within the healthy control group may reflect neuronal deactivation or inhibition of this area. If this decrease in BOLD signal response reflects deactivation, this could suggest that there is a ‘dormant’ circuitry available for language function that is inhibited in the non-dominant hemisphere of healthy children but which may be turned on (or activated) when primary regions in the dominant hemisphere become unavailable to exert inhibition, as in the case of perinatal stroke. Therefore, our study provides new and important evidence for the development of lateralization of productive language functions and may have important implications for the mechanisms of recovery from acute events affecting left frontal language areas.
Right hemisphere shift
The verb generation task shows a left hemispheric language dominance in both healthy adults and children 1–4, 7. As illustrated in the composite activation maps of Figure 2, the stroke group activated right hemispheric inferior frontal regions with anatomically identical cortical areas compared to the left frontal classical language areas. A considerable proportion of the stroke group had some residual left hemisphere activation regardless of the size of the lesion. To account for the activation within these regions, they were included in the LI analysis which showed a clear left hemisphere dominance in the majority of the stroke subjects. Further, the total size of activation as measured by the number of activated voxels was not significantly different between the activated dominant frontal areas, suggesting that the right-hemispheric shift in our study was related to true language displacement. This demonstrates that as a group they show that language processing is a matter of hemispheric dominance, similar to findings in the healthy population. Together, these results support the hypothesis that following early injury of the typical left hemisphere language areas, functionally homologous areas in the right hemisphere will preferentially subsume language related functions.
The visual inspection of the composite GLM activation in the frontal regions of the stroke patients shows almost a mirror image of the healthy control activation map with the exception of the larger activation seen in more posterior-dorsal parts of the inferior and medial frontal gyri. A possible limitation of our study is the small number of subjects enrolled. We do not think that the small number of subjects constitutes a serious confound of our findings however, as they are corroborated by a recent study that examined the effects of long-standing brain injury on language distribution.57 These authors reported on the effects of chronic non-lesional injury on the language activation patterns in a group of patients with focal, left-hemispheric epilepsy and found a posterior-dorsal displacement of right hemispheric language activation patterns. An interesting question that remains to be answered by future studies is how this right-hemispheric Broca homologue relates to the left dominant inferior frontal gyrus in terms of cyto-architectural properties.
Lesion location, size and cortical reorganization
Precisely how the location and size of lesion influences the redistribution of language activation patterns remains partly unanswered. A recent study32 showed that lesions (non-stroke) remote from the classical frontal language area cause inter-hemispheric language redistribution. In contrast, lesions within this area produced perilesional activity supporting language functions. The results in that study were from a limited number of subjects with a wide variety of pathologies of later onset than the perinatal events in our population. Our stroke group is too small to include an analysis based on the exact location of the damaged cortical structures. The small size of our study group may also be a limitation to finding a relationship between language activation patterns and the size of the lesion. However, our findings suggest that there is no such relationship and that even small lesions produce a significant shift in functional language areas to the right hemisphere, but larger sample sizes are needed to answer this question conclusively. In addition, the group size was not large enough to obtain any significant data on the effect of other covariates such as presence of epilepsy or IQ.
Residual left hemisphere activation
The left hemisphere was activated in a considerable proportion of the stroke subjects, mostly within areas unaffected by stroke. In addition, four out of the 10 stroke patients showed perilesional activation. Perilesional language-related activity has been reported in functional studies of stroke in adults.58, 59 However, we did not find a consistent pattern of displaced left hemisphere activation in our stroke group, and there was no relation to the relevant parameters (LI, IQ, or size of lesion). Nevertheless, the residual left hemisphere activation should not be discounted. Such activation may imply that even though there is a net redistribution of functional language areas to the right hemisphere, remnants of left hemispheric language areas are needed or preferred for optimal language function in the developing brain. Alternatively, ischemic lesions may lead to structural and functional changes in the perilesional brain tissue, potentially altering the BOLD response. The same applies to ‘activation’ seen within the area of stroke (noted in two of our stroke subjects). We did not disregard this activation (e.g. applying a mask to cover the activity seen in the lesion) in order to avoid biasing the data. An important question that remains unanswered is whether there is surviving neural tissue that remains vital and active or if these activations are merely artifacts caused by vascular structures or CSF pulsation within areas of gliosis. Further clinico-pathological studies will be needed to answer this question.
Additional Cortical Components
Activation associated with the VG task noted for the stroke group in a number of additional brain areas gives further insight into cortical reorganization in response to perinatal brain injury. We found increased activation bilaterally in the anterior cingulate gyrus in the stroke group compared to left anterior cingulate activation in controls. Activation in the cingulate gyrus has been described in many studies without a single distinct function. It has been associated with activation in tasks regarding motor control, cognition and arousal.60 In cognitive tasks it has often been associated with attentional demands of task performance37, 61 and has been found to decrease with age in healthy children.5 In our stroke subjects the increased activation in anterior cingulate may reflect increased effort required for the VG task by this group. However, the evidence to support this supposition is not available and, therefore, it is still unclear how anterior cingulate activation relates to the language processing in the stroke group. Another recent study using fMRI in language processing found a modulating role for the anterior cingulate gyrus in the functional connectivity between the left inferior frontal and left temporal language regions.62 With the strong bilateral activation pattern in the temporal gyrus and the lateralized frontal activation in the right hemisphere in the stroke group, changes within the processing network of language might require the engagement of additional cortical regions, e.g. cingulate, to establish and monitor this fronto-temporal connectivity. This could suggest that the stroke group would require this additional activation to control these language areas in verb generation. Other explanations for this activation could include a novel pathway in language production or an effect of subtle cognitive deficits in patients with lower IQ when compared to healthy controls. Our study was not designed to test the above hypotheses and future studies can address these problems to differentiate between (pre)motor control, attention and regulatory functions. Partly, lack of performance measures in the stroke group is a limitation in this study and combining neuropsychological tests with additional fMRI task could give further insight into this matter.
Increased activation in the occipital lobe (predominantly cuneus) in the stroke cohort may reflect similar compensatory processing strategies that supplement language processing. The VG task is known to engage visual language association areas in healthy children and adults.4 The activation in primary visual cortices may reflect further engagement of the visual pathways in language processing. Such activation patterns may reflect a compensatory use of visual imagery in producing responses to the presented nouns either related to ‘visual’ attention to the presented noun, different strategies in generating verbs or may otherwise be related to specific language processing. In the stroke group, both the GLM and ICA analyses showed additional occipital cortex activation with larger areas of task related involvement detected in the ICA. Experiments focusing on visual system participation in language processing will be needed to address the specific role of these regions in the VG task.
ICA reveals that several cortical areas involved in performing the VG task have bilateral distribution in both normal controls and stroke patients. In particular bilateral activation in the middle and superior temporal gyri appears to be preserved in our stroke cohort. Interestingly in this area there is a discrepancy between the activation seen in the GLM analysis and ICA. Where the ICA reveals a more bilateral pattern for the control group than the GLM analysis, this is the opposite for the stroke group, where it shows a more right lateralized pattern in the ICA. In both groups there tends to be bilateral activation with an overall hemispheric dominance. Even though this dominance is not as strongly lateralized as in the frontal language regions, combining the ICA, GLM and LI analyses reveals that the stroke group overall has a right hemispheric dominance within this area and the control group tends to have a left hemisphere dominance. This difference is further supported by the statistical significant difference between the LI’s in the ‘posterior’ ROI.
The strongest hemispheric dominant component for the VG task is situated in the frontal lobe, consistent with earlier studies.22 The neuronal network supporting language processing is the synthesis of multiple cortical areas with multiple bilateral components and one lateralizing component. This approach was already recognized by Brodmann in the early 1900’s when he wrote:
“One must therefore also assume a certain regional preference for higher activities, sometimes more in the occipital and temporal areas, sometimes more in frontal. Such activities are, however, always the result (and not merely the sum) of the function of a large number of suborgans distributed more or less widely over the cortical surface.” 63
The introduction of ICA in the fMRI data analysis is a powerful addition to the standard GLM analysis. We believe that applying this technique to future event-related paradigms together with other imaging studies such as magneto-encephalography (MEG) will further increase the understanding of the neuronal pathways responsible for semantic language processing, eventually differentiating spatial and temporal properties of cognitive processing in both healthy and affected pathological groups. In our results we have shown that the results obtained with ICA are fairly similar to those with GLM, contributing to the insight that the cortical areas found with GLM constitute a network for semantic language processing. Future endeavors should identify in further detail the temporal aspects of this network, investigating the strength of these interactions with methods such as structural equation modeling.
Additionally, the discovery of a component in the control group with a negative BOLD response in the right hemispheric homologue to the expressive language area demonstrates the power of the ICA method for exploratory analysis. This component could be explained by either deactivation during the language task, weak positive activation during the control task, or it could be an artifact. It is not clear with the small number of subjects included in this study, whether this is an incidental finding or if it actually reflects an underlying inhibitory influence on these cortical areas. Recently published data on negative BOLD responses have been suggestive of neuronal deactivation in the monkey brain (e.g. inhibition)64 and transcallosal inhibition of the language pathways has been hypothesized to play a role in the recovery of expressive aphasia in adults.22 Further, in human studies, a decrease in transcallosal inhibition has been implicated in more bilateral or symmetric BOLD signal changes related to various cognitive processes (e.g., language or vision) in elderly. Such a decrease in intrahemispheric inhibition allows for participation of other, possibly previously dormant brain areas in maintaining cognitive functions as the brain ages.65, 66
Overall, the data presented here provide additional knowledge of neuroplasticity following an early injury to the immature brain. In addition to the overall shift of expressive language dominance to the right hemisphere, this study also provides new information that can be useful for the design of future experiments addressing the issues of language recovery after stroke in children and adults. Answering specific questions such as the role of perilesional activity seen in fMRI and possible neuronal inhibition of right hemisphere language network components will increase the understanding of neuroplasticity and potentially affect the rehabilitation strategies in stroke patients. Increased sample size will be imperative to account for factors that might have an impact on the redistribution of cortical activation in future investigation of neuroplasticity in both adults and children.
Acknowledgments
Support was provided by National Institution of Health, K23 NINDS 01467-01 (AWB) and NICHD R01-HD 38578 (SKH). This work was presented in part at the 130th Annual Meeting of the American Neurology Association 2005.
Footnotes
Publisher's Disclaimer: This is a PDF file of an unedited manuscript that has been accepted for publication. As a service to our customers we are providing this early version of the manuscript. The manuscript will undergo copyediting, typesetting, and review of the resulting proof before it is published in its final citable form. Please note that during the production process errors may be discovered which could affect the content, and all legal disclaimers that apply to the journal pertain.
References
- 1.Gaillard WD, Hertz-Pannier L, Mott SH, et al. Functional anatomy of cognitive development: fMRI of verbal fluency in children and adults. Neurology. 2000;54:180–185. doi: 10.1212/wnl.54.1.180. [DOI] [PubMed] [Google Scholar]
- 2.Holland SK, Plante E, Weber Byars A, et al. Normal fMRI brain activation patterns in children performing a verb generation task. Neuroimage. 2001;14:837–843. doi: 10.1006/nimg.2001.0875. [DOI] [PubMed] [Google Scholar]
- 3.Wood AG, Harvey AS, Wellard RM, et al. Language cortex activation in normal children. Neurology. 2004;63:1035–1044. doi: 10.1212/01.wnl.0000140707.61952.ca. [DOI] [PubMed] [Google Scholar]
- 4.Szaflarski JP, Holland SK, Schmithorst VJ, Byars AW. fMRI study of language lateralization in children and adults. Hum Brain Mapp. 2005 doi: 10.1002/hbm.20177. [DOI] [PMC free article] [PubMed] [Google Scholar]
- 5.Szaflarski JP, Schmithorst VJ, Altaye M, et al. A longitudinal functional magnetic resonance imaging study of language development in children 5 to 11 years old. Ann Neurol. 2006 doi: 10.1002/ana.20817. [DOI] [PMC free article] [PubMed] [Google Scholar]
- 6.Bookheimer S. Functional MRI of language: new approaches to understanding the cortical organization of semantic processing. Annu Rev Neurosci. 2002;25:151–188. doi: 10.1146/annurev.neuro.25.112701.142946. [DOI] [PubMed] [Google Scholar]
- 7.Demonet JF, Thierry G, Cardebat D. Renewal of the neurophysiology of language: functional neuroimaging. Physiological Reviews. 2005;85:49–95. doi: 10.1152/physrev.00049.2003. [DOI] [PubMed] [Google Scholar]
- 8.Dehaene-Lambertz G, Dehaene S, Hertz-Pannier L. Functional neuroimaging of speech perception in infants. Science. 2002;298:2013–2015. doi: 10.1126/science.1077066. [DOI] [PubMed] [Google Scholar]
- 9.Schlaggar BL, Brown TT, Lugar HM, et al. Functional neuroanatomical differences between adults and school-age children in the processing of single words. Science. 2002;296:1476–1479. doi: 10.1126/science.1069464. [DOI] [PubMed] [Google Scholar]
- 10.deVeber GA, MacGregor D, Curtis R, Mayank S. Neurologic outcome in survivors of childhood arterial ischemic stroke and sinovenous thrombosis. J Child Neurol. 2000;15:316–324. doi: 10.1177/088307380001500508. [DOI] [PubMed] [Google Scholar]
- 11.Max JE. Effect of side of lesion on neuropsychological performance in childhood stroke. Journal of the International Neuropsychological Society. 2004;10:698–708. doi: 10.1017/S1355617704105092. [DOI] [PubMed] [Google Scholar]
- 12.Nelson KB, Lynch JK. Stroke in newborn infants. Lancet Neurol. 2004;3:150–158. doi: 10.1016/S1474-4422(04)00679-9. [DOI] [PubMed] [Google Scholar]
- 13.Chapman SB, Max JE, Gamino JF, et al. Discourse plasticity in children after stroke: age at injury and lesion effects. Pediatric Neurology. 2003;29:34–41. doi: 10.1016/s0887-8994(03)00012-2. [DOI] [PubMed] [Google Scholar]
- 14.Bates E, Thal D, Trauner D, et al. From first words to grammar in children with focal brain injury. Developmental Neuropsychology. 1997;13:275–344. [Google Scholar]
- 15.Chilosi AM, Cipriani PP, Bertuccelli B, et al. Early cognitive and communication development in children with focal brain lesions. J Child Neurol. 2001;16:309–316. doi: 10.1177/088307380101600502. [DOI] [PubMed] [Google Scholar]
- 16.Cao Y, Vikingstad EM, George KP, et al. Cortical language activation in stroke patients recovering from aphasia with functional MRI. Stroke. 1999;30:2331–2340. doi: 10.1161/01.str.30.11.2331. [DOI] [PubMed] [Google Scholar]
- 17.Weiller C, Isensee C, Rijntjes M, et al. Recovery from Wernicke’s aphasia: a positron emission tomographic study. Ann Neurol. 1995;37:723–732. doi: 10.1002/ana.410370605. [DOI] [PubMed] [Google Scholar]
- 18.Carmichael ST. Plasticity of cortical projections after stroke. Neuroscientist. 2003;9:64–75. doi: 10.1177/1073858402239592. [DOI] [PubMed] [Google Scholar]
- 19.Fernandez B, Cardebat D, Demonet JF, et al. Functional MRI follow-up study of language processes in healthy subjects and during recovery in a case of aphasia. Stroke. 2004;35:2171–2176. doi: 10.1161/01.STR.0000139323.76769.b0. [DOI] [PubMed] [Google Scholar]
- 20.Warburton E, Price CJ, Swinburn K, Wise RJ. Mechanisms of recovery from aphasia: evidence from positron emission tomography studies.[see comment] Journal of Neurology, Neurosurgery & Psychiatry. 1999;66:155–161. doi: 10.1136/jnnp.66.2.155. [DOI] [PMC free article] [PubMed] [Google Scholar]
- 21.Thulborn KR, Carpenter PA, Just MA. Plasticity of language-related brain function during recovery from stroke. Stroke. 1999;30:749–754. doi: 10.1161/01.str.30.4.749. [DOI] [PubMed] [Google Scholar]
- 22.Price CJ, Crinion J. The latest on functional imaging studies of aphasic stroke. Current Opinion in Neurology. 2005;18:429–434. doi: 10.1097/01.wco.0000168081.76859.c1. [DOI] [PubMed] [Google Scholar]
- 23.Rasmussen T, Milner B. The role of early left-brain injury in determining lateralization of cerebral speech functions. Ann N Y Acad Sci. 1977;299:355–369. doi: 10.1111/j.1749-6632.1977.tb41921.x. [DOI] [PubMed] [Google Scholar]
- 24.Satz P, Strauss E, Wada J, Orsini DL. Some correlates of intra- and interhemispheric speech organization after left focal brain injury. Neuropsychologia. 1988;26:345–350. doi: 10.1016/0028-3932(88)90087-5. [DOI] [PubMed] [Google Scholar]
- 25.Lazar RM, Marshall RS, Pile-Spellman J, et al. Interhemispheric transfer of language in patients with left frontal cerebral arteriovenous malformation. Neuropsychologia. 2000;38:1325–1332. doi: 10.1016/s0028-3932(00)00054-3. [DOI] [PubMed] [Google Scholar]
- 26.Muller RA, Rothermel RD, Behen ME, et al. Language organization in patients with early and late left-hemisphere lesion: a PET study. Neuropsychologia. 1999;37:545–557. doi: 10.1016/s0028-3932(98)00109-2. [DOI] [PubMed] [Google Scholar]
- 27.DeVos KJ, Wyllie E, Geckler C, et al. Language dominance in patients with early childhood tumors near left hemisphere language areas. Neurology. 1995;45:349–356. doi: 10.1212/wnl.45.2.349. [DOI] [PubMed] [Google Scholar]
- 28.Duchowny M, Jayakar P, Harvey AS, et al. Language cortex representation: effects of developmental versus acquired pathology. Ann Neurol. 1996;40:31–38. doi: 10.1002/ana.410400108. [DOI] [PubMed] [Google Scholar]
- 29.Staudt M, Grodd W, Niemann G, et al. Early left periventricular brain lesions induce right hemispheric organization of speech. Neurology. 2001;57:122–125. doi: 10.1212/wnl.57.1.122. [DOI] [PubMed] [Google Scholar]
- 30.Staudt M, Lidzba K, Grodd W, et al. Right-hemispheric organization of language following early left-sided brain lesions: functional MRI topography. Neuroimage. 2002;16:954–967. doi: 10.1006/nimg.2002.1108. [DOI] [PubMed] [Google Scholar]
- 31.Briellmann RS, Abbott DF, Caflisch U, et al. Brain reorganisation in cerebral palsy: a high-field functional MRI study. Neuropediatrics. 2002;33:162–165. doi: 10.1055/s-2002-33680. [DOI] [PubMed] [Google Scholar]
- 32.Liegeois F, Connelly A, Cross JH, et al. Language reorganization in children with early-onset lesions of the left hemisphere: an fMRI study.[see comment] Brain. 2004;127:1229–1236. doi: 10.1093/brain/awh159. [DOI] [PubMed] [Google Scholar]
- 33.Vikingstad EM, Cao Y, Thomas AJ, et al. Language hemispheric dominance in patients with congenital lesions of eloquent brain. Neurosurgery. 2000;47:562–570. doi: 10.1097/00006123-200009000-00004. [DOI] [PubMed] [Google Scholar]
- 34.Heller SL, Heier LA, Watts R, et al. Evidence of cerebral reorganization following perinatal stroke demonstrated with fMRI and DTI tractography. Clin Imaging. 2005;29:283–287. doi: 10.1016/j.clinimag.2004.09.003. [DOI] [PubMed] [Google Scholar]
- 35.Jacola LM, Schapiro MB, Schmithorst VJ, et al. Functional magnetic resonance imaging reveals atypical language organization in children following perinatal left middle cerebral artery stroke1. Neuropediatrics. 2006;37:46–52. doi: 10.1055/s-2006-923934. [DOI] [PMC free article] [PubMed] [Google Scholar]
- 36.Wechsler D. Wechsler Intelligence Scale for Children. 3. San Antonio: Psychological Corporation; 1991. [Google Scholar]
- 37.Petersen SE, Fox PT, Posner MI, et al. Positron emission tomographic studies of the cortical anatomy of single-word processing. Nature. 1988;331:585–589. doi: 10.1038/331585a0. [DOI] [PubMed] [Google Scholar]
- 38.Byars AW, Holland SK, Strawsburg RH, et al. Practical aspects of conducting large-scale functional magnetic resonance imaging studies in children. Journal of Child Neurology. 2002;17:885–890. doi: 10.1177/08830738020170122201. [DOI] [PMC free article] [PubMed] [Google Scholar]
- 39.Schmithorst VJ, Dardzinski BJ, Holland SK. Simultaneous correction of ghost and geometric distortion artifacts in EPI using a multiecho reference scan. IEEE Trans Med Imaging. 2001;20:535–539. doi: 10.1109/42.929619. [DOI] [PMC free article] [PubMed] [Google Scholar]
- 40.Wansapura JP, Holland SK, Dunn RS, Ball WS., Jr NMR relaxation times in the human brain at 3.0 tesla. J Magn Reson Imaging. 1999;9:531–538. doi: 10.1002/(sici)1522-2586(199904)9:4<531::aid-jmri4>3.0.co;2-l. [DOI] [PubMed] [Google Scholar]
- 41.Duewell S, Wolff SD, Wen H, et al. MR imaging contrast in human brain tissue: assessment and optimization at 4 T. Radiology. 1996;199:780–786. doi: 10.1148/radiology.199.3.8638005. [DOI] [PubMed] [Google Scholar]
- 42.Wilke M, Schmithorst VJ, Holland SK. Assessment of spatial normalization of whole-brain magnetic resonance images in children. Hum Brain Mapp. 2002;17:48–60. doi: 10.1002/hbm.10053. [DOI] [PMC free article] [PubMed] [Google Scholar]
- 43.Thevenaz P, Unser M. A pyramid approach to sub-pixel registration based on intensity. IEEE Trans Image Processing. 1998;7:27–41. doi: 10.1109/83.650848. [DOI] [PubMed] [Google Scholar]
- 44.Talairach J, Tournoux P. Co-planar stereotaxic atlas of the human brain. New York: Thieme Medical Publishers, Inc; 1988. [Google Scholar]
- 45.Friston KJ, Holmes AP, Price CJ, et al. Multisubject fMRI studies and conjunction analyses. Neuroimage. 1999;10:385–396. doi: 10.1006/nimg.1999.0484. [DOI] [PubMed] [Google Scholar]
- 46.Xiong J, Gao J-H, Lancaster JL, Fox PT. Clustered Pixels Analysis for Functional MRI Activation Studies of the Human Brain. Human Brain Mapping. 1995;3:287–301. [Google Scholar]
- 47.Ledberg A, Akerman S, Roland PE. Estimation of the probabilities of 3D clusters in functional brain images. Neuroimage. 1998;8:113–128. doi: 10.1006/nimg.1998.0336. [DOI] [PubMed] [Google Scholar]
- 48.Calhoun VD, Adali T, Pearlson GD, Pekar JJ. A method for making group inferences from functional MRI data using independent component analysis. Hum Brain Mapp. 2001;14:140–151. doi: 10.1002/hbm.1048. [DOI] [PMC free article] [PubMed] [Google Scholar]
- 49.Schmithorst VJ, Holland SK, Plante E. Cognitive modules utilized for narrative comprehension in children: a functional magnetic resonance imaging study. Neuroimage. 2006;29:254–266. doi: 10.1016/j.neuroimage.2005.07.020. [DOI] [PMC free article] [PubMed] [Google Scholar]
- 50.Beckmann CF, Noble JA, Smith SM. Investigating the intrinsic dimensionality of FMRI data for ICA. Neuroimage. 2001:13. [Google Scholar]
- 51.Hyvarinen A. Fast and robust fixed-point algorithms for independent component analysis. IEEE Trans Neural Netw. 1999;10:626–634. doi: 10.1109/72.761722. [DOI] [PubMed] [Google Scholar]
- 52.Himberg J, Hyvarinen A, Esposito F. Validating the independent components of neuroimaging time series via clustering and visualization. Neuroimage. 2004;22:1214–1222. doi: 10.1016/j.neuroimage.2004.03.027. [DOI] [PubMed] [Google Scholar]
- 53.Carne RP, Vogrin S, Litewka L, Cook MJ. Cerebral cortex: an MRI-based study of volume and variance with age and sex. J Clin Neurosci. 2006;13:60–72. doi: 10.1016/j.jocn.2005.02.013. [DOI] [PubMed] [Google Scholar]
- 54.*Szaflarski JP, Holland SK, Schmithorst VJ, Byars AW. fMRI study of language lateralization in children and adults. Hum Brain Mapp. 2006;27:202–212. doi: 10.1002/hbm.20177. [DOI] [PMC free article] [PubMed] [Google Scholar]
- 55.Knecht S, Jansen A, Frank A, et al. How atypical is atypical language dominance? Neuroimage. 2003;18:917–927. doi: 10.1016/s1053-8119(03)00039-9. [DOI] [PubMed] [Google Scholar]
- 56.Schmithorst VJ, Brown RD. Empirical validation of the triple-code model of numerical processing for complex math operations using functional MRI and group Independent Component Analysis of the mental addition and subtraction of fractions. Neuroimage. 2004;22:1414–1420. doi: 10.1016/j.neuroimage.2004.03.021. [DOI] [PubMed] [Google Scholar]
- 57.Voets NL, Adcock JE, Flitney DE, et al. Distinct right frontal lobe activation in language processing following left hemisphere injury. Brain. 2006;129:754–766. doi: 10.1093/brain/awh679. [DOI] [PubMed] [Google Scholar]
- 58.Weiller C. Imaging recovery from stroke. Experimental Brain Research. 1998;123:13–17. doi: 10.1007/s002210050539. [DOI] [PubMed] [Google Scholar]
- 59.Muller RA, Rothermel RD, Behen ME, et al. Brain organization of language after early unilateral lesion: a PET study. Brain Lang. 1998;62:422–451. doi: 10.1006/brln.1997.1931. [DOI] [PubMed] [Google Scholar]
- 60.Paus T. Primate anterior cingulate cortex: where motor control, drive and cognition interface. Nat Rev Neurosci. 2001;2:417–424. doi: 10.1038/35077500. [DOI] [PubMed] [Google Scholar]
- 61.Carter CS, Braver TS, Barch DM, et al. Anterior cingulate cortex, error detection, and the online monitoring of performance. Science. 1998;280:747–749. doi: 10.1126/science.280.5364.747. [DOI] [PubMed] [Google Scholar]
- 62.Stamatakis EA, Marslen-Wilson WD, Tyler LK, Fletcher PC. Cingulate control of fronto-temporal integration reflects linguistic demands: a three-way interaction in functional connectivity. Neuroimage. 2005;28:115–121. doi: 10.1016/j.neuroimage.2005.06.012. [DOI] [PubMed] [Google Scholar]
- 63.Brodmann K, Garey L. Brodmann’s “Localisation in the cerebral cortex”. xviii. London: Imperial College Press; 1999. p. 300. [Google Scholar]
- 64.Shmuel A, Augath M, Oeltermann A, Logothetis NK. Negative functional MRI response correlates with decreases in neuronal activity in monkey visual area V1. Nat Neurosci. 2006;9:569–577. doi: 10.1038/nn1675. [DOI] [PubMed] [Google Scholar]
- 65.Grady CL. Age-related changes in cortical blood flow activation during perception and memory. Annals of the New York Academy of Sciences. 1996;777:14–21. doi: 10.1111/j.1749-6632.1996.tb34396.x. [DOI] [PubMed] [Google Scholar]
- 66.O’Sullivan M, Jones DK, Summers PE, et al. Evidence for cortical “disconnection” as a mechanism of age-related cognitive decline. Neurology. 2001;57:632–638. doi: 10.1212/wnl.57.4.632. [DOI] [PubMed] [Google Scholar]