

Abstract
The purpose of this preliminary study was to examine cerebral blood flow (CBF) as measured by arterial spin labeling (ASL) in tissue classified as white matter hyperintensities (WMH), normal appearing white matter, and grey matter. Seventeen healthy older adults received structural and ASL MRI. Cerebral blood flow was derived for three tissue types: WMH, normal appearing white matter, and grey matter. Cerebral blood flow was lower in WMH areas relative to normal appearing white matter, which in turn, was lower than grey matter. Regions with consistently lower CBF across individuals were more likely to appear as WMH. Results are consistent with an emerging literature linking diminished regional perfusion with the risk of developing WMH.
Keywords: white matter hyperintensities, arterial spin labeling, MRI
1. Introduction
White matter hyperintensities (WMH) are areas of increased signal intensity detected on T2-weighted magnetic resonance imaging (MRI) scans. These lesions are common among older adults (Brickman et al. 2008b) and are thought to reflect small vessel vascular disease or β-amyloid peptide deposition (Gurol et al. 2006). Increased WMH volume is associated with degree of cognitive impairment among neurologically healthy older adults (Gunning-Dixon and Raz 2000) and is predictive of rate of cognitive decline among those with Alzheimer's disease (Brickman et al. 2008a). Although these associative findings have been consistently reported, the functional significance of WMH is unclear.
Increases in total or frontal WMH volume has been associated with decreases in relative glucose metabolism in frontal regions among healthy older adults (DeCarli et al. 1995). In a longitudinal analysis, individuals with increasing severity of WMH over an 8-year period had concomitant increases in relative cerebral blood flow (CBF) in temporal areas and anterior cingulate and decreases in relative CBF in more posterior areas (Kraut et al. 2008). Further, increased severity of WMH was not associated with total parenchymal CBF in a cross-sectional analysis, but decreases in CBF over time increased the risk of developing periventricular WMH (ten Dam et al. 2007). Holland and colleagues recently showed that WMH frequency among healthy older adults and those with AD or cerebral amyloid angiopathy is greater in regions with relatively lower perfusion among younger adults (Holland et al. 2008). These findings raise the possibility that a lower regional perfusion increases the risk of developing WMH.
In the current study, we sought to extend these findings by examining arterial spin labeling (ASL)-derived CBF in areas appearing as WMH on T2-weighted fluid attenuated inverse recovery (FLAIR) MRI scans in comparison to CBF in normal appearing white matter (NAWM) and grey matter among neurologically healthy older adults. Two previous studies used perfusion-weighted MRI and found a decline in blood flow in areas appearing as WMH on T2-weighted images compared to normal appearing white matter (Marstrand et al. 2002; Sachdev et al. 2004). Thus, we hypothesized that CBF would be decreased in areas appearing as WMH compared to CBF in NAWM and grey matter.
2. Methods
2.1. Subjects
Seventeen older adults ranging in age from 61 to 70 (mean±SD=64.94±2.95) comprised the study sample. There were 9 women (53%) and the average number of years of formal education was 16.29 (SD=1.72). Men and women did not differ in age (t(15)=0.235, p=0.817) or number of years of education (t(15)=0.371, p=0.716). All participants were right handed and spoke English. By self report and interview, participants did not have past or current histories of medical, neurological, psychiatric disorders or treatment with psychoactive medication. Participants were screened for dementia with interview and psychometric assessment (Mattis 1988); none met diagnostic criteria. Subjects were recruited for participation in an ongoing fMRI study of working memory and aging. The study was approved by a local ethics committee and all participants gave written informed consent to participate in the study.
2.2. Magnetic resonance imaging
2.2.1. Image Acquisition
All neuroimaging took place in a single session on a 1.5T Philips Intera scanner. Standard high-resolution T1-weighted anatomical images were acquired in the axial plane using the following parameters: FOV=230×230mm, matrix=256×256, slice thickness=1.5 mm, TR/TE=25ms/3ms. T2-weighted FLAIR images were acquired for WMH quantification with the following parameters: FOV=250×250mm, matrix=256×192, slice thickness=3mm, TR/TE=11,000ms/144ms. Detailed description of acquisition of continuous arterial spin labeling (CASL) perfusion images is provided elsewhere (Asllani et al. 2007). Briefly, 30 spin echo, echo planar (EPI) CASL control and labeled images were acquired axially (inferior to superior) with a labeling duration of 2,000ms, post-labeling delay of 800ms, in-plane resolution 3.4 × 3.8 mm slice thickness of 7.5mm, FOV=220×220mm, and TR/TE=5,000ms/35ms. Adiabatic inversion labeling of the water spins and correction for off-resonance saturation was implemented following procedures put forth by Alsop and Detre ((Alsop and Detre 1996); see (Asllani et al. 2007)).
2.2.2. MRI data preprocessing
Preprocessing steps were implemented with the SPM99 software package (Wellcome Department of Cognitive Neurology) with in-house developed software written in MatLab (Mathworks, Natick, MA, USA), described fully in a previous report (Asllani et al. 2007). All CASL and T1-weighted images were coregistered to the first CASL image in the acquisition series. The T1-images were spatially normalized using 7×8×7 nonlinear basis functions into Talairach space defined by the Montreal Neurologic Institute (MNI) and segmented in grey matter, white matter, and cerebral spinal fluid (CSF) posterior probability images. These tissue segment probability maps were thresholded at .80 (80%) to include only voxels with high probability of belonging to a tissue class and reduce the potential influence of partial volume effects. The spatial transformation was applied to the coregistered CASL and tissue segment images; these procedures ensured that all CASL and anatomical images were aligned in the same stereotactic space.
2.2.3. Computation of cerebral blood flow
For computation of cerebral blood flow (CBF), the paired control/label images in Talairach space were used to calculate percent change images following a modified two-compartment formula, as detailed elsewhere (Asllani et al. 2007). In each voxel, CBF values were weighted by the tissue type (i.e., grey matter, white matter, CSF) posterior probability as determined from the T1-weighted image tissue segment. Finally, CBF images were smoothed with a 6 mm spatial kernel.
2.2.4. Quantification of white matter hyperintensities
For quantification of WMH, FLAIR images were imported into the publically available software package MRICro (Rorden and Brett 2000) and WMH volumes were determined following a three step process put forth by Gurol and colleagues (Gurol et al. 2006). First, based on a priori knowledge of the distribution of voxel intensities and visual inspection of each individual image, we determined the intensity threshold that labeled voxels appearing as hyperintense. Second, on a slice-by-slice basis, region-of-interests (ROIs) were manually traced to define gross areas containing WMH while excluding non-WMH areas that were labeled in step 1 (e.g., dermal fat). Third, the intersection of the labeled voxels in Step 1 and the manual ROIs yielded the volume of WMH in cm3. Further, binary image maps were created such that all voxels labeled as WMH were assigned the value 1 and all remaining voxels were assigned the value 0. These maps were spatially normalized into Talairach space through application of the transformation algorithm derived from the normalization of the T1-weighted image.
2.3. Outcome measures
Three primary measures were determined for statistical analysis for each subject. First, the segmented grey matter image was coregistered to the ASL image and the mean CBF was calculated from all voxels defined as greater than 80% grey matter. Second, the binary WMH map was coregistered to the ASL image and WMH CBF was defined as the mean over all voxels labeled as WMH. Third, the segmented white matter image was coregistered to the ASL image and the mean CBF was calculated from all voxels defined as greater than 80% white matter after removing those voxels identified as WMH (i.e., NAWM).
3. Results
Participants in the current study had a relatively mild degree of WMH burden (Mean±SD WMH volume=4.631±4.836 cm3, median=2.00, range=0.10 to 16.90). A general linear model was constructed to evaluate differences in CBF among voxels classified as WMH, NAWM, and grey matter. Cerebral blood flow in each of these reasons was treated as a repeated measure (i.e., within-subjects factor). There was a significant overall difference in CBF among these regions (F(2, 32) = 185.61, p<0.001). Pairwise comparisons indicated that CBF was significantly lower in WMH than in NAWM, which, in turn, was significantly lower than CBF in grey matter (p ≤ 0.001 for all pairwise comparisons). These results are displayed in Figure 1. Further, the non-parametric Wilcoxin signed ranks test confirmed significant differences among groups (all group comparisons p < 0.004). Figure 2 displays an image in which voxels labeled as WMH in at least 5 subjects are superimposed on the mean CBF image derived by averaging the CASL images from all subjects.
Figure 1.

Mean differences in CASL-determined blood flow in grey matter regions, normal appearing white matter (NAWM), and in areas with white matter hyperintensities (WMH). Error bars are standard deviations. All pairwise comparisons are statistically significant (p<0.001).
Figure 2.
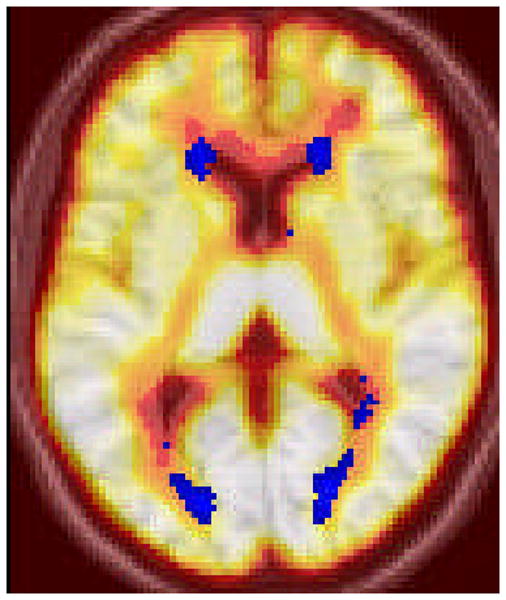
Voxels labeled as WMH in at least 5 subjects (in blue) superimposed on the mean CBF image derived by the average of all subjects' CASL images.
We examined whether the mean CBF value varied as a function of the likelihood that any given voxel was labeled as WMH. To do this analysis, we created a conjunction map of all individual WMH masks from individual subjects in standardized anatomical space. We grouped voxels by frequency and compared mean CBF values across frequency values, which ranged from 1 to 15 (note that no single voxel was labeled as a WMH in all 17 subjects). As displayed in Figure 3, there was a subtle, but significant (F (14, 21787) = 174.439, p<0.001) linear decline (p for linear trend = 0.045) across frequency groups. Next we calculated the standard deviation and coefficient of variation (a normalized metric of dispersion, σ/μ) for mean CBF values in each frequency group and correlated those values against frequency. Decreases in both standard deviation (Spearman's rho = -0.889, p < 0.001) and the coefficient of variation (Spearman's rho = -0.796, p < 0.001) were strongly related to increased frequency. Taken together, these findings suggest that regions with consistently low CBF across individuals are more likely to appear as WMH.
Figure 3.

Mean group CBF displayed as a function of the frequency (i.e., number of subjects) in which voxels are labeled as WMH. Each circle represents a single voxel. For example, a single circle in Frequency = 5 represents the total group mean CBF for a voxel that is labeled as WMH in five subjects. Note subtle decline in group mean CBF across frequency (red dot) in marked decrease in variability, suggesting that areas with consistently lower CBF are most likely to be WMH across individuals. The number of voxels included for each frequency, 1 through 15, respectively, are 12109, 3811, 1796, 1125, 795, 608, 482, 377, 269, 212, 114, 58, 32, 10, and 4.
4. Discussion
In the current preliminary study, we compared CASL-derived mean CBF across three tissue types – areas appearing as WMH on T2-weighted FLAIR MRI, NAWM, and grey matter – in well-screened, neurologically healthy older adults. Findings indicated that CBF was significantly reduced in areas appearing as WMH compared to both NAWM and grey matter. These results are consistent with previous reports in demonstrating an association between WMH and reduced blood flow and replicates findings suggesting that that this association is specific to the tissue appearing as WMH itself (Marstrand et al. 2002; Sachdev et al. 2004).
White matter hyperintensities are common findings on T2-weighted images among older adults. Previously thought to lack clinical significance, several studies now confirm that they are associated with poorer cognitive function, may put individuals at risk for the development of dementia, and are more prevalent among certain psychiatric diagnoses. Results from the current study suggest that these associations may be due partially to a reduction in perfusion in areas appearing as WMH. However, causal directionality is difficult to infer from cross-sectional studies. It is possible, for example, that small vascular lesions appear first as WMH and then have a secondary effect on underlying perfusion or that the two phenomena occur concomitantly without a causal link. A recent study by Holland and colleagues speaks against this possibility (Holland et al. 2008). They compared the spatial distribution of WMH among healthy older adults and those with AD or cerebral amyloid angiopathy as it relates to a normative atlas of perfusion values derived from neurologically healthy, younger adults and found that WMH frequency was greater in regions with lower normative perfusion values. Similarly, O'Sullivan and colleagues showed that CBF was reduced in periventricular NAWM among patients with ischemic leukoaraiosis compared to controls, suggesting that diminished regional white matter perfusion may be a “risk factor” for the development of WMH (O'Sullivan et al. 2002). Further, a recent report showed an inverse association between cardiac output and subcortical WMH volume, suggesting that systemic hypoperfusion may increase the risk for development of WMH (Jefferson et al. 2007). Future longitudinal or serial MRI studies are required to determine the exact causal relationship between diminished perfusion and WMH.
Visual inspection of Figure 2 shows reduced CBF in areas labeled as WMH in at least 5 participants from the current study. The figure also reveals that areas that are most vulnerable to the development of WMH, namely periventricular regions that are confluent with the lateral ventricles, appear to have a more profound reduction in blood flow than white matter that is distributed in deeper cortical areas. Findings displayed in Figure 3 suggest that areas that are of consistently low CBF are most likely to be labeled as WMH across individuals.
Two potential limitations should be pointed out. First, atrophy-associated ventricular enlargement may have increased the likelihood of contamination by the CSF of the WMH voxels. To limit this possibility we restricted our analyses to areas with high probability of belonging to a tissue class. Second, although not visualized on T1-weighted images, WMH regions may create subtle signal alterations, which might have affected tissue segmentation used for conversion to CBF of ASL percent change data. Third, it is also conceivable that tissue transit times are longer in WMH, possibly due to associated vasculature changes. This transit time confound would cause an underestimation of CBF. Future work is needed to separate the effect of transit time form absolute CBF reduction in WMH as this would aid in our understanding of the underlying mechanism of the observed CBF reduction in WMH.
Magnetic resonance imaging has emerged as having the utility for identification of the structural and functional correlates of cognitive aging. Converging evidence from animal and human research literature points to age-associated changes in white matter as a particularly salient feature of the aging process. These observations are consistent with a “disconnection” hypothesis of cognitive aging, which posits that integration of coordinated neural systems declines with advancing age (Andrews-Hanna et al. 2007). The current study highlights the possibility that WMH and/or their associated diminution in blood flow may contribute to this disconnection by disrupting neural communication across white matter fibers. Future studies should integrate these MRI modalities with comprehensive cognitive data and evaluate other aspects of white matter integrity.
Acknowledgments
This work was supported by National Institutes of Health grants AG029949 (AMB), AG26158 (YS), and AG026114 (CH).
References
- Alsop DC, Detre JA. Reduced transit-time sensitivity in noninvasive magnetic resonance imaging of human cerebral blood flow. J Cereb Blood Flow Metab. 1996;16:1236–1249. doi: 10.1097/00004647-199611000-00019. [DOI] [PubMed] [Google Scholar]
- Andrews-Hanna JR, Snyder AZ, Vincent JL, Lustig C, Head D, Raichle ME, Buckner RL. Disruption of large-scale brain systems in advanced aging. Neuron. 2007;56:924–935. doi: 10.1016/j.neuron.2007.10.038. [DOI] [PMC free article] [PubMed] [Google Scholar]
- Asllani I, Habeck C, Scarmeas N, Borogovac A, Brown TR, Stern Y. Multivariate and univariate analysis of continuous arterial spin labeling perfusion MRI in Alzheimer's disease. J Cereb Blood Flow Metab. 2007 doi: 10.1038/sj.jcbfm.9600570. [DOI] [PMC free article] [PubMed] [Google Scholar]
- Brickman AM, Honig LS, Scarmeas N, Tatarina O, Sanders L, Albert MS, Brandt J, Blacker D, Stern Y. Measuring cerebral atrophy and white matter hyperintensity burden to predict the rate of cognitive decline in Alzheimer disease. Arch Neurol. 2008a;65:1202–1208. doi: 10.1001/archneur.65.9.1202. [DOI] [PMC free article] [PubMed] [Google Scholar]
- Brickman AM, Schupf N, Manly JJ, Luchsinger JA, Andrews H, Tang MX, Reitz C, Small SA, Mayeux R, DeCarli C, Brown TR. Brain morphology in older African Americans, Caribbean Hispanics, and whites from northern Manhattan. Arch Neurol. 2008b;65:1053–1061. doi: 10.1001/archneur.65.8.1053. [DOI] [PMC free article] [PubMed] [Google Scholar]
- DeCarli C, Murphy DG, Tranh M, Grady CL, Haxby JV, Gillette JA, Salerno JA, Gonzales-Aviles A, Horwitz B, Rapoport SI, et al. The effect of white matter hyperintensity volume on brain structure, cognitive performance, and cerebral metabolism of glucose in 51 healthy adults. Neurology. 1995;45:2077–2084. doi: 10.1212/wnl.45.11.2077. [DOI] [PubMed] [Google Scholar]
- Gunning-Dixon FM, Raz N. The cognitive correlates of white matter abnormalities in normal aging: a quantitative review. Neuropsychology. 2000;14:224–232. doi: 10.1037//0894-4105.14.2.224. [DOI] [PubMed] [Google Scholar]
- Gurol ME, Irizarry MC, Smith EE, Raju S, Diaz-Arrastia R, Bottiglieri T, Rosand J, Growdon JH, Greenberg SM. Plasma beta-amyloid and white matter lesions in AD, MCI, and cerebral amyloid angiopathy. Neurology. 2006;66:23–29. doi: 10.1212/01.wnl.0000191403.95453.6a. [DOI] [PubMed] [Google Scholar]
- Holland CM, Smith EE, Csapo I, Gurol ME, Brylka DA, Killiany RJ, Blacker D, Albert MS, Guttmann CR, Greenberg SM. Spatial Distribution of White-Matter Hyperintensities in Alzheimer Disease, Cerebral Amyloid Angiopathy, and Healthy Aging. Stroke. 2008 doi: 10.1161/STROKEAHA.107.497438. [DOI] [PMC free article] [PubMed] [Google Scholar]
- Jefferson AL, Tate DF, Poppas A, Brickman AM, Paul RH, Gunstad J, Cohen RA. Lower cardiac output is associated with greater white matter hyperintensities in older adults with cardiovascular disease. J Am Geriatr Soc. 2007;55:1044–1048. doi: 10.1111/j.1532-5415.2007.01226.x. [DOI] [PMC free article] [PubMed] [Google Scholar]
- Kraut MA, Beason-Held LL, Elkins WD, Resnick SM. The impact of magnetic resonance imaging-detected white matter hyperintensities on longitudinal changes in regional cerebral blood flow. J Cereb Blood Flow Metab. 2008;28:190–197. doi: 10.1038/sj.jcbfm.9600512. [DOI] [PubMed] [Google Scholar]
- Marstrand JR, Garde E, Rostrup E, Ring P, Rosenbaum S, Mortensen EL, Larsson HB. Cerebral perfusion and cerebrovascular reactivity are reduced in white matter hyperintensities. Stroke. 2002;33:972–976. doi: 10.1161/01.str.0000012808.81667.4b. [DOI] [PubMed] [Google Scholar]
- Mattis S. Dementia Rating Scale (DRS) Odessa, FL: Psychological Assessment Resources; 1988. [Google Scholar]
- O'Sullivan M, Lythgoe DJ, Pereira AC, Summers PE, Jarosz JM, Williams SC, Markus HS. Patterns of cerebral blood flow reduction in patients with ischemic leukoaraiosis. Neurology. 2002;59:321–326. doi: 10.1212/wnl.59.3.321. [DOI] [PubMed] [Google Scholar]
- Rorden C, Brett M. Stereotaxic display of brain lesions. Neurology. 2000;12:191–200. doi: 10.1155/2000/421719. [DOI] [PubMed] [Google Scholar]
- Sachdev P, Wen W, Shnier R, Brodaty H. Cerebral blood volume in T2-weighted white matter hyperintensities using exogenous contrast based perfusion MRI. J Neuropsychiatry Clin Neurosci. 2004;16:83–92. doi: 10.1176/jnp.16.1.83. [DOI] [PubMed] [Google Scholar]
- ten Dam VH, van den Heuvel DM, de Craen AJ, Bollen EL, Murray HM, Westendorp RG, Blauw GJ, van Buchem MA. Decline in total cerebral blood flow is linked with increase in periventricular but not deep white matter hyperintensities. Radiology. 2007;243:198–203. doi: 10.1148/radiol.2431052111. [DOI] [PubMed] [Google Scholar]