

Abstract
The development of transgenic reporter mice and advances in in vivo optical imaging have created unique opportunities to assess and analyze biological responses to thermal therapy directly in living tissues. Reporter mice incorporating the regulatory regions from the genes encoding the 70 kilodalton heat shock proteins (Hsp70) and firefly luciferase (luc) as reporter genes can be used to non-invasively reveal gene activation in living tissues in response to thermal stress. High intensity focused ultrasound (HIFU) can deliver measured doses of acoustic energy to highly localized regions of tissue at intensities that are sufficient to stimulate Hsp70 expression. We report activation of Hsp70-luc expression using 1 second-duration HIFU heating to stimulate gene expression in the skin of the transgenic reporter mouse. Hsp70 expression was tracked for 96 hours following the application of 1.5 MHz continuous-wave ultrasound with spatial peak intensities ranging from 53 W cm−2 up to 352 W cm−2. The results indicated that peak Hsp70 expression is observed 6-48 hours post-heating, with significant activity remaining at 96 hours. Exposure durations were simulated using a finite-element model, and the predicted temperatures were found to be consistent with the observed Hsp70 expression patterns. Histological evaluation revealed that the thermal damage starts at the stratum corneum and extends deeper with increasing intensity. These results indicated that short-duration HIFU may be useful for inducing heat shock expression, and that the period between treatments needs to be greater than 96 hours due to the protective properties of Hsp70.
1. Introduction
The use of therapeutic ultrasound to complement, or direct, the treatment of many diseases is emerging as a versatile and effective tool for improved disease management. This has included the use of kHz- and MHz-frequency ultrasound for cancer treatments involving ablation (jonesHindley et al., 2004), hyperthermia (Diederich and Hynynen, 1999), gene therapy via sonoporation (Miller et al., 1999), drug delivery via sonoporation (Wu et al., 2006), sonodynamic therapy (Rosenthal et al., 2004), and tissue erosion (Xu et al., 2004). The dominant application of high-intensity ultrasound is to induce hyperthermia in tumors, where temperatures are maintained at or above 43°C for durations sufficient to irreversibly kill cells for cancer treatment in breast, liver, skin, and prostate cancers (Dewhirst et al., 1997; Harari et al., 1991), and as an adjunct to chemotherapy and radiotherapy (van der Zee, 2002; Wust et al., 2002; Dahl et al., 1999). High-intensity ultrasound is also used to ablate tissue and involves elevating the temperature to the vicinity of 70°C. MRI-guided focused-ultrasound is used clinically for ablation-treatment of uterine fibroids (Rabinovici et al., 2007; Tempany et al., 2003; Fennessy and Tempany, 2005; Fennessy et al., 2007; Hindley et al., 2004; Hynynen and McDannold, 2004) which is currently the only FDA-approved application of focused-ultrasound heating. Ultrasound may also be used in a much milder therapy to elevate the temperature in tissue to within the range of 37-42°C for the purpose of increasing vascular permeability (Kong et al., 2001), tissue oxygenation (Jones et al., 2004), shifting pH levels (Sun et al., 2000), releasing a drug (Needham et al., 2000), and enhancing gene therapy (Silcox et al., 2005).
Despite the growing application of ultrasound in therapeutic applications, little is known about the temporal and spatial distribution of ultrasound-induced heat shock response in vivo. Most studies that quantify Hsp70 expression as a function of thermal stress have been done in cell culture. The firefly luciferase reporter gene, luc, can be fused to promoter regions of genes such as hsp70 to create reporter genes whose expression can be assessed noninvasively using optical imaging (Contag and Bachmann, 2002). With a stable hsp70A1-luc reporter in NIH 3T3 cell culture, O'Connell-Rodwell et al. (O'Connell-Rodwell et al., 2002) studied hsp70-luc expression over a 72 hour period, with exposure to elevated temperatures of varied durations. Maximum levels of hsp70 expression were observed with 30 second exposures in a narrow temperature range of 50-52°C, above which there was significant cell death. Expression was maximized at 8 hours post hyperthermia and returned to baseline by 30 hours. The optimization of hsp70 expression in cell culture is an important first step in understanding the parameters required to control expression in vivo. While cell culture is ideal for studies of the dependence of expression on a wide range of parameters, the optimal exposure conditions for hsp70 induction in cultured cells may differ from those observed in vivo.
In any thermal therapy, it is important to consider the short-term physiological effects of heating tissue that can extend for hours to days after treatment. In this paper, we focus on the induction of heat-shock protein 70 (Hsp70) following ultrasound hyperthermia in the skin. In vivo studies of Hsp expression in human skin show that heating to 41°C for 1 hour is sufficient to stimulate a spectrum of Hsp expression, and that elevated levels of Hsps protect from subsequent heat treatments (Wilson et al., 2000). In consideration of using hyperthermia for cancer treatment, there is growing evidence that heat shock proteins may also play a role in protecting cancer cells from chemotherapy and radiotherapy (Calderwood and Asea, 2002). Additionally, elevated levels of Hsps caused by hyperthermia may add to the elevated levels of Hsps already known to exist in many cancer types (Ciocca and Calderwood, 2005). Consequently, there is a need for an improved understanding of Hsp expression as a function of thermal stress for improved treatment planning and ultimately better clinical outcomes.
Ultrasound has been used for tissue heating and tissue ablation for decades (Clement, 2004). As acoustic waves propagate through tissue, energy is either scattered or deposited in the form of heat; acoustic attenuation accounts for both loss mechanisms. Through careful measurements of acoustic attenuation and acoustic absorption, it was found that heat generation through acoustic absorption accounts for the majority of acoustic absorption (Kremkau, 1989; Lyons and Parker, 1988; Parker, 1987).
Acoustic attenuation varies among soft tissues, ranging from 0.015 Np cm−1 in testes to 0.14 Np cm−1 in tendon (Duck, 1990; Goss et al., 1979), complicating the calculation of the acoustic intensity required to induce a desired temperature change at a particular depth in a complex organ system. The acoustic absorption is highest in tissues containing a significant fraction of collagen and protein and lowest in tissues containing comparatively large fractions of water (Goss et al., 1979; Fields and Dunn, 1973). Since absorption follows attenuation closely, existing measurements of attenuation within skin can be used to estimate absorption. One way attenuation measurements in the skin of young mice have been measured at 2.25 and 10 MHz (Duck, 1990), and indicate losses of 0.60 Np cm−1 and 3.92 Np cm−1, respectively. Applying a linear fit to these values yields an estimated frequency-dependent attenuation of 0.4 Np cm−1 MHz−1. The generally accepted frequency-dependent attenuation of soft tissue is approximately 0.058 Np cm−1 MHz−1 (corresponding to 0.5 dB cm−1 MHz−1), nearly one-seventh of that in skin. Therefore, it is expected that the skin should absorb significantly more energy than the surrounding tissue. The precise mechanism for increased absorption in the skin is not fully understood, though it is likely due to its high collagen content (Kremkau, 1989; Goss and Dunn, 1980).
To facilitate the analysis of thermal stresses due to HIFU, we have employed the Tg reporter mouse, incorporating a reporter construct that uses the Hsp70A1 promoter and a dual reporter comprised of firefly luciferase and enhanced green fluorescent protein (eGFP) as described by O'Connell-Rodwell et al. (O'Connell-Rodwell et al., 2008). This dual reporter construct allows for the macroscopic analysis of Hsp70 expression in skin in vivo via luciferase expression using bioluminescent imaging (BLI), and microscopic analyses using eGFP after HIFU heating. This Hsp70 reporter mouse model has been shown to be an excellent indicator of cellular stress, cell survival, collateral damage, and wound healing following laser heating in vivo (O'Connell-Rodwell et al., 2008). While this mouse model has proven utility as a reporter for thermal stress and Hsp70 activation in the skin, the reporter signal from other tissues deeper than the skin has proven to be an order of magnitude less than that seen in the skin thus far using laser heating (Mackanos and Contag, 2007). A growing number of research groups are studying the use of ultrasound hyperthermia and Hsp70 to facilitate transgene expression. Madio et al. (Madio et al., 1998) were the first to combine mild hyperthermia generated using focused ultrasound, MRI guidance and MRI thermometry to stimulate Hsp70 in the rat leg. Guilhon et al. (Guilhon et al., 2003) demonstrated the use of green fluorescent protein (GFP) to report Hsp70 expression following MRI-guided focused ultrasound exposures in genetically modified C6 glioma tumors. Silcox et al. (Silcox et al., 2005) applied MRI-guided focused ultrasound heating to induce expression of luciferase promoted by a Hsp70B adenovirus vector injected into the canine prostate. Lui et al. (Liu et al., 2006) showed the use of the firefly luciferase reporter transducted into 4T1 mouse tumors and reported a 120-fold increase in luminescence using relatively short, 10 s exposures of 1.1 MHz ultrasound.
In this paper, we present evidence that short-duration HIFU exposures can stimulate gene expression in vivo in a localized and controlled manner. An animal model reporting on heat shock protein expression could provide a method for in vivo quantification of thermal damage and repair following HIFU heating and may give insight into damage to superficial tissues (e.g. skin burns (Vallancien et al., 1993; Ichizuka et al., 2007)) during deeper HIFU therapies. Furthermore, the model used in this study may be useful for studying the long-term Hsp70 response in soft tissues.
2. Methods
2.1 HIFU Setup
The HIFU apparatus consisted of a 1.5 MHz HIFU transducer (E1249, Valpey-Fisher, Hopkinton, MA) with a 3.8 cm diameter aperture focused at 5.1 cm, resulting in a −6 dB intensity beam width of 1.3 mm at the focus and a −6 dB depth-of-field of 12 mm. A water standoff, consisting of a clear plastic cone and a 25 micron thick TPX window (Westlake Plastics Co., Lenni, Pennsylvania), was bonded to the transducer using hot glue and filled with deionized and degassed water. The TPX window was positioned 5 mm from the focus to prevent heating of the window and disturbance of the beam at the focus. A 5 mm standoff was formed using a 10 mm diameter plastic cylinder centered in the beam axis and glued to the TPX window. The cylinder was filled using a cutout from a gel pad (Aquaflex®, Parker Laboratories, Inc., Fairfield, NJ) to complete the acoustic coupling path. An arbitrary waveform generator (AWG2021, SONY-Tektronix, Beaverton, OR) was used to generate RF pulses that were amplified using a 200-Watt RF power amplifier (3200L-1731, ENI, Rochester, NY) to drive the HIFU transducer. The peak intensity at the focus was calibrated as a function of peak-to-peak voltage into the power amplifier using a high-pressure hydrophone (Muller-Platte, Onda Corp., Sunnyvale, CA). Additionally, the total acoustic power output of the transducer was calibrated as a function of the input voltage using a radiation force balance (UPM-DT-1AV, Ohmic Instruments Co., Easton, MD). The standoff (including TPX window) had a negligible effect on the spatial-peak pressure at the focus.
2.2 Animal Protocol
The protocol used in this study was approved by the University of California, Davis Animal Use and Care Committee. The mice used in this study were FVB and transgenic for Hsp70-luc2A-eGFP. The animals were anesthetized using inhaled-isoflurane and placed on a heating pad to maintain a core temperature between 36 and 37 °C as measured using a rectal thermocouple probe (RET-3, Physitemp Instruments, Inc., Clifton, NJ). Their backs were shaved using clippers and Nair® (Church & Dwight Co., Inc., Princeton, NJ). Excess Nair was removed using damp-warm gauze. The skin was dried using dry gauze, and the back was divided into 4 quadrants using a fine-tip permanent marker (Sharpie® Fine Point, Newell Rubbermaid Inc., Freeport, IL). Ultrasonic coupling gel (Aquasonic® 100, Parker Laboratories, Inc., Fairfield, NJ) warmed to 37°C was applied in a thin layer to the first quadrant, and the HIFU transducer was placed in the center of this quadrant. A 29 gauge needle thermocouple (MT-29/2, Physitemp Instruments, Inc., Clifton, NJ) was briefly inserted in the coupling gel to measure the interface temperature. The ultrasound pulse was manually triggered by the arbitrary waveform generator, and the process was repeated for the remaining 3 quadrants, all of which were completed within 2-3 minutes. Immediately after treatment, excess gel was wiped off, the animals were injected intraperitoneally with luciferin (Xenogen Corp., Alameda, CA; now part of Caliper Life Sciences, Hopkinton, MA) at a dosage of 150 mg/kg, and were imaged two at a time using a Xenogen IVIS system (IVIS 100, Xenogen Corp.) in luminescence mode 15 minutes post injection. The imaging settings consisted of a field-of-view of 10 cm, an aperture setting of f/1, a subject height of 1.5 cm, an exposure time of 120 seconds, and small binning. The first image recorded after treatment is labeled 0 h throughout. The animals were also imaged at 6, 24, 48, 72, and 96 hours post-treatment.
2.3 Hsp70 versus ISPPA Study
In this study, 4 mice were treated with 1 second-duration pulses with spatial-peak, pulse-average intensities, ISPPA, of 53, 125, 227, 352 W cm−2 corresponding to peak-negative acoustic pressures of 1.3, 1.9, 2.6, and 3.2 MPa, respectively, as measured using a hydrophone in deionized and degassed water with an estimated acoustic impedance of 1.48 MRayl. Animals were treated with 53 W cm−2 in the upper right back quadrant (cranial) and proceeding clockwise with increasing intensity to the upper left quadrant, with at least 1 cm of separation between any two spots.
2.4 Data Analysis
Images were imported into MATLAB® (The Mathworks, Inc., Natick, MA), specifically, the luminescentFloatCorrected.tif image from the Xenogen Living Image software was read into MATLAB for each image acquired. The images contained background luminescence, which generally varied slowly both in amplitude and location compared to the treated spots. On occasion, the transgenic mice used in this study demonstrated luminescence levels above the background, which appeared to emanate from deep within the animal due to its diffuse appearance at the surface. Additionally, the treated sites sometimes overlapped with regions of elevated luminescence. The luminescence background was estimated by block-processing the original 480 × 480 image with a 16 × 16 kernel (3.6 mm × 3.6 mm) with non-overlapping blocks, and finding the minimum over each kernel to estimate the background. The resulting 60 × 60 background estimate was then interpolated to 480 × 480 using bi-cubic spline interpolation and was subtracted from the original image before measurements were made on the treated spots. The 16 × 16 kernel size was found to be a good tradeoff for preserving features of interest in this study.
Luminesence from this particular strain of mouse demonstrated substantial and repeatable variation in luminescence amplitude between animals, consistent across the thorax and appendages, including the tail. To reduce variability, the luminescence signal from the tail was used as a normalizing factor for each mouse. The tail was chosen because it is well-isolated from the treatment sites and does not have an underlying background that could bias the measurement. A 1 cm region of the tail was selected for each animal and the peak luminescence was found for each image line perpendicular to the tail (i.e. radiance profile across the tail) and was averaged over 90 image lines to estimate the peak value. This average peak tail-radiance measure was then used to normalize background-subtracted radiance measurements from the treatment sites.
Each of the treatment sites was enclosed using a square 20 × 20 (4.5 mm × 4.5 mm) ROI and the peak and average intensities were calculated on the background-subtracted luminescence image using the selected ROI. The measurements were then normalized by the tail-radiance for each animal. The average and standard deviation values computed across all animals are reported (n=4). The significance of each time point with respect to the initial t=0 hour time point was tested by calculating a paired Student's t-test assuming a two-tailed distribution and equal variances. A p-value less than 0.05 was considered statistically significant. The spatial distribution of the luminescence signal across the spots was quantified by aligning the spots to one another using a correlation-based alignment algorithm. The profile was found through the center of the spot every 10 degrees for a total of 36 profiles for each spot at each time point. Each set of 36 profiles was averaged and statistics of the ‘average profile’ were calculated across animals. Significance of the resulting profiles between treatment intensities was tested at each spatial location using a paired t-test assuming a two-tailed distribution and equal variances.
2.5 Histology
HIFU heating was performed on a separate set of three Hsp70-luc2A-GFP Tg mice. The animals were sacrificed 6 h after HIFU heating, and skin samples were extracted and placed on a moist sponge stored in a histology boat. This was then placed in Tellyesniczky/Fekete fixative for 24 hours. The histology boat was stored in 70% ethanol prior to paraffin embedding. The tissue was cut through the center of the thermal damage region prior to embedding. Five 10 um sections were made with both hematoxylin and eosin (H&E) staining and Gomori's Trichrome staining (Gomori, 1950) for analysis. With Gomori's trichrome stain, the collagen and nuclei are stained blue, and the cytoplasm, erythrocyte and fibrin are stained pink to red. Tincture changes in Gomori's trichrome stain, e.g. blue to red, indicate zones of thermal damage (Mackanos et al., 2005).
2.6 Finite Element Simulation
Several theoretical models have been developed to predict the time course of heating in HIFU beams and to account for convection due to perfusion. Pennes' bioheat equation (Pennes, 1998) is the first and most widely used model that describes heating in biological tissues and is given by:
| (1), |
where T is the temperature rise above ambient level, κ is the thermal diffusivity, τ is the time constant for perfusion, ∇ is the spatial gradient operator, cv is the volume specific heat for the tissue, and qv is the heat source function (or rate of heat production per unit volume). The perfusion time constant can be written as τ = ρbcv/wcvb, where w is the blood perfusion rate in mass divided by volume and time, ρb is the density of blood and cvb is the volume specific heat of blood. Analytical solutions to (1) (Nyborg, 1988) have been found under simplified conditions for different beam geometries and applied to modeling focused-ultrasound heating in perfused tissue phantoms with reasonable experimental agreement (Swindell, 1984). Through analytical solutions to (1), it is readily seen that the perfusion term can be ignored if the heating duration is less than 3 seconds. Other theoretical and experimental investigations demonstrate that perfusion can be neglected for heating durations shorter than 2 seconds (Billard et al., 1990; Chen et al., 1993). For completeness, perfusion was included in the simulations with τ equal to 100 s and infinity (no perfusion).
Acoustic heating at the boundary between skin and an external coupling medium has been analyzed theoretically by Nyborg and Steele (Nyborg and Steele, 1983) and later by Curley (Curley, 1993). In the analyses, three different boundary conditions are considered, which include holding the temperature change to zero at the boundary, maintaining thermal continuity at the boundary, and setting thermal continuity to zero at the boundary (also known as an adiabatic boundary condition). In our preliminary studies (and supported by the histology presented below), we observed damage produced by ultrasound beginning at the stratum corneum or outer-most layer of the skin. Consequently, our observation justified including an adiabatic condition at this boundary, which gives an upper bound on the likely range of temperatures within the skin and at the stratum corneum.
The finite element simulations of temperature increases for this study were carried out using a model of the gel, skin, and underlying soft tissue under the zero perfusion assumption justified above. The finite-element analysis was carried out using the heat transfer and conduction module of COMSOL Multiphysics (v3.2, COMSOL, Inc., Palo Alto, CA). The mesh used for this study consisted of 15851 elements and is shown in figure 1 with four different regions labeled. The overall dimensions of the mesh are 10 mm tall and 5 mm wide, and axial symmetry was assumed to model a 10 mm tall cylinder with a 10 mm diameter. The gel standoff was modeled to be a 4.8 mm tall cylinder with a 5 mm diameter. The soft tissue was modeled to be a 4.8 mm tall cylinder with a 10 mm diameter. The skin layer shown in figure 1 is located between the gel and soft tissue, and is 400 microns thick and 10 mm in diameter. In order to approximate an adiabatic boundary condition, the top 15 microns of the skin layer is set to 0.01 times the thermal conductivity of skin. The space adjacent to the gel is modeled as static air.
Figure 1.
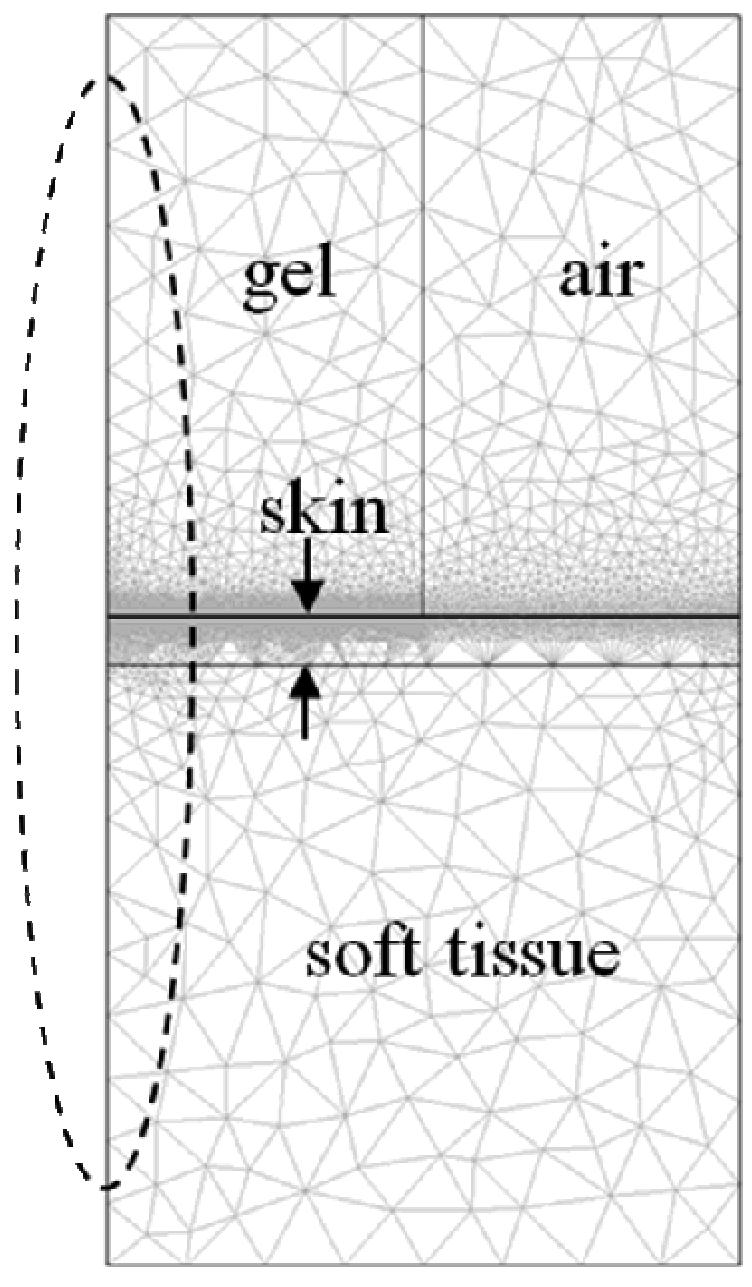
The finite-element mesh model used for the heating simulation consists of 15851 elements across 4 regions that include gel, skin, soft tissue, and air. The oval region indicates the location and approximate −3 dB beam intensity. Cylindrical symmetry is assumed around the left-most axis. The dimensions of the mesh shown are 1 cm in depth by 5 mm in width.
The ultrasound beam was simulated using Field II (Jensen, 2004; Jensen and Svendsen, 1992) for the same transducer geometry specified above. Field II simulates linear wave propagation. Near-field attenuation was neglected due to the low-loss water and gel standoff used to couple the acoustic energy to the surface of the skin. A plane wave assumption was assumed over the depth-of-field in order to simplify inclusion of depth-dependent attenuation in the beam intensity function. The beam dimensions obtained from the field simulation were equivalent to the dimensions measured experimentally. The simulated beam intensity was defined as an interpolated lookup table in COMSOL, which was used to create the heat-source function given by:
| (2), |
where α is the absorption coefficient with units of Np m−1, a is the amplitude attenuation coefficient in Np m−1, I(r,z) is the simulated intensity in cylindrical coordinates in units of W m−2, u(t) is the unit step function, and D is the heating duration. The amplitude attenuation coefficients used for soft tissue and skin were 0.087 Np cm−1 and 0.60 Np cm−1, respectively (assuming a 1.5 MHz transmitted frequency). It was assumed that absorption equals the attenuation for each region (α=a).
The thermal properties, acoustic absorption (at 1.5 MHz), and initial conditions for each region are summarized in Table 1. Perfusion was assumed to be uniform across all of the tissue and two cases were computed; one corresponding to moderately high perfusion using τ of 100 s and a second case without perfusion using τ equal to infinity. The transient solver was used with the direct (SPOOLES) linear system solver with a relative tolerance of 0.01 °C, an absolute tolerance of 0.001 °C, and an intermediate (as opposed to free) time stepping constraint. The overall temperature distribution across the mesh was allowed to achieve a pseudo-steady state condition by allowing it to settle for 10 s before applying the HIFU pulse in order to simulate the transient thermal effect of placing the applicator on skin. The final temporal sampling for the solution was 0.1 s; the higher temporal sampling was also tested with no significant change in the resulting temperatures. The temperature profiles were computed out to 5 s beyond the end of the heating pulse, which was sufficient for the temperatures to drop below 39 °C.
Table 1.
Parameters for finite-element simulation.
| Parameter | Value | Source |
|---|---|---|
| ρgel | 1030 kg m−3 | Parker Lab., Inc. |
| Cgel | 4200 J kg-1 K−1 | estimated |
| Kgel | 0.6 W m−1 K−1 | estimated |
| Tgel | 30 °C | measured |
| αgel | 0 Np m−1 | negligible |
| ρtiss | 1040 kg m−3 | (Valvano et al., 1984)* |
| Ctiss | 3500 J kg−1 K−1 | (Valvano et al., 1984)* |
| Ktiss | 0.518 W m−1 K−1 | (Valvano et al., 1984)* |
| Ttiss | 37 °C | measured |
| αtiss | 8.7 Np m−1 | # |
| ρskin | 1100 kg m−3 | (Bowman et al., 1975)* |
| Cskin | 3700 J kg−1 K−1 | (Bowman et al., 1975)* |
| Kskin | 0.37 W m−1 K−1 | (Bowman et al., 1975)* |
| Tskin | 33 °C | measured |
| αskin | 60 Np m−1 | (Duck, 1990) ^ |
| ρair | 1.2 kg m−3 | (Lide, 2007)@ |
| Cair | 1006 J kg−1 K−1 | (Lide, 2007)@ |
| Kair | 0.0257 W m−1 K−1 | (Lide, 2007)@ |
| Tair | 22 °C | measured |
denotes values obtained for rat species.
denotes value at 1.5 MHz assuming commonly accepted value of 0.5 dB cm−1 MHz−1.
denotes value at 1.5 MHz obtained by extrapolation from attenuation measured at 2.25 MHz and 10 MHz.
denotes value extrapolated for 22°C at 1 atm.
In addition to peak temperature, the thermal dose was also calculated using an Arrhenius-based thermal dose measure called Cumulative Equivalent Minutes relative to 43 °C (CEM43) (Sapareto and Dewey, 1984). The CEM43 dose was calculated numerically in MATLAB using the simulated temperatures.
3. Results
A white light image of two mice at 0 hours post-treatment (Figure 2) shows the insonified ROIs, the location for the tail normalization, and the slight raised and discolored regions, which are labeled on the leftmost mouse in order of increasing ultrasound intensity from 53 W cm−2 up to 352 W cm−2. At the highest intensities (regions labeled 3 and 4), insonation resulted in a reddened skin lesion with a diameter of approximately 1 mm, corresponding to the ultrasound beamwidth, surrounded by a thin raised white ring and a region of mild inflammation (with redness and slight swelling) that extended approximately 3 mm around the center.
Figure 2.
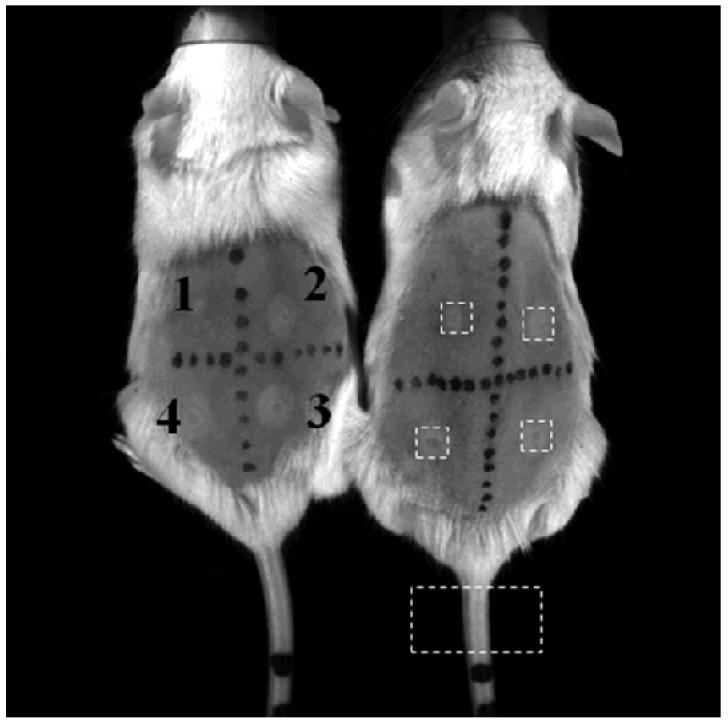
Photographs of two mice immediately after exposure to 53, 125, 227 and 352 W/cm2 corresponding to location 1, 2, 3, and 4, respectively. Black marks on mice are created using a permanent marker. The dashed white boxes surrounding the spots and tail indicate the ROI locations and size used in the post-processing. The lesions and discoloration are visible with the naked eye (lighter white circles).
An image of false color (figure 3) representing units of normalized radiance (where blue is the lowest and red is the highest) summarizes the results for the 4 ultrasound intensities (53, 125, 227 and 352 W cm−2) and the 6 time points (0, 6, 24, 48, 72, and 96 hours). Radiance, observed as a function of time from left to right (figure 3), peaks between 24 and 48 hours. For example, at the 48 hour time point for mouse 4, an ultrasound intensity of 53 W cm −2 produces a small luminescent region whereas an insonation with an intensity of 352 W cm−2 produces a ring with a diameter of 3 mm. At the lowest ultrasound intensity (53 W cm−2) the variation in luminescence between animals was greatest with a normalized spatial peak radiance ranging from 0.9 to 9.6 over the insonified region.
Figure 3.
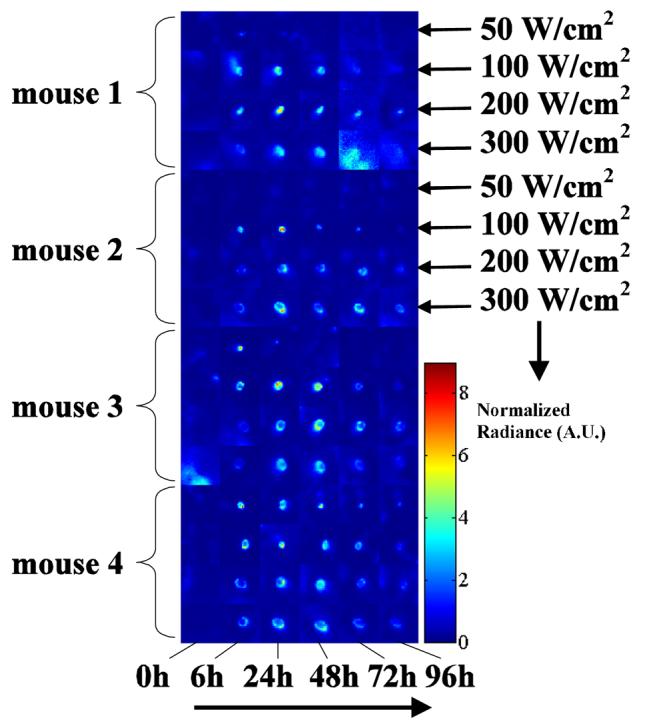
Post-processed luminescence ROI data from all 4 mice at each time point and at each power setting (as labeled on the right for the first two mice). The intensity scale is normalized to tail radiance in arbitrary units (A.U.).
The spatial peak radiance measured within each ROI and averaged across all animals was similar across the applied ultrasound intensities from 50 to 350 W cm−2 (figure 4). The t=0 hour time point (acquired 15 minutes after insonation) was considered to be the baseline measurement because Hsp70 upregulation is a relatively slow process, generally requiring at least 60 minutes to produce a detectable change over background. The significance of each time point relative to the initial time point was tested for both the peak and mean radiances, with all time points showing a significant increase from baseline at the 125, 227, and 352 W cm−2 intensities. At the lowest intensity of 53 W cm−2, there was substantial variability in the peak radiance at all time points and the average was not significantly higher than t=0 at any time point (thus confirming the observations made in figure 3). At the three highest intensities, the radiance peaks near 24 hours however, the peak radiance was significantly higher at 96 hours at the two highest intensities as compared to 125 W cm−2. The spatial mean of the normalized radiance within each ROI increased with increasing ultrasound intensity at most time points (figure 5), demonstrating the average Hsp70 expression within each region of interest. As described above for the peak radiance, the mean radiance was significantly increased as compared to the initial time point for intensities of 125, 227, and 352 W cm−2. For the two lowest transmitted intensities, radiance was similar from 6 to 48 hours. At the highest intensities, radiance was similar from 24 to 72 hours.
Figure 4.
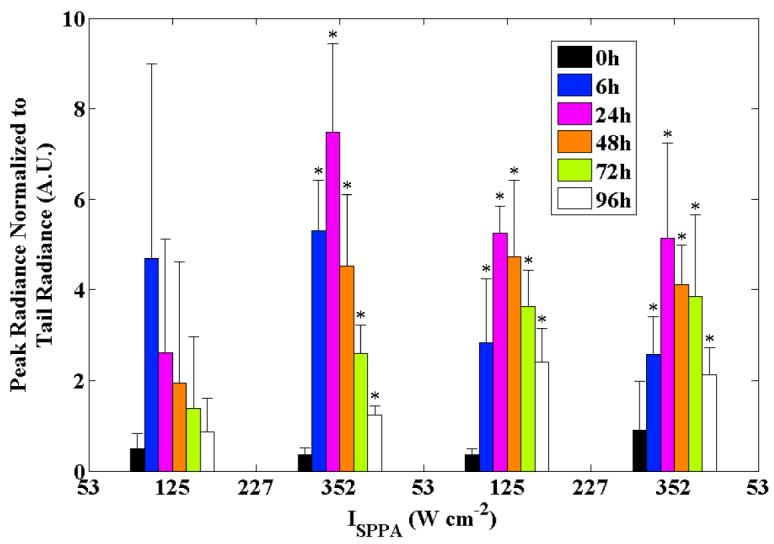
Peak normalized radiance in the insonified ROIs versus the time point (within groups) and intensity (across groups). Error bars are ±1 standard deviation (n=4); * indicates p<0.05 relative to baseline.
Figure 5.
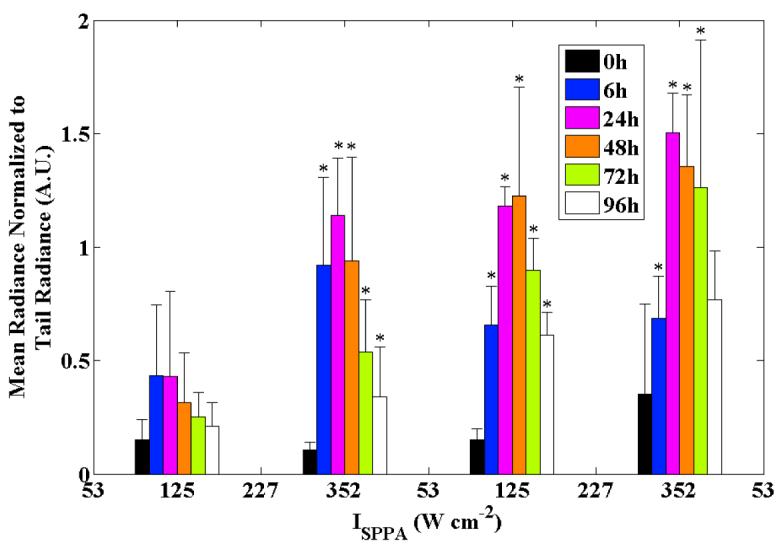
Mean normalized radiance in the insonified ROIs versus the time point (within groups) and intensity (across groups). Error bars are ±1 standard deviation (n=4); * indicates p<0.05 relative to baseline.
To illustrate the spatial-temporal evolution of the Hsp70 response and corresponding thermal prediction, figure 6 (a)-(c) shows a radiance versus distance profile across the center of the insonified region for 125 W cm−2 (black) and 352 W cm−2 (gray) at 24 h (a), 48 h (b), and 72 h (c). Corresponding temperature and CEM43 predictions are shown in figure 6 (d) and (e), respectively, with thermal boundary conditions across the skin of full and 1/100th thermal conductivity shown. With 125 W cm−2 insonation, radiance is unimodal, significantly exceeding the radiance of the 352 W cm−2 insonation at 24 hours within the center of the beam and decreasing twofold over 48 hours. A biomodal spatial profile was evident for 352 W cm−2 insonation at all three time points producing the ‘ring’ appearance evident in figure 3 and remaining nearly constant over the 48 hour interval shown in the three plots. Observing the tails of the radiance at distances greater than 0.5 mm from the center in figure 6(a) and 6(b), there are significant differences in the radiance between the two intensities. At this distance, the maximum predicted CEM43 exposure was below 1 minute at 352 W cm−2, yet even with this mild exposure, a significantly higher radiance was observed compared with 125 W cm−2 insonation where the predicted CEM43 was below 0.0001 minutes (p<0.05).
Figure 6.

Experimental radiance from images compared with theoretical predictions for the temperature increase and CEM43. (a)-(c). Average radiance profiles measured across ROIs at 24 h (a), 48 h (b), and 72 h (c) for 125 W cm−2 (black) and 352 W cm−2 (gray) ultrasound intensities. Error bars are ±1 standard deviation (n=4). * indicates p<0.05 between paired t-test at 125 W cm−2 and 352 W cm−2. Note the bimodal appearance at 352 W cm−2. (d) predicted temperature range at the center of the skin layer at t=11 s for 125 W cm−2 (black) and 352 W cm−2 (gray). The upper limit indicates 1/100th the thermal conductivity at the skin layer compared to the lower limit. (e) log10 of CEM43 for 125 W cm−2 (black) and 352 W cm−2 (gray). The range of (e) corresponds to the same limits as in (d).
The peak temperature ranges for 125 W cm−2 and 352 W cm−2 insonation were 45 °C to 48 °C and 65 °C to 76 °C, respectively, while the peak CEM43 values were 0.0 minutes to 0.2 minutes and 1.6×10⁴ min to 2.3×10⁷ min, respectively. With the very high temperature and thermal dose predicted for the 352 W cm−2 insonation, the data suggest that the Hsp70-luc response mechanism was impaired at the center of the ROI as compared to the 125 W cm−2 insonation. H&E, with a corresponding trichrome stain, demonstrated tincture changes relative to the control 6 hours after exposure, compared with a no ultrasound control (figure 7(a)), 125 W cm−2 insonation (figure 7(b)), and 352 W cm−2 insonation (figure 7(c)). With the intermediate intensity exposure, the damage extended from the stratum corneum, the outermost layer of the epidermis, through the epidermis and slightly into the dermis, but appeared to leave the large fat cells in the subcutis intact. In the intense exposure case, damage extended through the epidermis and dermis and into the fat cells of the subcutis, but appeared to leave the connective layer of tissue below the layer of fat cells intact.
Figure 7.
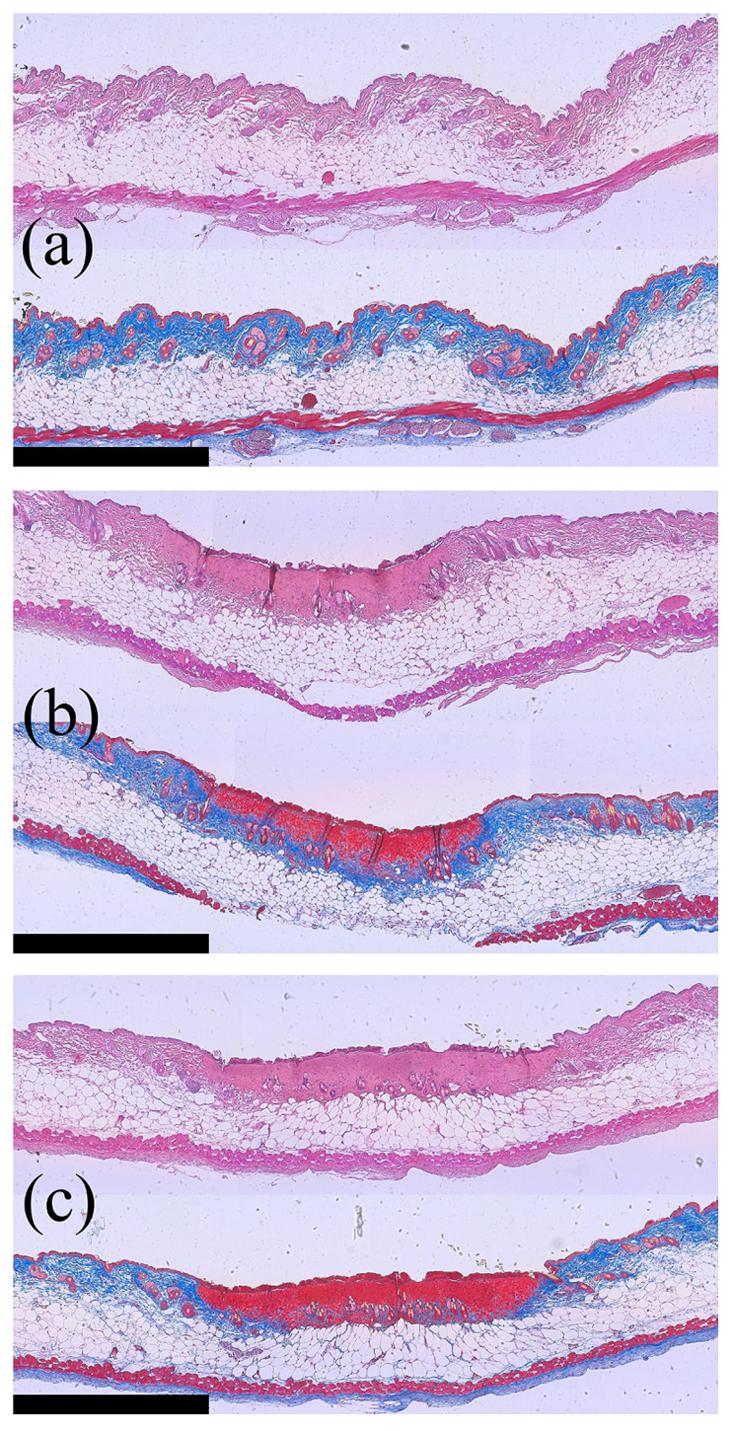
H&E (top) and Gomori's trichrome (bottom) stained tissue sections obtained from (a) control (no ultrasound) skin, (b) skin insonified with 125 W/cm2, and (c) skin insonified with 352 W/cm2. The scale bar is 1 mm wide. For the trichrome-stained sections, note the change from blue to red in the tissue at the edge of the skin as a function of intensity.
Assuming thermal continuity at the boundary, the estimated temperature in the skin and surrounding region at the end of the 1 s pulse for 53, 125, 227, and 352 W cm−2 is 38, 45, 54, and 65°C, respectively, as shown in figure 8(a). In each case, the peak temperature was located approximately at the center of the skin layer. The region immediately surrounding the treatment site is shown with isotherms drawn at 37 °C, 42 °C, and 50 °C. The corresponding CEM43 doses were 0.0, 0.0, 9.1, and 1.6×10⁴ min for 53, 125, 227, and 352 W cm−2, respectively as shown in figures 8(e)-(h). Results presented in figures 8 and 9 correspond to a perfusion value of τ of 100 s; when compared with the temperature elevation for τ of ∞, the temperature difference was less than 0.2 °C (data not shown).
Figure 8.

Finite-element simulations of temperature (a)-(d) and CEM43 (e)-(f) assuming thermal continuity at the skin surface corresponding to intensities of 53, 125, 227 and 352 W cm−2, respectively. Cross-sections are shown through the center of the heated cylindrical volume corresponding to the plane given by the finite-element mesh shown in figure 1 and clipped to ±2.5 mm above and below the center of the skin layer. Temperatures in (a)-(d) are estimated at the end of the heating pulse (t=11 s). Temperature isolines are drawn at 37 °C, 42 °C and 50 °C. The CEM43 color range is saturated at 100 min (red). Dashed lines indicate the upper and lower boundary of the 400 micron-thick skin layer.
Figure 9.

Finite-element simulations of temperature (a)-(d) and CEM43 (e)-(f) assuming reduced (1/100th) thermal conductivity at the skin surface showing cross-sections corresponding to intensities of 53, 125, 227 and 352 W cm−2, respectively. The cross-sections are through the center of the heated cylindrical volume corresponding to the plane given by the finite-element mesh shown in figure 1 and clipped to ±2.5 mm above and below the center of the skin layer. Temperatures in (a)-(d) are estimated at the end of the heating pulse (t=11 s). Temperature isolines are drawn at 37 °C, 42 °C and 50 °C. The CEM43 color range is saturated at 100 min (red). Dashed lines indicate the upper and lower boundary of the 400 micron-thick skin layer.
Assuming that a thin boundary prevents thermal energy from conducting into the acoustic coupling medium, the peak temperature occurs nearly at the skin boundary as shown in figure 9. As a function of increasing intensity, the predicted peak temperatures are 40 °C, 48 °C, 61 °C, and 76 °C and the corresponding CEM43 doses were 0, 0.2, 780, and 2.3×10⁷ min for 53, 125, 227, and 352 W cm−2, respectively as shown in figures 8(a)-(h). The lack of thermal loss into the gel at the skin surface layer is responsible for the concomitant increases in peak temperature and thermal dose compared to the thermal continuity case.
The results shown in figures 8 and 9 are qualitatively comparable to the data shown in figure 3. The predicted peak temperature rise ranging from 38 to 40 °C (thermal continuity to adiabatic) and the 0.0 CEM dose for the 53 W cm−2 intensity produced an inconsistent and small Hsp70 response, whereas the temperature rise of 45-48 °C and the 0.0-0.2 CEM43 dose for the 125 W cm−2 case appeared to stimulate Hsp70 as the data obtained for cell culture suggests (Beckham et al., 2004, figure 5). For the 227 and 352 W cm−2 exposures, the predicted peak temperature rise of 54-61°C and 65-76 °C, respectively, and the corresponding peak CEM43 ranging from 9.1 to 780 min and 1.6×10⁴ to 2.3×10⁷, respectively, suggest that the skin was likely ablated at the focus of the beam, which is supported by the experimental observations of reduced Hsp70 response in the center of the insonified region. The ring of peak Hsp70 expression approximately 0.2 to 0.4 mm from the center of the beam observed for the 227 W cm−2 and 352 W cm−2 insonations corresponds to the temperature range shown in figures 8 and 9 bounded by 42 °C and 50 °C at these intensities.
4. Discussion
This study demonstrates the application of short-duration, high-intensity ultrasound exposures for stimulation of Hsp70 upregulation in a Tg luciferase reporter mouse. Four exposure intensities were chosen for this study, which were based on preliminary unreported observations of a wide range of HIFU intensities. Consistent with the experimental and theoretical analyses presented, the severity of effects produced within the skin ranged from mild inflammation to ablation as a function of increasing intensity. The evidence presented suggests that a narrow intensity and temperature range exists for optimal stimulation of Hsp70 in the skin using ultrasound heating.
Clearly, the ultrasound exposures studied in this paper produced localized inflammation, which is particularly visible in figure 2. The 53 W cm−2 exposures did not produce detectable lesions, very slight inflammation was observed for 2 out of 4 animals and the insonified region could not be identified after 96 hours; similarly Hsp70 expression was observed only in these two animals. A thin white ring of likely inflammation surrounding the lesion was visible at 125 W cm−2 and higher. With the 227 and 352 W cm−2 intensities, a small lesion formed at the center of the insonified region and eventually a scab formed between 24-48 hours post-treatment. The finite-element simulation estimates temperature distributions that are consistent with the observed pattern of Hsp70 expression in the skin. Predicted temperatures in the 46-49°C range corresponding to 125 W cm−2 appeared to produce the most localized and intense Hsp70 expression. The ring of peak Hsp70 expression observed at 227 and 352 W cm−2 is consistent with the 42°C and 50°C isotherms shown in figures 7(c) and (d), and also appear to be co-located on the inner diameter with the fine white rings immediately surrounding the lesion, as seen in figure 2. The lesion formation observed was also consistent with temperatures above 50°C predicted in the simulation.
The predictions also show that significant heating should extend slightly into the underlying tissue for the highest intensities; however, we did not observe damage such as protein denaturation in underlying tissue. One possible explanation is that the rapid lesion formation on the skin significantly increases attenuation of the focused-ultrasound beam, thus preventing significant heating of the deepest layers of skin. The simulation neglected the effects of nonlinear propagation of the acoustic wave, the higher harmonics of which can contribute significantly to heating as the acoustic pressure increases (Bacon and Carstensen, 1990). Hsp70 expression appeared to be maximized near 2 MPa peak-negative pressure (corresponding to the 125 W cm−2 intensity), a scenario under which the harmonic contribution to heating is relatively small. The simulation also neglected the effects of acoustic impedance mismatch between the gel, skin, and soft tissue. The mismatch between the skin and gel is typically not significant since the gel is specifically designed for this purpose. Though the boundary was always thoroughly wetted before applying the coupling gel and HIFU, micron-sized pockets of air in the stratum corneum could significantly modify the acoustic impedance at the boundary.
Sonoporation in the skin produced by kiloHertz to megaHertz ultrasound is commonly thought to be caused by cavitation in the fluid layer between the ultrasound transducer and the skin surface (Tezel and Mitragotri, 2003). A recent analysis by Lavon et al. (Lavon et al., 2007) postulates that cavitation caused by air bubbles trapped within the stratum corneum may be responsible for a significant fraction of the permeability observed in sonoporation. Recent findings by Paliwal et al. (Paliwal et al., 2006) show that 20 kHz ultrasound increases the frequency and occurrence of lacunae within the stratum corneum, which supports the hypothesis that cavitating air bubbles also exist within the stratum corneum. In either case, air bubbles oscillating in ultrasound fields are known to significantly enhance the deposition of acoustic energy in the form of heat (Coussios and Roy, 2008). More studies are needed to determine the potential role of cavitation and air-bubble entrapment within the stratum corneum in localized heating.
The sharp demarcation of the luminescent indicator of Hsp expression in the in vivo optical image indicates that the expression was in the skin rather than within the deeper tissue, which would result in a more diffuse change in radiance due to scattering. This observation is also supported by the histology. Also, in preliminary experiments, animals were euthanized after HIFU heating and the skin was excised to expose underlying tissue (data not shown). No significant increase in radiance was observed for tissue below the skin. Furthermore, lesion formation or inflammation was not apparent in the underlying tissue for any of the intensities used. Preferential heating of the skin may be explained by a combination of a significantly higher acoustic absorption of the skin relative to surrounding tissue and by an adiabatic boundary condition that may exist due to the stratum corneum.
The peak temperature achieved in the aforementioned experiment is not easily measured in the skin. The spatial resolution of MRI thermometry is on the order of 1-10 mm3 and a temporal resolution on the order of 1-10 seconds, and is therefore, inadequate for the requirements of this study. An alternative method to measure temperature is based on a thermocouple; however, the temperature change within the skin of the transgenic mouse is not accurately assessed with a thermocouple due to the thinness of the tissue relative to much larger thermocouple needles. Thermocouples also exhibit viscous heating artifact resulting in erroneous temperature measurements in ultrasound beams (Drewniak et al., 1990; Parker, 1985). Such errors can be reduced by choosing very small thermocouple wires that are much smaller than the acoustic wavelength (Clarke and ter Haar, 1997), and by making the measurement approximately 1 second after the ultrasound is turned off (Parker, 1985; Clarke and ter Haar, 1997).
The data presented in this study were preceded by several experiments aimed at titrating the exposure threshold for stimulating Hsp70 in this transgenic mouse (data not shown). As shown here, peak intensities of 14 and 32 W cm−2 failed to stimulate Hsp70 production above background levels for 1 second exposure durations. Longer exposures at lower intensities did, however, stimulate Hsp70. For example, a 10 second exposure at 32 W cm−2 peak intensity stimulated a similar level of Hsp70 expression as that observed for the 1 second exposure at 53 W cm−2, and in each case histological evidence of damage was not observed. A 5 second exposure at 53 W cm−2 produced expression and damage similar to the 1 second exposure at 125 W cm−2. Further study will be needed to determine if Hsp70 levels as indicated by luciferase will correlate with thermal dose indices such as CEM43.
One study by Dyson and Luke (Dyson and Luke, 1986) looked at the effect of various ultrasound exposures on mast cell degranulation in the skin. Their results indicate that ultrasound heating of the skin to a temperature of 45 °C leads to mast cell deregulation, but the precise mechanism for ultrasonically induced degranulation is still not clear. The method for ultrasonic exposure used in their work was significantly different that that used in this work, which makes a direct comparison difficult.
Studying the heat-shock response in the skin has other potential applications to other, skin-related soft tissues including muscle. All skin appendages form from epithelia interaction with mesenchymal stem cells (Widelitz et al., 1997), and include hair, nails, sebaceous glands, sweat glands, and mammary glands. The accessibility of mammary glands makes them a good candidate for augmenting classical chemotherapy with ultrasound-hyperthermia, yet little is known about the mechanism by which ultrasound-hyperthermia enhances vascular permeability to chemotherapeutic molecules. It is well known that inflammation and associated immune response play an important role in modulating vascular permeability (Kubes and Gaboury, 1996). Studying the effects of ultrasound-hyperthermia in the skin on Hsp70 expression and other variables related to inflammation may be useful for optimizing cancer therapies, for delivering large therapeutic molecules, and for drug delivery vehicles.
5. Conclusion
It was demonstrated that 1-second duration HIFU exposures can stimulate Hsp70 production in the skin in a localized and controlled manner. The Hsp70 levels were found to peak 24 to 48 hours after the HIFU exposure. Elevated levels were still observed to be present at 96 hours. The results of this study indicated that short-duration insonation may be useful in generating HSP70 and that the period between treatments needs to be greater than 96 hours. A combination of evidence from experiments and simulations suggest that there is an optimal exposure level for stimulating Hsp70 in the skin. Knowledge of ultrasound stimulation of Hsp70 in vivo may facilitate developing cancer therapies based on HIFU hyperthermia.
Acknowledgements
This research was funded by NIH CA 103828 and a grant from the U.S. Department of Defense: The Medical Free Electron Laser Program administered by the Air Force Office of Sponsored Research, grant number FA9550-04-1-0045.
References
- Bacon DR, Carstensen EL. Increased Heating by Diagnostic Ultrasound Due to Nonlinear Propagation. J Acoust Soc Am. 1990;88:26–34. doi: 10.1121/1.399950. [DOI] [PubMed] [Google Scholar]
- Beckham JT, Mackanos MA, Crooke C, Takahashi T, O'Connell-Rodwell C, Contag CH, Jansen ED. Assessment of cellular response to thermal laser injury through bioluminescence imaging of heat shock protein 70. Photochem Photobiol. 2004;79:76–85. [PubMed] [Google Scholar]
- Billard BE, Hynynen K, Roemer RB. Effects of Physical Parameters on High-Temperature Ultrasound Hyperthermia. Ultrasound Med Biol. 1990;16:409–20. doi: 10.1016/0301-5629(90)90070-s. [DOI] [PubMed] [Google Scholar]
- Bowman HF, Cravalho EG, Woods M. Theory, Measurement, and Application of Thermal Properties of Biomaterials. Ann Rev Biophys Bio. 1975;4:43–80. doi: 10.1146/annurev.bb.04.060175.000355. [DOI] [PubMed] [Google Scholar]
- Calderwood SK, Asea A. Targeting HSP70-induced thermotolerance for design of thermal sensitizers. Int J Hyperther. 2002;18:597–608. doi: 10.1080/0265673021000019666. [DOI] [PubMed] [Google Scholar]
- Chen LL, Rivens I, Terhaar G, Riddler S, Hill CR, Bensted JPM. Histological-Changes in Rat-Liver Tumors Treated with High-Intensity Focused Ultrasound. Ultrasound Med Biol. 1993;19:67–74. doi: 10.1016/0301-5629(93)90019-k. [DOI] [PubMed] [Google Scholar]
- Ciocca DR, Calderwood SK. Heat shock proteins in cancer: diagnostic, prognostic, predictive, and treatment implications. Cell Stress Chaperon. 2005;10:86–103. doi: 10.1379/CSC-99r.1. [DOI] [PMC free article] [PubMed] [Google Scholar]
- Clarke RL, ter Haar GR. Temperature rise recorded during lesion formation by high-intensity focused ultrasound. Ultrasound Med Biol. 1997;23:299–306. doi: 10.1016/s0301-5629(96)00198-6. [DOI] [PubMed] [Google Scholar]
- Clement GT. Perspectives in clinical uses of high-intensity focused ultrasound. Ultrasonics. 2004;42:1087–93. doi: 10.1016/j.ultras.2004.04.003. [DOI] [PubMed] [Google Scholar]
- Contag CH, Bachmann MH. Advances in in vivo bioluminescence imaging of gene expression. Annu Rev Biomed Eng. 2002;4:235–60. doi: 10.1146/annurev.bioeng.4.111901.093336. [DOI] [PubMed] [Google Scholar]
- Coussios CC, Roy RA. Applications of acoustics and cavitation to noninvasive therapy and drug delivery. Annu Rev Fluid Mech. 2008;40:395–420. [Google Scholar]
- Curley MG. Soft-Tissue Temperature Rise Caused by Scanned, Diagnostic Ultrasound. IEEE T Ultrason Ferr. 1993;40:59–66. doi: 10.1109/58.184999. [DOI] [PubMed] [Google Scholar]
- Dahl O, Dalene R, Schem BC, Mella O. Status of clinical hyperthermia. Acta Oncol. 1999;38:863–73. doi: 10.1080/028418699432554. [DOI] [PubMed] [Google Scholar]
- Dewhirst MW, Prosnitz L, Thrall D, Prescott D, Clegg S, Charles C, MacFall J, Rosner G, Samulski T, Gillette E, LaRue S. Hyperthermic treatment of malignant diseases: Current status and a view toward the future. Semin Oncol. 1997;24:616–25. [PubMed] [Google Scholar]
- Diederich CJ, Hynynen K. Ultrasound technology for hyperthermia. Ultrasound Med Biol. 1999;25:871–87. doi: 10.1016/s0301-5629(99)00048-4. [DOI] [PubMed] [Google Scholar]
- Drewniak JL, Frizzell LA, Dunn F. Errors resulting from finite beamwidth and sample dimensions in the determination of the ultrasonic absorption coefficient. J Acoust Soc Am. 1990;88:967–77. [Google Scholar]
- Duck FA. Physical Properties of Tissue. Academic Press Inc.; San Diego: 1990. [Google Scholar]
- Dyson M, Luke DA. Induction of Mast Cell Degranulation in Skin by Ultrasound. IEEE T Ultrason Ferr. 1986;33:194–201. doi: 10.1109/t-uffc.1986.26814. [DOI] [PubMed] [Google Scholar]
- Fennessy FM, Tempany CM. MRI-guided focused ultrasound surgery of uterine leiomyomas. Acad Radiol. 2005;12:1158–66. doi: 10.1016/j.acra.2005.05.018. [DOI] [PubMed] [Google Scholar]
- Fennessy FM, Tempany CM, McDannold NJ, So MJ, Hesley G, Gostout B, Kim HS, Holland GA, Sarti DA, Hynynen K, Jolesz FA, Stewart EA. Uterine leiomyomas: MR imaging-guided focused ultrasound surgery - Results of different treatment protocols. Radiology. 2007;243:885–93. doi: 10.1148/radiol.2433060267. [DOI] [PubMed] [Google Scholar]
- Fields S, Dunn F. Correlation of Echographic Visualizability of Tissue with Biological Composition and Physiological State. J Acoust Soc Am. 1973;54:809–11. doi: 10.1121/1.1913668. [DOI] [PubMed] [Google Scholar]
- Gomori G. Aldehyde-fuchsin: a new stain for elastic tissue. Am J Clin Pathol. 1950;20:665–6. [PubMed] [Google Scholar]
- Goss SA, Dunn F. Ultrasonic Propagation Properties of Collagen. Phys Med Biol. 1980;25:827–37. doi: 10.1088/0031-9155/25/5/001. [DOI] [PubMed] [Google Scholar]
- Goss SA, Frizzell LA, Dunn F. Ultrasonic absorption and attenuation in mammalian tissues. Ultrasound Med Biol. 1979;5:181–6. doi: 10.1016/0301-5629(79)90086-3. [DOI] [PubMed] [Google Scholar]
- Guilhon E, Quesson B, Moraud-Gaudry F, de Verneuil H, Canioni P, Salomir R, Voisin P, Moonen CT. Image-guided control of transgene expression based on local hyperthermia. Mol Imaging. 2003;2:11–7. doi: 10.1162/15353500200302151. [DOI] [PubMed] [Google Scholar]
- Harari PM, Hynynen KH, Roemer RB, Anhalt DP, Shimm DS, Stea B, Cassady JR. Development of scanned focussed ultrasound hyperthermia: clinical response evaluation. Int J Radiat Oncol. 1991;21:831–40. doi: 10.1016/0360-3016(91)90705-9. [DOI] [PubMed] [Google Scholar]
- Hindley J, Gedroyc WM, Regan L, Stewart E, Tempany C, Hynnen K, Macdanold N, Inbar Y, Itzchak Y, Rabinovici J, Kim K, Geschwind JF, Hesley G, Gostout B, Ehrenstein T, Hengst S, Sklair-Levy M, Shushan A, Jolesz F. MRI guidance of focused ultrasound therapy of uterine fibroids: Early results. Am J Roentgenol. 2004;183:1713–9. doi: 10.2214/ajr.183.6.01831713. [DOI] [PubMed] [Google Scholar]
- Hynynen K, McDannold N. MRI guided and monitored focused ultrasound thermal ablation methods: a review of progress. Int J Hyperther. 2004;20:725–37. doi: 10.1080/02656730410001716597. [DOI] [PubMed] [Google Scholar]
- Ichizuka K, Ando S, Ichihara M, Ishikawa T, Uchiyama N, Sasaki K, Umemura S, Matsuoka R, Sekizawa A, Okai T, Akabane T, Kushima M. Application of high-intensity focused ultrasound for umbilical artery occlusion in a rabbit model. Ultrasound Obst Gyn. 2007;30:47–51. doi: 10.1002/uog.4008. [DOI] [PubMed] [Google Scholar]
- Jensen JA. Simulation of advanced ultrasound systems using Field II. IEEE Int Symp Biomed Imaging: Nano to Macro, 2004. 2004;1:636–9. [Google Scholar]
- Jensen JA, Svendsen NB. Calculation of pressure fields from arbitrarily shaped, apodized, and excited ultrasound transducers. IEEE T Ultrason Ferr. 1992;39:262–7. doi: 10.1109/58.139123. [DOI] [PubMed] [Google Scholar]
- Jones EL, Prosnitz LR, Dewhirst MW, Marcom PK, Hardenbergh PH, Marks LB, Brizel DM, Vujaskovic Z. Thermochemoradiotherapy improves oxygenation in locally advanced breast cancer. Clin Cancer Res. 2004;10:4287–93. doi: 10.1158/1078-0432.CCR-04-0133. [DOI] [PubMed] [Google Scholar]
- Kong G, Braun RD, Dewhirst MW. Characterization of the effect of hyperthermia on nanoparticle extravasation from tumor vasculature. Cancer Res. 2001;61:3027–32. [PubMed] [Google Scholar]
- Kremkau FW. Molecular Absorption of Ultrasound in Biological Tissues. News Physiol Sci. 1989;4:26–9. [Google Scholar]
- Kubes P, Gaboury JP. Rapid mast cell activation causes leukocyte-dependent and -independent permeability alterations. Am J Physiol. 1996;271:H2438–46. doi: 10.1152/ajpheart.1996.271.6.H2438. [DOI] [PubMed] [Google Scholar]
- Lavon I, Grossman N, Kost J, Kimmel E, Enden G. Bubble growth within the skin by rectified diffusion might play a significant role in sonophoresis. J Control Release. 2007;117:246–55. doi: 10.1016/j.jconrel.2006.10.027. [DOI] [PubMed] [Google Scholar]
- Lide DR, editor. The CRC Handbook of Chemistry and Physics, Internet Version 2007. 87th Edition. Taylor and Francis; Boca Raton, FL: 2007. < http://www.hbcpnetbase.com>. [Google Scholar]
- Liu YB, Kon T, Li CY, Zhong P. High intensity focused ultrasound-induced gene activation in solid tumors. J Acoust Soc Am. 2006;120:492–501. doi: 10.1121/1.2205129. [DOI] [PMC free article] [PubMed] [Google Scholar]
- Lyons ME, Parker KJ. Absorption and attenuation in soft-tissues. II. Experimental results. IEEE T Ultrason Ferr. 1988;35:511–21. doi: 10.1109/58.4189. [DOI] [PubMed] [Google Scholar]
- Mackanos MA, Contag CH. 2007. unpublished.
- Mackanos MA, Kozub JA, Hachey DL, Joos KM, Ellis DL, Jansen ED. The effect of free-electron laser pulse structure on mid-infrared soft-tissue ablation: biological effects. Phys Med Biol. 2005;50:1885–99. doi: 10.1088/0031-9155/50/8/017. [DOI] [PubMed] [Google Scholar]
- Madio DP, van Gelderen P, DesPres D, Olson AW, de Zwart JA, Fawcett TW, Holbrook NJ, Mandel M, Moonen CT. On the feasibility of MRI-guided focused ultrasound for local induction of gene expression. J Magn Reson Imaging. 1998;8:101–4. doi: 10.1002/jmri.1880080120. [DOI] [PubMed] [Google Scholar]
- Miller DL, Bao SP, Gies RA, Thrall BD. Ultrasonic enhancement of gene transfection in murine melanoma tumors. Ultrasound Med Biol. 1999;25:1425–30. doi: 10.1016/s0301-5629(99)00105-2. [DOI] [PubMed] [Google Scholar]
- Needham D, Anyarambhatla G, Kong G, Dewhirst MW. A new temperature-sensitive liposome for use with mild hyperthermia: Characterization and testing in a human tumor xenograft model. Cancer Res. 2000;60:1197–201. [PubMed] [Google Scholar]
- Nyborg WL. Solutions of the bio-heat transfer equation. Phys Med Biol. 1988;33:785–92. doi: 10.1088/0031-9155/33/7/002. [DOI] [PubMed] [Google Scholar]
- Nyborg WL, Steele RB. Temperature Elevation in a Beam of Ultrasound. Ultrasound Med Biol. 1983;9:611–20. doi: 10.1016/0301-5629(83)90006-6. [DOI] [PubMed] [Google Scholar]
- O'Connell-Rodwell CE, Burns SM, Bachmann MH, Contag CH. Bioluminescent indicators for in vivo measurements of gene expression. Trends Biotechnol. 2002;20:S19–S23. [Google Scholar]
- O'Connell-Rodwell CE, Mackanos MA, Simanovskii DM, Cao YA, Bachmann MH, Schwettman HA, Contag CH. In Vivo Analysis of Hsp70 Induction Following Pulsed Laser Irradiation in a Transgenic Reporter Mouse. J Biomed Opt. 2008;13:030501. doi: 10.1117/1.2904665. [DOI] [PubMed] [Google Scholar]
- Paliwal S, Menon GK, Mitragotri S. Low-frequency sonophoresis: Ultrastructural basis for stratum corneum permeability assessed using quantum dots. J Invest Dermatol. 2006;126:1095–101. doi: 10.1038/sj.jid.5700248. [DOI] [PubMed] [Google Scholar]
- Parker KJ. Effects of heat conduction and sample size on ultrasonic absorption measurements. J Acoust Soc Am. 1985;77:719–25. doi: 10.1121/1.392340. [DOI] [PubMed] [Google Scholar]
- Parker KJ. The Contribution of Absorption to Tissue Attenuation. J Acoust Soc Am. 1987;81:S71–S. [Google Scholar]
- Pennes HH. Analysis of tissue and arterial blood temperatures in the resting human forearm. 1948. J Appl Physiol. 1998;85:5–34. doi: 10.1152/jappl.1998.85.1.5. [DOI] [PubMed] [Google Scholar]
- Rabinovici J, Inbar Y, Revel A, Zalel Y, Gomori JM, Itzchak Y, Schiff E, Yagel S. Clinical improvement and shrinkage of uterine fibroids after thermal ablation by magnetic resonance-guided focused ultrasound surgery. Ultrasound Obst Gyn. 2007;30:771–7. doi: 10.1002/uog.4099. [DOI] [PubMed] [Google Scholar]
- Rosenthal I, Sostaric JZ, Riesz P. Sonodynamic therapy - a review of the synergistic effects of drugs and ultrasound. Ultrason Sonochem. 2004;11:349–63. doi: 10.1016/j.ultsonch.2004.03.004. [DOI] [PubMed] [Google Scholar]
- Sapareto SA, Dewey WC. Thermal Dose Determination in Cancer-Therapy. Int J Radiat Oncol. 1984;10:787–800. doi: 10.1016/0360-3016(84)90379-1. [DOI] [PubMed] [Google Scholar]
- Silcox CE, Smith RC, King R, McDannold N, Bromley P, Walsh K, Hynynen K. MRI-guided ultrasonic heating allows spatial control of exogenous luciferase in canine prostate. Ultrasound Med Biol. 2005;31:965–70. doi: 10.1016/j.ultrasmedbio.2005.03.009. [DOI] [PubMed] [Google Scholar]
- Sun Y, Sugawara M, Mulkern RV, Hynynen K, Mochizuki S, Albert M, Zuo CS. Simultaneous measurements of temperature and pH in vivo using NMR in conjunction with TmDOTP5- NMR Biomed. 2000;13:460–6. doi: 10.1002/nbm.676. [DOI] [PubMed] [Google Scholar]
- Swindell W. The temperature fields caused by acoustic standing waves in biological tissues. Brit J Radiol. 1984;57:167–8. doi: 10.1259/0007-1285-57-674-167. [DOI] [PubMed] [Google Scholar]
- Tempany CMC, Stewart EA, McDannold N, Quade BJ, Jolesz FA, Hynynen K. MR imaging-guided focused ultrasound surgery of uterine leiomyomas: A feasibility study. Radiology. 2003;226:897–905. doi: 10.1148/radiol.2271020395. [DOI] [PubMed] [Google Scholar]
- Tezel A, Mitragotri S. Interactions of inertial cavitation bubbles with stratum corneum lipid bilayers during low-frequency sonophoresis. Biophys J. 2003;85:3502–12. doi: 10.1016/S0006-3495(03)74770-5. [DOI] [PMC free article] [PubMed] [Google Scholar]
- Vallancien G, Chartierkastler E, Bataille N, Chopin D, Harouni M, Bougaran J. Focused Extracorporeal Pyrotherapy. Euro Urol. 1993;23:48–52. doi: 10.1159/000474680. [DOI] [PubMed] [Google Scholar]
- Valvano JW, Allen JT, Bowman HF. The Simultaneous Measurement of Thermal-Conductivity, Thermal-Diffusivity, and Perfusion in Small Volumes of Tissue. J Biomech Eng-T Asme. 1984;106:192–7. doi: 10.1115/1.3138482. [DOI] [PubMed] [Google Scholar]
- van der Zee J. Heating the patient: a promising approach? Ann Oncol. 2002;13:1173–84. doi: 10.1093/annonc/mdf280. [DOI] [PubMed] [Google Scholar]
- Widelitz RB, Jiang TX, Noveen A, Ting-Berreth SA, Yin E, Jung HS, Chuong CM. Molecular histology in skin appendage morphogenesis. Microsc Res Techniq. 1997;38:452–65. doi: 10.1002/(SICI)1097-0029(19970815)38:4<452::AID-JEMT13>3.0.CO;2-I. [DOI] [PubMed] [Google Scholar]
- Wilson N, McArdle A, Guerin D, Tasker H, Wareing P, Foster CS, Jackson MJ, Rhodes LE. Hyperthermia to normal human skin in vivo upregulates heat shock proteins 27, 60, 72i and 90. J Cutan Pathol. 2000;27:176–82. doi: 10.1034/j.1600-0560.2000.027004176.x. [DOI] [PubMed] [Google Scholar]
- Wu J, Pepe J, Rincon M. Sonoporation, anti-cancer drug and antibody delivery using ultrasound. Ultrasonics. 2006;44:E21–E5. doi: 10.1016/j.ultras.2006.06.033. [DOI] [PubMed] [Google Scholar]
- Wust P, Hildebrandt B, Sreenivasa G, Rau B, Gellermann J, Riess H, Felix R, Schlag PM. Hyperthermia in combined treatment of cancer. Lancet Oncol. 2002;3:487–97. doi: 10.1016/s1470-2045(02)00818-5. [DOI] [PubMed] [Google Scholar]
- Xu Z, Ludomirsky A, Eun LY, Hall TL, Tran BC, Fowlkes JB, Cain CA. Controlled ultrasound tissue erosion. IEEE T Ultrason Ferr. 2004;51:726–36. doi: 10.1109/tuffc.2004.1308731. [DOI] [PMC free article] [PubMed] [Google Scholar]