

Abstract
The fat-1 gene, derived from C. elegans, encodes for a fatty acid n-3 desaturase. In order to study the potential metabolic benefits of n-3 fatty acids, independent of dietary fatty acids, we developed 7 lines of fat-1 transgenic mice (C57/BL6) controlled by the regulatory sequences of the adipocyte protein-2 (aP2) gene for adipocyte specific expression (AP-lines). We were unable to obtain homozygous fat-1 transgenic offspring from the two highest expressing lines, suggesting that excessive expression of this enzyme may be lethal during gestation. Serum fatty acid analysis of fat-1 transgenic mice (AP-3) fed a high n-6 unsaturated fat (HUSF) diet had an n-6/n-3 fatty acid ratio reduced by 23% (p< 0.025) and the n-3 fatty acid eicosapentaenoic acid (EPA) concentration increased by 61% (p< 0.020). Docosahexaenoic acid (DHA) was increased by 19 % (p< 0.015) in white adipose tissue. Male AP-3-fat-1 line of mice had improved glucose tolerance and reduced body weight with no change in insulin sensitivity when challenged with a high-carbohydrate (HC) diet. In contrast, the female AP-3 mice had reduced glucose tolerance and no change in insulin sensitivity or body weight. These findings indicate that male transgenic fat-1 mice have improved glucose tolerance likely due to increased insulin secretion while female fat-1 mice have reduced glucose tolerance compared to wild-type mice. Finally the inability of fat-1 transgenic mice to generate homozygous offspring suggests that prolonged exposure to increased concentrations of n-3 fatty acids may be detrimental to reproduction.
Keywords: fat-1 omega-3 fatty acid desaturase, Adipose tissue specific transgenic mice, Glucose homeostasis, Body weight, Gestational lethality
Fish oil is recommended for cardiovascular health [Bhatnagar et al., 2003], whereas diets rich in saturated fatty acids (FAs) and a high ratio of dietary n-6 to n-3 polyunsaturated fatty acids (PUFAs) may contribute to the increasing prevalence of heart disease and diabetes [La Guardia et al., 2005; Levinson et al., 1990; Leaf et al., 2001; Adler et al., 1994]. The most potent n-3 fatty acids with healthful properties are the long chain PUFAs, including eicosapentaenoic acid (EPA-20:5n-3) and docosahexaenoic acid (DHA-22:6n-3), which locate in the C2-position of triglycerides in marine fish oil. In contrast, animal derived fats contain mostly saturated FAs, monounsaturated FAs, and the n-6 PUFA arachidonic acid (AA-20:4n-6); also, common vegetable oils are rich in n-6 PUFAs, particularly linoleic acid (LE-18:2n-6). The n-3 fatty acid desaturase required for synthesizing the beneficial n-3 FAs from linoleic acid exists only in some plants, C. elegans and primitive organisms such as sea plankton, which is the original source of fish oil n-3 PUFAs from the food chain.
The n-3 desaturase encoded by the gene fat-1 of C. elegans is an integral membrane protein, whose substrate is n-6 fatty acids at the 2-position of phospholipids in cellular membrane [Spychalla et al., 1997; Pugh et al., 1977]. The enzyme converts LE-18:2n-6 and AA-20:4n-6 to α-linolenic acid (ALN-18:3n-3) and EPA-20:5n-3, respectively [Spychalla et al., 1997] (Fig. 1). The shorter chain n-3 fatty acid ALN may not be efficiently converted to EPA and DHA, as the required elongases and desaturases are not highly active in carnivores [German et al., 1996]. In mammals, the conversion of EPA into DHA occurs through the Sprecher pathway consisting of two elongations (to produce a 24-carbon fatty acid) followed by a desaturation with delta(6)-desaturases (D6D), and finally a β-oxidation step (to shorten the chain length by 2-carbons) [Voss et al., 1991]. A transgenic mouse model made with a CMV (enhancer)/β-actin promoter expressing the fat-1 cDNA increased the ratio of n-3 and n-6 fatty acids in various tissues [Kang et al., 2004]. These same fat-1 transgenic mice had a reduction of melanoma formation and growth [Xia et al., 2006], reduced colitis-associated colon cancer [Jia et al., 2008], and were protected from diseases with excessive inflammatory responses [Schmocker et al., 2007; Bhattacharya et al., 2006; Hudert et al., 2006]. However, to our knowledge, no study of glucose homeostasis has been reported from these mice. While increasing the ratio of dietary n-3 to n-6 PUFAs is suggested to be beneficial for the prevention and treatment of dyslipidemia, coronary heart disease [Middaugh, 1990; La Guardia et al., 2005], obesity, insulin resistance [Storlien et al., 1987; Neschen et al., 2002; Jucker et al., 1999], impaired glucose tolerance, and diabetes [Adler et al., 1994; Storlien et al., 1987], it is difficult to ascertain the contribution of certain n-3 PUFAs per se, without the potential confounding effects of other dietary components. Diet-based studies evaluating intake of fish and fish oil suffer from the potentially confounding effects concerning the fish proteins, and the heterogeneity and possible modification of the fatty acids contained in the oils. Also, in both human and animal studies, the major sources of n-3 and n-6 PUFA are from fish oil and vegetable oil, respectively. Such sources are rich in 20- and 22- carbon n-3 PUFAs or 16- and 18-carbon n-6 PUFAs, yet FAs with varying chain-length and unsaturation are not freely converted among each other [Burdge et al., 2002a; Burdge et al., 2002b; Burdge et al., 2003]. Indeed, while it is generally accepted that fish oil improves the serum lipid profile, it is controversial whether dietary flaxseed oil (containing mostly ALN-18:3n-3) has a similar effect [Pfrommer et al., 2006; Prasad, 1997].
Fig. 1.
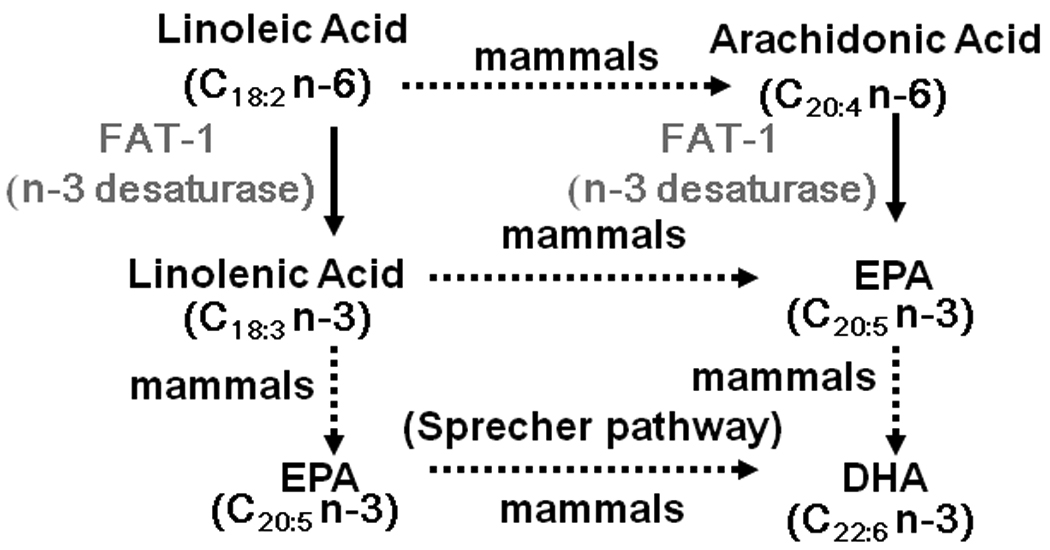
The expected pathway of converting n-6 and n-3 fatty acids to EPA and DHA via the fat-1 desaturase enzyme combined with mammalian enzymes. The dotted arrow denotes that the shorter chain n-3 fatty acid ALN may not be efficiently converted to EPA and DHA, as the required elongases and desaturases are not highly active in carnivores [German et al., 1996]. Also, in mammals the conversion of EPA into DHA occurs through the Sprecher pathway consisting of two elongations (to produce a 24-carbon fatty acid) followed by a desaturation with delta(6)-desaturases, and finally a β-oxidation step (to shorten the chain length by 2-carbons) [Voss et al., 1991].
To study the effect of n-3 fatty acids in adipose tissue on glucose homeostasis, we developed seven fat-1 transgenic C57BL/6 mouse lines controlled by promoter sequences of the adipocyte protein-2 (aP2) for adipocyte expression (AP-lines, including AP-2 and AP-3). Using the adipose tissue-specific promoter our study extends the results by Kang et al. [2004] where their promoter presumably resulted in ubiquitous expression of fat-1, although that was not reported. We consistently detected fat-1 mRNA levels in the target organs. We performed serum and adipose tissue fatty acid analysis fat-1 transgenic mice fed a high unsaturated fat (HUSF) diet, which provided substrates for the FAT-1 enzyme. Additionally, glucose and insulin tolerance were examined in the fat-1 transgenic mice challenged with a high-carbohydrate (HC) diet, which induces impaired glucose tolerance in the wild type (WT) C57BL/6 mice.
MATERIALS AND METHODS
Transgene Construct with Adipocyte-Specific Promoter Controlling fat-1
The fat-1 cDNA derived from C. elegans in the pCE8 clone was used previously by Kang et al. [2001] in their adenoviral vector with successful expression. The fat-1 cDNA clone contained a 1205 bp coding sequence, preceded by a 12 bp 5’ untranslated region (UTR) and followed by a 72 bp 3’UTR. The 3’ UTR has no consensus poly (A) signal sequence (AATAAA or ATTAAA) but only a variant form (cATAAAg) which, as far as we know, has not been proven to function in mammalian cells. Since only a stretch of 19 poly(A) is present at the end of 3' UTR of fat-1 cDNA in the plasmid pCE8, a SV40 late poly(A) signal sequence provided in the vector pGL3-Basic (Promega) was added. The 5.4 kb aP2 promoter-enhancer [Ross et al., 1990] was removed from the plasmid pSKII+ (Stratagene) with KpnI and SmaI and ligated into the KpnI and EcoRV sites in the cloning vector pZero2 (Invitrogen) to yield a plasmid pZero2-aP2. Construction of the plasmid pGL3-aP2-fat-1 and excision of the aP2-fat-1 expression cassette is illustrated (Fig. 2).
Fig. 2.
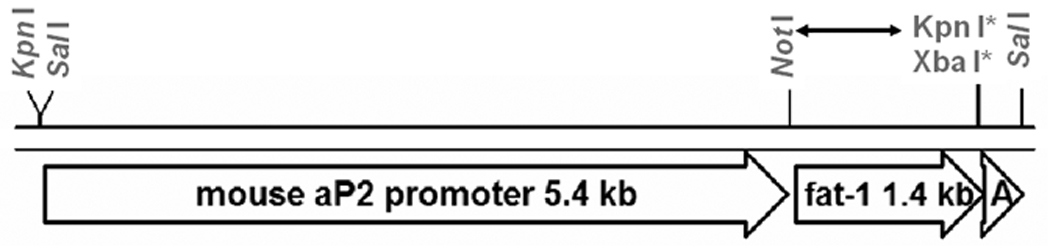
Construction of pGL3-aP2-fat-1, and excision of the aP2-fat-1 expression cassette. The 1.4 kb Not I-Kpn I (blunt-ended) fragment with 1.2 kb fat-1 coding sequence followed by its native 3’ UTR and poly(A)19, as presented in pCE8 is indicated as a double arrow (“←→”). The 5.4 kb Kpn I – Not I fragment of mouse aP2 promoter from pZero2-aP2 and this 1.4 kb fragment were ligated into a Kpn I- Xba I (blunt-ended) vector pGL3-Basic (Promega). The blunted sites are shown with a star (“*”). The expression cassette aP2-fat-1 is excised from the vector via two Sal I sites flanking the cassette for microinjection.
Production and Husbandry of fat-1 Transgenic Mice
The 8 kb SalI – SalI fragment of aP2-fat-1 and was purified for microinjection into fertilized eggs to generate transgenic mice on the C57BL/6Tac (B6; Taconic, Inc.) background according to standard protocols. All transgenic mice in the experiments were the fourth generation of a male offspring from the founder mice backcrossed to female wild type B6. All control mice were transgene negative B6 siblings of the transgenic mice. Breeders, weaned pups and stock mice were fed a standard rodent diet (Purina RMH2500, with macronutrient contents in terms of percentage energy as carbohydrate 58%, fat 13%, and protein 29%). A high unsaturated fat (HUSF) diet was composed of the basal components plus total fat of 62% calories composed of safflower oil (77 % linoleic acid, LE-18:2n-6 and 13% oleic acid, 18:1n-9). This HUSF diet, Teklad TD 03387, had macronutrient contents expressed as of percentage energy with carbohydrate 15%, fat 62%, and protein 23%) was produced, stored under nitrogen to avoid fatty acid oxidation. A high carbohydrate (HC) diet (Teklad TD 03389) with macronutrient contents in terms of percentage energy as carbohydrate 64%, fat 13%, and protein 23%) had starch and fructose (50:50) added to the base ingredients as a substitute for the equivalent quantity of fat calories found in the HUSF diet. The mice were housed in restricted access facility using sterilized caging and water. Weaned pups were switched to either HUSF diet or HC diet at 4- to 5-weeks-old and maintained on that diet prior to being sacrificed for the fatty acid distribution at 12- to 13-week-old (after being fed the HUSF diet for 8 weeks) or entry into the 3-week glucose/insulin tolerance experiments at 11- to 13-week-old. Upon completion of the glucose/insulin tolerance experiments, mice were sacrificed at the age of 15- to 17-weeks old (after being fed the HC diet for 11 to 13 weeks).
We attempted to obtain homozygous transgenic mice in the two lines (AP-2 and AP-3) in order to have relatively higher mRNA levels from the fat-1 transgene. There were two litters produced from hemizygous matings of each of these two lines. Homozygosity was tested by mating transgene positive offspring with a wild-type (WT) mate. True homozygous mice would transmit the transgene 100% of the time, which was tested in two litters per test mating pair.
Genotyping by PCR
Founder pups were genotyped by PCR for presence fat-1 cDNA using a pair of primers with sequence corresponding to the 5′ and 3′ ends of the fat-1 cDNA: fat-1–5′ (ATATTCTAGACAAGTTTGAGGTATGGTCGC) and fat-1–3′ (ATATACTAGTAAGAGTTATGGCTTTATGCA).
Southern Blot Analysis
Southern blot was performed using standard methods and the probe was first generated by PCR amplification using the plasmid containing the fat-1 cDNA and the above mentioned primer pair (fat-1–5′ and fat-1-3′). A positive control in the Southern blot analysis consisted of the plasmid pGL3-aP2-fat-1 in a range of copy number equivalents mixed with the same amount of C57BL/6 genomic DNA. This was used to estimate the copy number of transgene constructs integrated into the initial founder mouse lines.
Real Time Quantitative RT-PCR (qRT-PCR) Analysis
Steady state concentrations of fat-1 mRNA in target tissues were evaluated by real-time qRT-PCR. First strand cDNA was generated from 1 µg of RNA in 20 µl volume reaction containing both oligo-(dT) and random hexamers (Invitrogen First Strand Synthesis Kit) according to the manufacturer’s instructions. Real time quantitative RT-PCR was carried out in a 20 µl reaction volume containing 10 µl Supermix UDG (Invitrogen Life Technologies, Inc.), 2 µl cDNA, 0.3 µM LUX fat-1 primer forward (GTACACCCGATGATGTCGCTGAGGTG[FAM]AC, FAM labeled Invitrogen, Life Technologies), 0.3 µM LUX fat-1 primer reverse (CGATGGTTTGGGTTTGTCCA), 0.05 µM 18S RNA primer forward, and 0.05 µM 18S RNA primer reverse (JOE labeled Invitrogen, Life Technologies). Cycling conditions included incubation at 50°C for 2 min, a 2 min 95°C denaturing step, followed by 45 cycles of 95°C denaturation for 15 seconds, an annealing step at 56.5°C for 45 sec (followed by plate reading), an extension step at 72°C for 30 sec (followed by plate reading again). There was a final extension at 72°C for 30 sec. Melting curve was read from 55°C to 95°C every 0.5°C (hold 1 sec).
Fatty Acid Isolation and FAME Analysis
Fatty acids from plasma were isolated and methylated according to Moser and Moser [1991]. Briefly, 100–250 µl of plasma was mixed with 1 ml methanol:dichloromethane (3:1 v/v). After addition of internal standard (50 nmol of heptadecanoic acid), 200 µl acetyl chloride was added with vortexing, and the sample was incubated at 75°C for 1 hr. After cooling, the reaction solution was neutralized with 4 ml of 7% K2CO3 and the lipids were extracted into hexane. The hexane fraction was washed with acetonitrile and concentrated under nitrogen. The fatty acid methyl ester (FAME) mixture was then resuspended in hexane and analyzed by gas chromatography-mass spectroscopy (GC-MS) [Batal, et. al, 2007].
Adipose Tissue Extraction
Frozen tissue, weighing between 0.05–0.3g, was thawed while on ice and wet weight recorded to the nearest 0.1 mg. Tissue was then placed in homogenization buffer, (phosphate buffered saline containing 20 mg/L phenylmethylsulfonyl fluoride, 1mmol/L benzamidine), and homogenized using a Fisher PowerGen 125 Homogenizer equipped with a 10 × 195mm sawtooth generator. A 250ul aliquot was then removed and extracted as described above for plasma samples. Tissue FAME were then resuspended in hexane and quantified by GC-MS.
Glucose Tolerance Test (GTT) and Insulin Tolerance Test (ITT)
Intraperitoneal (IP) glucose tolerance test (GTT) was performed twice in 11- and 13- week-old mice fed the HC diet for ~7 and 9 weeks, respectively. At 18 hours prior to GTT, mice were food deprived with water overnight. After the mice were weighed, a baseline blood sample was obtained by tail bleed and additional blood samples were obtained for glucose at 15, 30, 60, and 120 min following IP glucose administration at 2.0 mg/g body weight with 50% glucose. The GTT data were summarized as both the area-under-the-curve (AUC) of a GTT and the “partial-GTT (P-GTT)”, which indicates the excursion of glucose concentrations from basal concentrations by subtracting GTT-AUC with the “area under the base line”. Insulin tolerance testing (ITT) was performed twice in 12- and 14-week-old mice after a one week recovery period following GTT. The mice were fasted for 4 hrs and blood glucose concentrations were measured at 0, 10, 30 and 60 min. after IP injection (0.75 U per kg body weight) of recombinant human insulin (Humulin R, 100 U/ml stock using a 1.5:1000 dilution in saline). The ITT data were summarized as both AUC and the reversed AUC (R-ITT). The former takes into account the basal glucose concentrations following a 4-hr fast, whereas the latter measures only the glucose-lowering effect of the insulin load.
Statistical Analyses
The unpaired student’s t-test, the chi-square test for analysis of variance, and linear regression analysis were used to determine p values (α < 0.05).
RESULTS
Transgenic Lines Produced
Following microinjection of transgene constructs into fertilized eggs of C57BL/6Tac, seven AP founder lines were identified among twenty-two pups, as detected by PCR screening of the fat-1 transgene constructs in mouse tail DNA. PCR screening results were initially confirmed by Southern blot analysis, then PCR was used exclusively following that validation for additional lines. We found copy numbers of the transgene construct of 40 and 50 in lines AP-2 and AP-3, respectively.
Tissue-Specific Expression of fat-1 mRNA
Using the same amount of total RNA, the fat-1 mRNA levels in the white adipose tissue (WAT) and brown adipose tissue (BAT) in male and female mice of the AP-2 and AP-3 lines were consistently detected by RT-PCR at about 2.8+/−0.3% and 2.0+/−0.4% (mean+/−SE), respectively, of that in total RNA from C. elegans used as a positive control (data not shown). Although there are gender specific differences in body fat, we found no gender-specific differences in expression of the fat-1 transgene using the AP-2 promoter (data not shown). In Figure 3A, fat-1 mRNA levels in WAT and BAT of male and female AP-3 mice were indicated as 4000- to 6000- fold of the background signal in corresponding tissues of WT control mice. Also, fat-1 mRNA levels in heart, skeletal muscles, liver, spleen, brain, and kidneys in male and female AP-3 mice were not different from that in WAT of WT control mice (Figure 3B), suggesting that the transgene expression is adipose-tissue-specific.
Fig. 3.
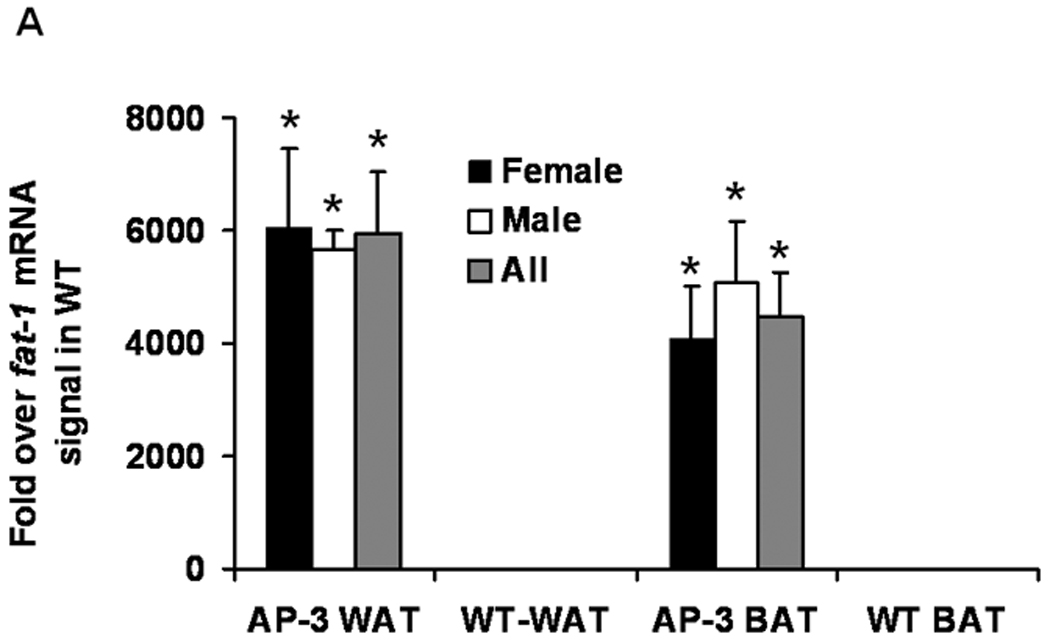
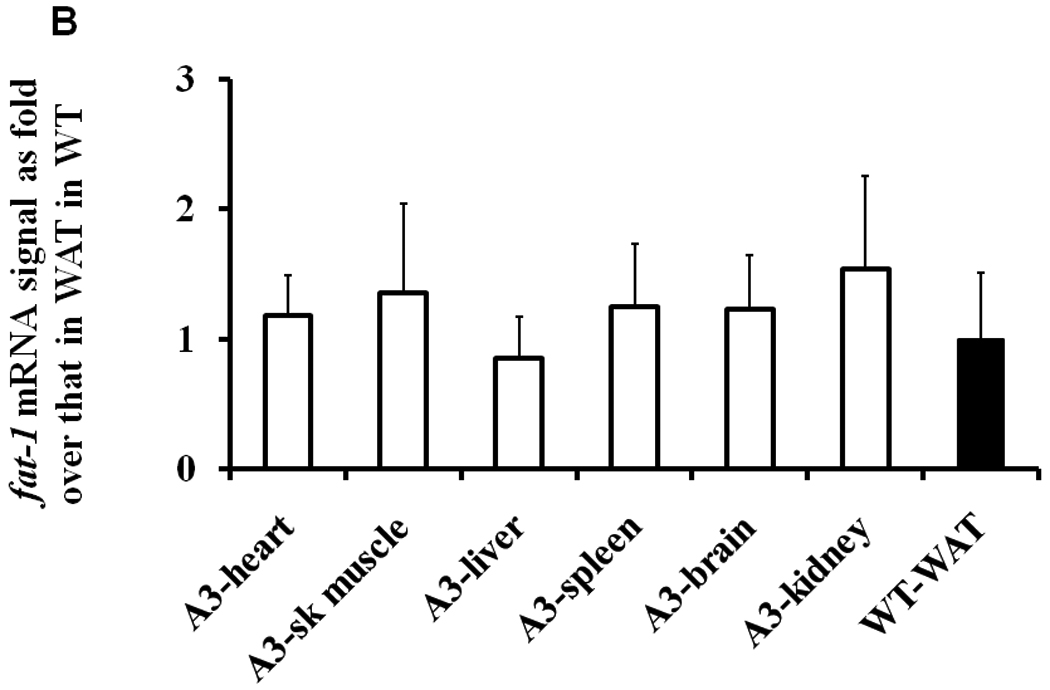
Real time quantitative RT-PCR analysis of total RNA of WAT and BAT in AP-3 transgenic mice. AP-3 mice female (n=6) and male (n=5) and WT (n=6) mice at 12- to 13- week-old were food-deprived for 6-hr before sacrifice. A) Mean levels of fat-1 mRNA in WAT and BAT of WT controls were arbitrarily set to 1, and the fold over this background is displayed. The data are expressed as mean ± S.E. (*p<0.0001 compared to WT values). B) Mean levels of fat-1 mRNA in WAT of WT controls were arbitrarily set to 1, and the fold over this background is displayed. The data are expressed as mean ± S.E.
Homozygosity
As indicated from the combined data of the two highest expressing lines AP-2 and AP-3, there were no homozygous pups produced in the four test litters (Table 1). Also, assuming that homozygosis of the transgene was lethal, then there were the predicted number of hemizygous and WT pups produced in such mating, suggesting that a haploid dose of the transgene did not affect germ-line transmission.
TABLE I. Testing for homozygosity of fat-1 transgene (Tg+) with Lines AP-2 and AP-3.
Tg+/− (M) × Tg+/− (F), 2 litters tested from each line
| Pups born | Tg+/+ | Tg+/− | Tg−/− (WT) | Total pups |
|---|---|---|---|---|
| Observed (expected) | 0* (9) | 25* (18) | 11* (9) | 36 |
| Observed (expected) if Tg+/+ lethal |
0 (0) | 25 (24) | 11 (12) | 36 |
p<0.05 by chi-square test of variance
Fatty Acid Profiles
In serum of AP-3 transgenic mice, as shown in Fig. 4A, the ratios of n-6 to n-3 fatty acids were significantly lower, with a mean ratio of 4.9:1 vs. 6.4:1, or a 23% reduction in the ratio of total n-6 to total n-3 fatty acids (p=0.025). There was a 61% increase in EPA-20:5n-3 in AP-3 mice versus WT mice (p=0.02, 109 vs. 68 nmol/ml, Fig. 4B). In adipose tissues of AP-3 mice, there was a 19% increase in the most abundant n-3 PUFA, DHA-22:6n-3 (2.6 vs. 2.2 nmol/g, Fig. 4C, p=0.015).
Fig. 4.
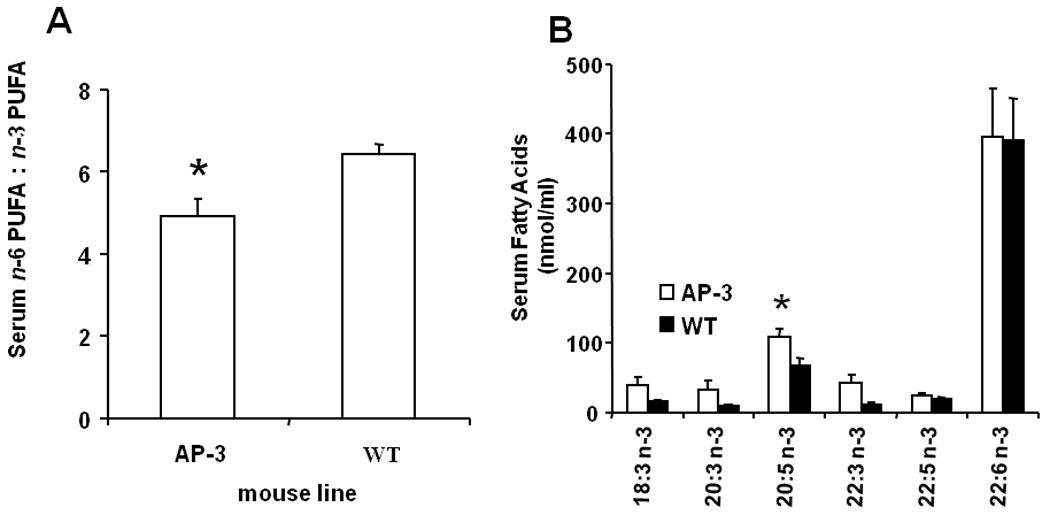
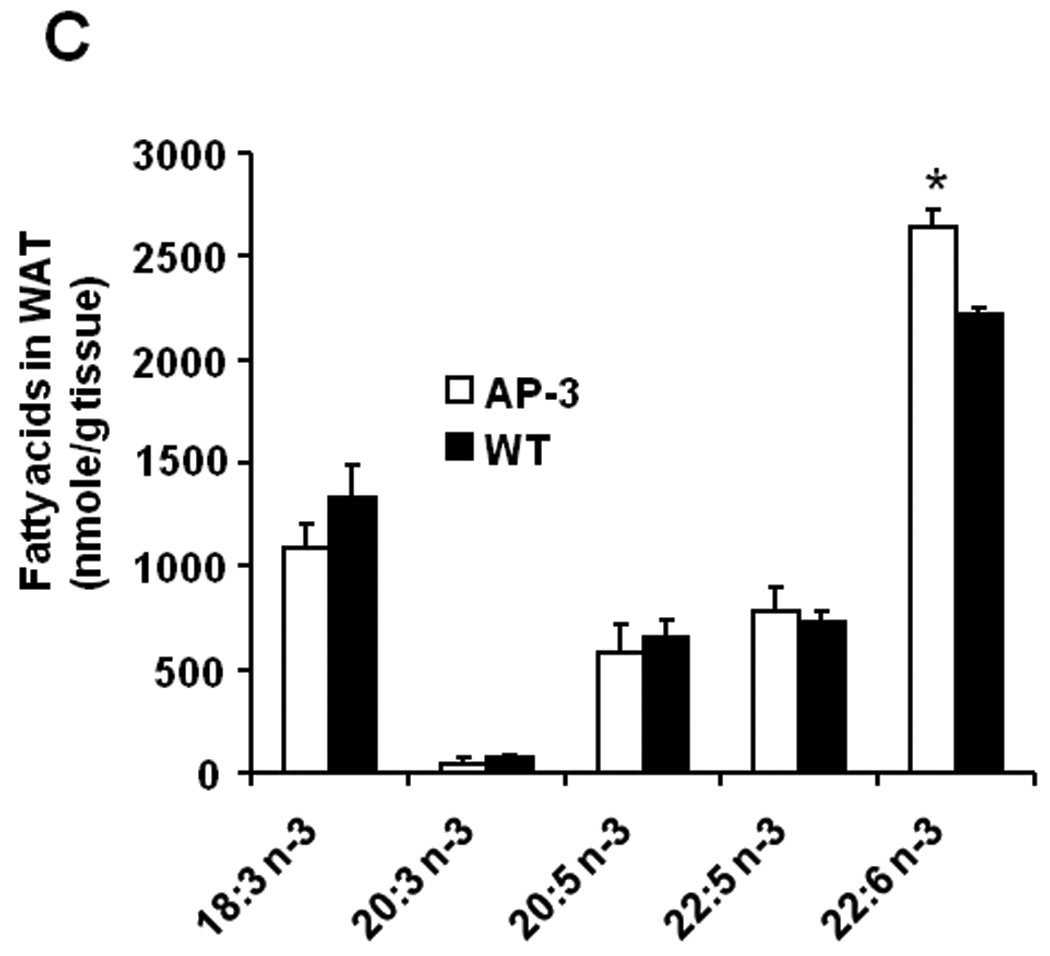
Fatty acid profiles in male and female AP-3 transgenic mice on HUSF diet. A: The ratio of total n-6 to n-3 fatty acids in serum samples (n=5); B: the concentrations of each n-3 fatty acids in serum (n=5); and C: the levels of each n-3 PUFA in WAT were indicated. The data are expressed as mean ± S.E. (*p<0.05 versus WT values).
Metabolic Phenotypes: Body Weight, Visceral Fat Pad Weight, and Fasting Blood Glucose
The male AP-3 mice had lower body weight (26.0 g versus 27.6 g in control mice, p<0.01) at 3-months old (following an 18-hr fast) with no difference in epididymal fat pad weight upon sacrifice at 4 months old. In contrast, both body weight and visceral fat weights were not altered in the female AP-3 mice (data not shown). Also, there were no changes in fasting blood glucose levels in both male and female AP-3 mice (data not shown).
Glucose Tolerance and Insulin Tolerance
In previous studies the HC diet caused significant weight gain and impaired glucose tolerance in the male B6 mice (unpublished, Tian L, and Wood PA). During GTT, there were lower glucose concentrations at 60 and 120 min, and lower AUC values of GTT and P-GTT in male AP-3 mice (Fig. 5A and 5B). This was also true for the male AP-2 mice (data not shown). In contrast, the glucose concentrations at 30 and 60 min during GTT, and AUC values of GTT in female AP-3 mice (Fig. 5C and 5D) were higher than control concentrations. We obtained a similar finding in the female AP-2 mice (data not shown). Therefore, while male AP-2 and -3 mice had better glucose tolerance, there was reduced glucose tolerance in female AP-2 and -3 mice.
Fig. 5.
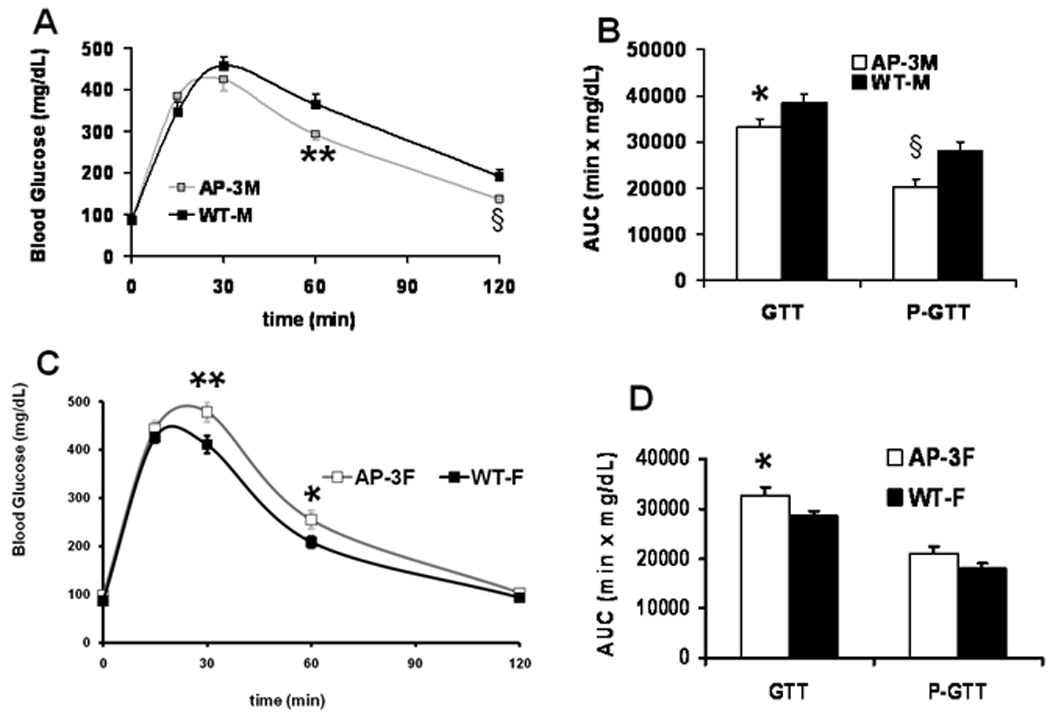
Glucose tolerance test (GTT). Duplicate GTT experiments were performed in mice at one-week before and one-week after the age of 3 months. A and C: Glucose levels during GTT experiments in the AP-3M (male) mice (n = 4, grey line) and in the AP-3F (female) mice (n = 6, grey line) were compared to those in the WT-M (wild-type male) mice (n = 7, black line) and the WT-F (wild-type female) mice (n=15, black line), respectively. B and D: Corresponding values of area-under-the-curve (AUC) and partial AUC of the GTT experiments in A and C were indicated as “GTT” and “P-GTT”, mean ± S.E., *p<0.05, **p<0.01, § p<0.005.
Since glucose concentrations during GTT are affected by both insulin sensitivity and insulin concentrations we performed ITT to investigate whether there was reduced insulin sensitivity in the peripheral tissues or reduced glucose-stimulated insulin response. During ITT in both AP-3M and AP-3F mice, the glucose concentrations at all time points, and the AUC values of ITT and R-ITT were not different from control concentrations (Fig. 6A – 6D), suggesting no change in insulin sensitivity. Similar results were found in the AP-2 male and AP-2 female mice (data not shown).
Fig. 6.
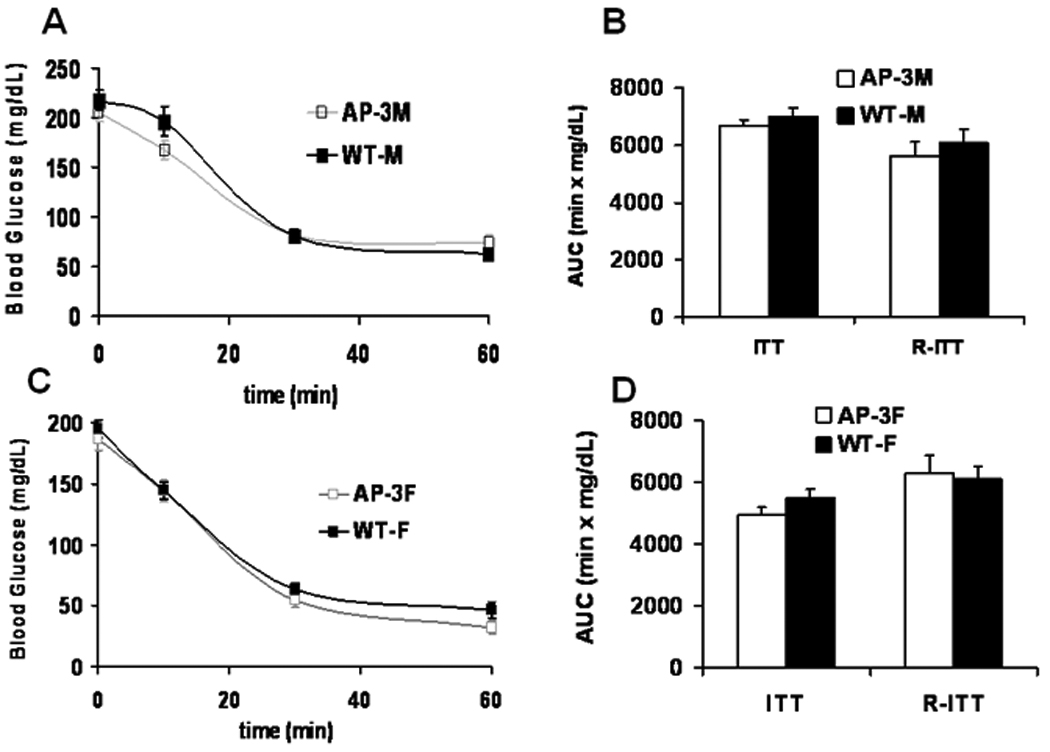
Insulin tolerance test (ITT). Duplicate ITT experiments were performed in mice at 3.0 and 3.5 months of age. A and C: Glucose levels during ITT experiments in the AP-3M (male) mice (n = 4, grey line) and the AP-3F (female) mice (n = 6, grey line) were compared to those in the WT-M (wild-type male) mice (n = 7, black line) and the WT-F (wild-type female) mice (n=15, black line). B and D: Corresponding values of AUC and reversed AUC of the ITT experiments in A and C were indicated as “ITT” and “R-ITT”, respectively (mean ± S.E.). There were no significant differences between the groups.
DISCUSSION
The fat-1 mRNA levels were uniformly low in 7 lines of our transgenic mouse model using an adipose-specific (aP2) promoter when compared to relative expression found in C. elegans when normalized to total RNA. Kang et al. [2004] suggested that “humanizing” the worm’s “preferred codon usage” increases translation of the fat-1 mRNA in mouse. However, since the mRNA levels of their transgenic mice were not compared to C. elegans, although they reported an increase in n-3 PUFA and decrease in n-6 PUFA [Lai et al., 2006], it is unclear whether the use of “humanized codons” per se rather than simple variation in transgene mRNA expression among different transgenic mouse lines is the reason for reversal of the n-6 to n-3 fatty acid ratio in their fat-1 transgenic mouse model. A second possibility is that a functionally active fat-1 transgene might be detrimental to a mouse embryo that does not normally express it; therefore only those lines that express the fat-1 transgene at relatively low levels survive to birth. This possibility is consistent with the fact that we could not produce homozygous transgenic lines using the two highest expressing lines (AP-2 and AP-3, Table 1). However, live-borne homozygous fat-1 transgenic mice using the CMV promoter were produced previously[Kang et al., 2004]. A possible explanation for this discrepancy is that there might not be enough fat-1 enzyme activities in their homozygous fetus to be detrimental, however this would require direct comparison of n-3 fatty acids in fetuses between the two mouse lines.
Therefore, we postulate that fat-1 transgene expression at relatively high levels may be lethal to the mouse embryo. Alteration in the ratio of n-3 to n-6 fatty acids in the diet affected reproduction [Wathes et al., 2007]. In one study [Wakefield et al., 2008], high n-3 PUFA concentrations in the diet during oocyte maturation and fertilization was associated with embryos with increased production of reactive oxygen species and decreased ability to develop to the blastocyst stage. Although increases in serum and tissue concentrations of n-3 fatty acids and the n-3/n-6 ratio were small in our transgenic mouse model, high levels of n-3 fatty acids in membrane phospholipids may be sufficient to disrupt reproduction. Other mechanisms of reduced reproduction may include changes in prostaglandin synthesis [Abayasekara et al., 1999; Elmes et al., 2004], steroidogenesis [Stocco et al., 2005], activity of transcription factors such as the peroxisome proliferator-activated receptor (PPAR) family, and the steroid response element binding protein (SREBP) family.
As part of our FAME analysis, we did evaluate the concentrations of linoleic acid (18:2, n-6) and arachidonic acid (20:4,n-6) in serum and WAT, and we saw no significant differences between (serum and WAT) samples from fat-1 transgenic mice and WT mice. This could be due to saturating the capacity of the FAT-1 enzyme in our model by the abundant n-6 fatty acid provided from the diet such that a small reduction in n-6 fatty acids cannot be detected.
In fat-1 transduced mammary epithelial cells, the increase in EPA concentration was much more pronounced in the phospholipids fraction versus cellular triacylglycerols [Morimoto et al., 2005]. The mechanisms of preferential partition of de novo synthesized n-3 fatty acids to phospholipid membrane fractions include the ability of n-3 PUFA to suppress phosphatidate phosphohydrolase [Marsh et al., 1987], acyl-coenzyme A:1,2-diacylglycerol acyltransferase [Rustan et al., 1988a], and acyl-CoA:cholesterol acyltransferase [Rustan et al., 1988b; Rustan et al., 1989]. We speculate that there are relatively low rates of redistribution by phospholipid hydrolysis and re-acylation of n-3 fatty acids, as compared to the assembly and hydrolysis of fatty acids from triglycerides. Therefore we expect that transgenic expression of the FAT-1 enzyme results in a higher localized concentration of membrane-bound, n-3 fatty acids in adipose tissue compared to other tissues. Thus, equilibrium among different tissues may not be reached readily. We chose adipose tissue-specific expression to achieve tissue specific fat-1 expression levels in live born mice to study the n-3 fatty acid related mechanisms that affect adipose tissue and energy metabolism.
While unsaturated fatty acids (including both PUFA and monounsaturated fatty acids [MUFA]) reduce the proteolytic processing and maturation of SREBP-1a, -1c and -2 proteins [Worgall et al., 1998], PUFA but not MUFA enhances decay of SREBP-1c mRNA [Xu et al., 1999; Xu et al., 2001]. PUFA suppress the nuclear content of SREBP-1c by reducing the stability of its mRNA [Xu et al., 1999], which is independent of PPAR-α activation [Clarke et al., 1997; Ren et al., 1997]. Moreover, PUFA inhibit the transcription of a number of hepatic lipogenic and glycolytic genes [Jump et al., 1994]. In vitro studies suggest both n-6 and n-3 PUFA are ligands for PPARα, PPARδ, and PPARγ [Kliewer et al., 1997], liver X receptors, retinoid X receptor α, and hepatic nuclear factor 4α [Jump, 2002]. However, in rodents, only dietary n-3 PUFA (e.g., fish oil) and not dietary n-6 PUFAs (e.g., safflower oil) induced hepatic peroxisome proliferation and fatty acid oxidation, reduces hepatic triglyceride (TG) content [Neschen et al., 2002], and prevents high fat diet (HFD) induced hepatic insulin resistance and increase in hepatocyte diacylglycerol in a PPAR-α dependent manner [Neschen et al., 2007], suggesting fish oil exerts beneficial effects in a HFD-dependent manner. Similarly, in female C57BL/6J mice fed either a regular diet or HFD, dietary supplementations with 1% n-3 enriched PUFA combined with 1% conjugated-linoleic acid (CLA) led to insulin resistance and hyperinsulinemia, however reduced glucose intolerance developed only in mice fed regular diet [Winzell et al., 2006]. Therefore, fish oil effects on glucose homeostasis may be diet-dependent.
In the current study, the male AP-3 mice fed the HCD had improved glucose tolerance compared to WT. Since there as no change in insulin sensitivity, we hypothesize that there might be a better insulin response in the pancreatic β-cell. Because fish oil protects β-cells in mice from the toxicity of a low dose streptozotocin [Linn et al., 1989], n-3 fatty acids may preserve insulin section by protecting β-cell in male mice fed the HCD. In contrast, reduction in insulin secretary response was suggested in female fat-1 transgenic mice eating the HCD. Similarly, in rats made insulin resistant by high-saturated fat feeding for one month, hyperinsulinemia can be rapidly reversed via the dietary provision of small amounts of long-chain n-3 fatty acids in the absence of an acute improvement in insulin sensitivity and therefore at the expense of maintenance of glucose tolerance [Holness et al., 2004]. It is not clear why the female transgenic mice demonstrate glucose intolerance.
There is some experimental evidence in rodents that n-3 fatty acids lead to changes in energy balance and body weight, being less obesogenic than other fatty acids [Merzouk et al., 2003; Cunnane et al., 1994]. In the leptin deficient obese mice, Cunnane et al. [1994] showed that, despite no significant change in food intake, there is less weight gain with a fish oil diet than when fed an iso-energetic diet with n-6 fatty acids diet [Cunnane et al., 1994]. In vivo activation of PPAR-γ by n-3 PUFA increased plasma adiponectin levels [Neschen et al., 2006], which are negatively associated with percent body fat, visceral fat, insulin, and leptin levels [Ryan et al., 2003]. Consistent with this, in our study, the male AP-3 mice had lower body weight.
In summary, we created the first transgenic mouse model with adipose tissue-specific expression of fat-1 enzyme. We used the native fat-1 gene sequence controlled by the aP2 promoter. There was an increase of n-3 fatty acids in the serum and WAT of AP-3 mice. Fat-1 expression improved glucose tolerance possibly by improving insulin secretion and reduced body weight in male AP-3 mice fed a HC diet; however, female AP-3 mice had reduced glucose tolerance. Finally, this is the first report of a potential reproduction problem in fat-1 transgenic mice, as we were unable to produce homozygous transgenic lines and the lines analyzed all had a relatively low expression level implicating that excessive fat-1 expression may be detrimental to a developing embryo or fetus.
ACKNOWLEDGEMENTS
We thank John Browse for providing the fat-1 cDNA (clone pCE8) derived from C. elegans, Bruce Spiegelman for the aP2 promoter, Michael Laposata and Joanne Brown for the FAME fatty acid analyses. This work was supported by the NIH grant R-21 DK66517 (PAW) and the UAB Transgenic Core Facility P30 CA13148 (Bob Kesterson, Director).
Grant sponsor: NIH; Grant numbers: R-21 DK66517and P30 CA13148.
REFERENCES
- Abayasekara DR, Wathes DC. Effects of altering dietary fatty acid composition on prostaglandin synthesis and fertility. Prostaglandins Leukotr Essent Fatty Acids. 1999;61:275–287. doi: 10.1054/plef.1999.0101. [DOI] [PubMed] [Google Scholar]
- Adler AI, Boyko EJ, Schraer CD, Murphy NJ. Lower prevalence of impaired glucose tolerance and diabetes associated with daily seal oil or salmon consumption among Alaska Natives. Diabetes Care. 1994;17:1498–1501. doi: 10.2337/diacare.17.12.1498. [DOI] [PubMed] [Google Scholar]
- Batal I, Ericsoussi MB, Cluette-Brown JE, O'Sullivan BP, Freedman SD, Savaille JE, Laposata M. Potential utility of plasma fatty acid analysis in the diagnosis of cystic fibrosis. Clin Chem. 2007;53:78–84. doi: 10.1373/clinchem.2006.077008. [DOI] [PubMed] [Google Scholar]
- Bhatnagar D, Durrington PN. Omega-3 fatty acids: Their role in the prevention and treatment of atherosclerosis related risk factors and complications. Int J Clin Pract. 2003;57:305–314. [PubMed] [Google Scholar]
- Bhattacharya A, Chandrasekar B, Rahman MM, Banu J, Kang JX, Fernandes G. Inhibition of inflammatory response in transgenic fat-1 mice on a calorie-restricted diet. Biochem Biophys Res Commun. 2006;349:925–930. doi: 10.1016/j.bbrc.2006.08.093. [DOI] [PubMed] [Google Scholar]
- Burdge GC, Jones AE, Wootton SA. Eicosapentaenoic and docosapentaenoic acids are the principal products of α-linolenic acid metabolism in young men. Br J Nutr. 2002a;88:355–363. doi: 10.1079/BJN2002662. [DOI] [PubMed] [Google Scholar]
- Burdge GC, Wootton SA. Conversion of α-linolenic acid to eicosapentaenoic, docosapentaenoic and docosahexaenoic acids in young women. Br J Nutr. 2002b;88:411–420. doi: 10.1079/BJN2002689. [DOI] [PubMed] [Google Scholar]
- Burdge GC, Finnegan YE, Minihane AM, Williams CM, Wootton SA. Effect of altered dietary n-3 fatty acid intake upon plasma lipid fatty acid composition, conversion of [13C] α-linolenic acid to longer-chain fatty acids and partitioning towards β-oxidation in older men. Br J Nutr. 2003;90:311–321. doi: 10.1079/bjn2003901. [DOI] [PubMed] [Google Scholar]
- Clarke SD, Jump D. Polyunsaturated fatty acids regulate lipogenic and peroxisomal gene expression by independent mechanisms. Prostaglandins Leukot Essent Fatty Acids. 1997;57:65–69. doi: 10.1016/s0952-3278(97)90494-4. [DOI] [PubMed] [Google Scholar]
- Cunnane SC, McIntosh D. α-Linolenic acid and reduction of cardiac deaths. Lancet. 1994;344:622. [PubMed] [Google Scholar]
- Elmes M, Tew P, Cheng Z, Kirkup SE, Abayasekara DR, Calder PC, Hanson MA, Wathes DC, Burdge GC. The effect of dietary supplementation with linoleic acid to late gestation ewes on the fatty acid composition of maternal and fetal plasma and tissues and the synthetic capacity of the placenta for 2-series prostaglandins. Biochim Biophys Acta. 2004;1686:139–147. doi: 10.1016/j.bbalip.2004.09.004. [DOI] [PubMed] [Google Scholar]
- German JB, Dillard CJ, Whelan J. Biological effects of dietary arachidonic acid. Introduction. J Nutr. 1996;126:1076S–1080S. doi: 10.1093/jn/126.suppl_4.1076S. [DOI] [PubMed] [Google Scholar]
- Holness MJ, Smith ND, Greenwood GK, Sugden MC. Acute omega-3 fatty acid enrichment selectively reverses high-saturated fat feeding-induced insulin hypersecretion but does not improve peripheral insulin resistance. Diabetes. 2004;53 Suppl 1:S166–S171. doi: 10.2337/diabetes.53.2007.s166. [DOI] [PubMed] [Google Scholar]
- Hudert CA, Weylandt KH, Lu Y, Wang J, Hong S, Dignass A, Serhan CN, Kang JX. Transgenic mice rich in endogenous omega-3 fatty acids are protected from colitis. Proc Natl Acad Sci USA. 2006;103:11276–11281. doi: 10.1073/pnas.0601280103. [DOI] [PMC free article] [PubMed] [Google Scholar]
- Jia Q, Lupton JR, Smith R, Weeks BR, Callaway E, Davidson LA, Kim W, Fan YY, Yang P, Newman RA, Kang JX, McMurray DN, Chapkin RS. Reduced colitis-associated colon cancer in fat-1 (n-3 fatty acid desaturase) transgenic mice. Cancer Res. 2008;68:3985–3991. doi: 10.1158/0008-5472.CAN-07-6251. [DOI] [PMC free article] [PubMed] [Google Scholar]
- Jucker BM, Cline GW, Barucci N, Shulman GI. Differential effects of safflower oil versus fish oil feeding on insulin-stimulated glycogen synthesis, glycolysis, and pyruvate dehydrogenase flux in skeletal muscle: A 13C nuclear magnetic resonance study. Diabetes. 1999;48:134–140. doi: 10.2337/diabetes.48.1.134. [DOI] [PubMed] [Google Scholar]
- Jump DB, Clarke SD, Thelen A, Liimatta M. Coordinate regulation of glycolytic and lipogenic gene expression by polyunsaturated fatty acids. J Lipid Res. 1994;35:1076–1084. [PubMed] [Google Scholar]
- Jump DB. The biochemistry of n-3 polyunsaturated fatty acids. J Biol Chem. 2002;277:8755–8758. doi: 10.1074/jbc.R100062200. [DOI] [PubMed] [Google Scholar]
- Kang ZB, Ge Y, Chen Z, Cluette-Brown J, Laposata M, Leaf A, Kang JX. Adenoviral gene transfer of Caenorhabditis elegans n-3 fatty acid desaturase optimizes fatty acid composition in mammalian cells. Proc Natl Acad Sci USA. 2001;98:4050–4054. doi: 10.1073/pnas.061040198. [DOI] [PMC free article] [PubMed] [Google Scholar]
- Kang JX, Wang J, Wu L, Kang ZB. Transgenic mice: fat-1 mice convert n-6 to n-3 fatty acids. Nature. 2004;427:504. doi: 10.1038/427504a. [DOI] [PubMed] [Google Scholar]
- Kliewer SA, Sundseth SS, Jones SA, Brown PJ, Wisely GB, Koble CS, Devchand P, Wahli W, Willson TM, Lenhard JM, Lehmann JM. Fatty acids and eicosanoids regulate gene expression through direct interactions with peroxisome proliferator-activated receptors α and γ. Proc Natl Acad Sci USA. 1997;94:4318–4323. doi: 10.1073/pnas.94.9.4318. [DOI] [PMC free article] [PubMed] [Google Scholar]
- La Guardia M, Giammanco S, Di Majo D, Tabacchi G, Tripoli E, Giammanco M. Omega 3 fatty acids: Biological activity and effects on human health. Panminerva Medica. 2005;47:245–257. [PubMed] [Google Scholar]
- Lai L, Kang JX, Li R, Wang J, Witt WT, Yong HY, Hao Y, Wax DM, Murphy CN, Rieke A, Samuel M, Linville ML, Korte SW, Evans RW, Starzl TE, Prather RS, Dai Y. Generation of cloned transgenic pigs rich in omega-3 fatty acids. Nat Biotechnol. 2006;24:435–436. doi: 10.1038/nbt1198. [DOI] [PMC free article] [PubMed] [Google Scholar]
- Leaf A, Kang JX. Omega-3 fatty acids and cardiovascular disease. World Rev Nutr Diet. 2001;89:161–172. doi: 10.1159/000059783. [DOI] [PubMed] [Google Scholar]
- Levinson PD, Iosiphidis AH, Saritelli AL, Herbert PN, Steiner M. Effects of n-3 fatty acids in essential hypertension. Am J Hypertens. 1990;3:754–760. doi: 10.1093/ajh/3.10.754. [DOI] [PubMed] [Google Scholar]
- Linn T, Noke M, Woehrle M, Kloer HU, Hammes HP, Litzlbauer D, Bretzel RG, Federlin K. Fish oil-enriched diet and reduction of low-dose streptozocin-induced hyperglycemia. Inhibition of macrophage activation. Diabetes. 1989;38:1402–1411. doi: 10.2337/diab.38.11.1402. [DOI] [PubMed] [Google Scholar]
- Marsh JB, Topping DL, Nestel PJ. Comparative effects of dietary fish oil and carbohydrate on plasma lipids and hepatic activities of phosphatidate phosphohydrolase, diacylglycerol acyltransferase and neutral lipase activities in the rat. Biochim Biophys Acta. 1987;922:239–243. doi: 10.1016/0005-2760(87)90160-3. [DOI] [PubMed] [Google Scholar]
- Merzouk H, Khan NA. Implication of lipids in macrosomia of diabetic pregnancy: Can n-3 polyunsaturated fatty acids exert beneficial effects? Clin Sci (Lond) 2003;105:519–529. doi: 10.1042/CS20030143. [DOI] [PubMed] [Google Scholar]
- Middaugh JP. Cardiovascular deaths among Alaskan Natives, 1980-86. Am J Public Health. 1990;80:282–285. doi: 10.2105/ajph.80.3.282. [DOI] [PMC free article] [PubMed] [Google Scholar]
- Morimoto KC, Van Eenennaam AL, DePeters EJ, Medrano JF. Hot topic: endogenous production of n-3 and n-6 fatty acids in mammalian cells. J Dairy Sci. 2005;88:1142–1146. doi: 10.3168/jds.s0022-0302(05)72780-6. [DOI] [PubMed] [Google Scholar]
- Moser HW, Moser AB. Measurement of saturated very long chain fatty acids in plasma. In: Hommes FA, editor. Techniques in diagnostic human biochemical genetics: A laboratory manual. New York: Wiley-Liss; 1991. p. 177. [Google Scholar]
- Neschen S, Moore I, Regittnig W, Yu CL, Wang Y, Pypaert M, Petersen KF, Shulman GI. Contrasting effects of fish oil and safflower oil on hepatic peroxisomal and tissue lipid content. Am J Physiol Endocrinol Metab. 2002;282:E395–E401. doi: 10.1152/ajpendo.00414.2001. [DOI] [PMC free article] [PubMed] [Google Scholar]
- Neschen S, Morino K, Rossbacher JC, Pongratz RL, Cline GW, Sono S, Gillum M, Shulman GI. Fish oil regulates adiponectin secretion by a peroxisome proliferator-activated receptor-γ-dependent mechanism in mice. Diabetes. 2006;55:924–928. doi: 10.2337/diabetes.55.04.06.db05-0985. [DOI] [PubMed] [Google Scholar]
- Neschen S, Morino K, Dong J, Wang-Fischer Y, Cline GW, Romanelli AJ, Rossbacher JC, Moore IK, Regittnig W, Munoz DS, Kim JH, Shulman GI. n-3 Fatty acids preserve insulin sensitivity in vivo in a peroxisome proliferator-activated receptor-alpha-dependent manner. Diabetes. 2007;56:1034–1041. doi: 10.2337/db06-1206. [DOI] [PubMed] [Google Scholar]
- Pfrommer CA, Erl W, Weber PC. Docosahexaenoic acid induces ciap1 mRNA and protects human endothelial cells from stress-induced apoptosis. Am J Physiol Heart Circ Physiol. 2006;290(6):H2178–H2186. doi: 10.1152/ajpheart.00933.2005. [DOI] [PubMed] [Google Scholar]
- Prasad K. Dietary flax seed in prevention of hypercholesterolemic atherosclerosis. Atherosclerosis. 1997;132:69–76. doi: 10.1016/s0021-9150(97)06110-8. [DOI] [PubMed] [Google Scholar]
- Pugh EL, Kates M. Direct desaturation of eicosatrienoyl lecithin to arachidonoyl lecithin by rat liver microsomes. J Biol Chem. 1977;252:68–73. [PubMed] [Google Scholar]
- Ren B, Thelen AP, Peters JM, Gonzalez FJ, Jump DB. Polyunsaturated fatty acid suppression of hepatic fatty acid synthase and S14 gene expression does not require peroxisome proliferator-activated receptor alpha. J Biol Chem. 1997;272:26827–26832. doi: 10.1074/jbc.272.43.26827. [DOI] [PubMed] [Google Scholar]
- Ross SR, Graves RA, Greenstein A, Platt KA, Shyu HL, Mellovitz B, Spiegelman BM. A fat-specific enhancer is the primary determinant of gene expression for adipocyte P2 in vivo. Proc Natl Acad Sci U S A. 1990;87:9590–9594. doi: 10.1073/pnas.87.24.9590. [DOI] [PMC free article] [PubMed] [Google Scholar]
- Rustan AC, Nossen JO, Christiansen EN, Drevon CA. Eicosapentaenoic acid reduces hepatic synthesis and secretion of triacylglycerol by decreasing the activity of acyl-coenzyme A:1,2-diacylglycerol acyltransferase. J Lipid Res. 1988a;29:1417–1426. [PubMed] [Google Scholar]
- Rustan AC, Nossen JO, Osmundsen H, Drevon CA. Eicosapentaenoic acid inhibits cholesterol esterification in cultured parenchymal cells and isolated microsomes from rat liver. J Biol Chem. 1988b;263:8126–8132. [PubMed] [Google Scholar]
- Rustan AC, Drevon CA. Eicosapentaenoic acid inhibits hepatic production of very low density lipoprotein. J Intern Med Suppl. 1989;731:31–38. doi: 10.1111/j.1365-2796.1989.tb01433.x. [DOI] [PubMed] [Google Scholar]
- Ryan AS, Berman DM, Nicklas BJ, Sinha M, Gingerich RL, Meneilly GS, Egan JM, Elahi D. Plasma adiponectin and leptin levels, body composition, and glucose utilization in adult women with wide ranges of age and obesity. Diabetes Care. 2003;26:2383–2388. doi: 10.2337/diacare.26.8.2383. [DOI] [PubMed] [Google Scholar]
- Schmocker C, Weylandt KH, Kahlke L, Wang J, Lobeck H, Tiegs G, Berg T, Kang JX. Omega-3 fatty acids alleviate chemically induced acute hepatitis by suppression of cytokines. Hepatology. 2007;45:864–869. doi: 10.1002/hep.21626. [DOI] [PubMed] [Google Scholar]
- Spychalla JP, Kinney AJ, Browse J. Identification of an animal omega-3 fatty acid desaturase by heterologous expression in Arabidopsis. Proc Natl Acad Sci USA. 1997;94:1142–1147. doi: 10.1073/pnas.94.4.1142. [DOI] [PMC free article] [PubMed] [Google Scholar]
- Stocco DM, Wang X, Jo Y, Manna PR. Multiple signaling pathways regulating steroidogenesis and steroidogenic acute regulatory protein expression: More complicated than we thought. Mol Endocrinol. 2005;19:2647–2659. doi: 10.1210/me.2004-0532. [DOI] [PubMed] [Google Scholar]
- Storlien LH, Kraegen EW, Chisholm DJ, Ford GL, Bruce DG, Pascoe WS. Fish oil prevents insulin resistance induced by high-fat feeding in rats. Science. 1987;237:885–888. doi: 10.1126/science.3303333. [DOI] [PubMed] [Google Scholar]
- Voss A, Reinhart M, Sankarappa S, Sprecher H. The metabolism of 7,10,13,16,19-docosapentaenoic acid to 4,7,10,13,16,19-docosahexaenoic acid in rat liver is independent of a 4- desaturase. J Biol Chem. 1991;266:19995–20000. [PubMed] [Google Scholar]
- Wakefield SL, Lane M, Schulz SJ, Hebart ML, Thompson JG, Mitchell M. Maternal supply of omega-3 polyunsaturated fatty acids alter mechanisms involved in oocyte and early embryo development in the mouse. Am J Physiol Endocrinol Metab. 2008;294:E425–E434. doi: 10.1152/ajpendo.00409.2007. [DOI] [PubMed] [Google Scholar]
- Wathes DC, Abayasekara DR, Aitken RJ. Polyunsaturated fatty acids in male and female reproduction. Biol Reproduct. 2007;77:190–201. doi: 10.1095/biolreprod.107.060558. [DOI] [PubMed] [Google Scholar]
- Winzell MS, Pacini G, Ahren B. Insulin secretion after dietary supplementation with conjugated linoleic acids and n-3 polyunsaturated fatty acids in normal and insulin-resistant mice. Am J Physiol Endocrinol Metab. 2006;290:E347–E354. doi: 10.1152/ajpendo.00163.2005. [DOI] [PubMed] [Google Scholar]
- Worgall TS, Sturley SL, Seo T, Osborne TF, Deckelbaum RJ. Polyunsaturated fatty acids decrease expression of promoters with sterol regulatory elements by decreasing levels of mature sterol regulatory element-binding protein. J Biol Chem. 1998;273:25537–25540. doi: 10.1074/jbc.273.40.25537. [DOI] [PubMed] [Google Scholar]
- Xia S, Lu Y, Wang J, He C, Hong S, Serhan CN, Kang JX. Melanoma growth is reduced in fat-1 transgenic mice: Impact of omega-6/omega-3 essential fatty acids. Proc Natl Acad Sci USA. 2006;103:12499–12504. doi: 10.1073/pnas.0605394103. [DOI] [PMC free article] [PubMed] [Google Scholar]
- Xu J, Nakamura MT, Cho HP, Clarke SD. Sterol regulatory element binding protein-1 expression is suppressed by dietary polyunsaturated fatty acids. A mechanism for the coordinate suppression of lipogenic genes by polyunsaturated fats. J Biol Chem. 1999;274:23577–23583. doi: 10.1074/jbc.274.33.23577. [DOI] [PubMed] [Google Scholar]
- Xu J, Teran-Garcia M, Park JH, Nakamura MT, Clarke SD. Polyunsaturated fatty acids suppress hepatic sterol regulatory element-binding protein-1 expression by accelerating transcript decay. J Biol Chem. 2001;276:9800–9807. doi: 10.1074/jbc.M008973200. [DOI] [PubMed] [Google Scholar]