Abstract
To study the role of PD-1 in CMV infection and disease after allogeneic HCT, 206 subjects were followed prospectively for immune response to CMV and assigned to three groups based on CMV outcome. They were analyzed retrospectively for PD-1 expression in cryopreserved CD4 and CD8+ T-cells collected at days 40, 90, 120, 150, 180, and 360 post-transplant. HCT recipients with CMV disease (n=14), were compared to recipients with prolonged CMV infection but no CMV disease (median duration of infection: 3 months; n=14) and to similarly transplanted controls with no CMV infection (n=22). The CMV Disease Group had a mean fluorescence intensity (MFI) of PD-1 which was significantly higher in CD4+ (p< 0.05) and CD8+ (p<0.05) lymphocytes at all time points studied. In addition, PD-1 was significantly increased in those with severe acute graft vs host disease (aGVHD), including the No-Viremia group. The data suggest that PD-1 is induced by aGVHD even in absence of CMV infection. This enhancement of PD-1 expression during severe aGVHD and occuring with CMV reactivation, could explain the known role of aGVHD as a risk factor for CMV disease.
Introduction
The PD-1 (programmed death-1) molecule, a member of the CD28 family, is expressed on T cells undergoing apoptosis (1). PD-1 interacts with ligands PD-L1 (B7-H1) and PD-L2 (B70DC), members of the B7 family, resulting in negative inhibitory effects on T cell funtion [for reviews see Chen 2004 (2) and Greenwald 2005 (3)]. Multiple hematopoietic cell types such as CD4+ T cells, CD8+ T cells, NKT cells, B cells and monocytes express PD-1, and the physiologic effects of PD-1 are only beginning to be understood. It is known that a negative immunoregulatory signal leading to loss of T cell effector function is similar to other immuno-inhibitory receptors such as CD72, FcγRIIB and KIR, and that the cytoplasmic PD-1 domain contains similar motifs, the immunoreceptor tyrosine-based inhibitory motif (ITIM) and the immunoreceptor tyrosine-based switch motif (ITSM) (4). Upon activation, PD-1 triggers a cellular cascade involving phosphatases which counter the kinases associated with T cell receptor activation pathways, thereby decreasing T cell activation, cytokine production, and, ultimately, T cell function (1, 5, 6).
The role of PD-1 in graft vs host disease (GVHD) after allogeneic HCT has been studied in mouse models which indicate that PD-1 plays a role in tissue-specific regulation of allogenic responses (7–9). The role of PD-1—PDL1 in control of T-cell mediated alloreactions appears to involve interaction with regulatory T cells (Tregs). PD-1—PD-L1 activation permits a protective effect of Tregs which is abrogated with PD-1 blockade (10). At present, there has been no description of PD-1 expression during GVHD in humans. Because acute and chronic GVHD in human HCT is associated with T cell dysfunction, GVHD has become known as a risk factor for viral (11, 12) and fungal infections (13). In addition, GVHD is treated with immunosuppressive agents, thus creating iatrogenic influences that undoubtedly contribute to the risk for infection. The up-regulation of PD-1 during acute GVHD in HCT recipients could play a role in the pathogenesis of infections.
The concept that T cells lose function during persistent antigenic challenge was observed in a murine model of persistent lymphocytic choriomeningitis virus (14, 15), and evaluation of this model led to investigation of the role of PD-1 expression as a mediator of this T cell dysfunction. Reversal of T cell dysfunction in this model, using antibody to PD-L1, confirmed the role of PD-1/PD-L1 interaction in this process (16). PD-1 associated T cell exhaustion has been implicated in instances such as HIV infection (17–23), HCV infection (24, 25) and HBV infection (26). Of note, HIV infected subjects exhibited elevated PD-1 expression on some but not all HIV tetramer-specific cells and on EBV-specific but not on CMV tetramer-specific cells (20, 21), suggesting an antigen and epitope specificity to the variation in induction of PD-1. However, PD-1 expression has been shown to be increased in those with CMV infection and disease in liver organ transplant recipients, (27) and in renal transplant recipients with CMV viremia (28). The role of the PD-1 response during CMV infection in the HCT setting has yet to be determined.
Patients and methods
Study patients
Two hundred and six consecutive allogeneic HCT recipients, at risk for CMV infection based on pre-HCT CMV antibody in donor or recipient, and transplanted in the period 2001–2006, were followed prospectively for CMV infection and for CMV-specific immunity in CD4- and CD8- lymphocytes at days 40, 90, 120, 150, 180 and 360 days post-transplantation (day 0 = day of stem cell infusion). In addition, PD-1 expression was determined in cryopreserved peripheral blood mononuclear cells (PBMCs), from HCT recipients documented to have one of the following-- CMV disease, prolonged CMV viremia, or no CMV infection. All subjects were enrolled with the approval of the COH Institutional Review Board for prospective evaluation of CD4 and CD8 immunity and CMV infection, and additional permission was obtained from the IRB for the further analysis of the unused frozen specimens for PD-1 analysis.
The description of the HCT recipients studied for PD-1 expression is shown in Table 1. HCT recipients were grouped as follows--the primary group consisted of all subjects with documented CMV disease, the CMV Disease Group (CD, n = 14) as defined by Ljungman et al. (29). In all cases, diagnosis was based on correlation of clinical events and documentation of CMV in either bronchoalveolar lavage (BAL) or in tissue biopsies by histology or by tissue culture. The second group consisted of all subjects with delayed clearance of CMV DNA in plasma as measured by PCR assay after CMV infection, and this required at least 8 positive assays for CMV DNA in plasma over approximately 3 months, the Prolonged Viremia Group (PV, n = 14). The case control group consisted of HCT recipients with close proximity in time to the day of transplant to those in the first and second groups, and with no evidence of CMV reactivation after completing the CMV surveillance period, the Non-Viremic Group (NV, n = 22). All other non-viremic subjects (n = 30) from among the 2001–2006 study population were also analyzed for PD-1 as a control for GVHD-related factors other than CMV which might influence PD-1 expression.
Table 1.
Patient demographic for each group
| Non-Viremic (n=22) | Prolonged Viremia (n=14) | CMV Disease (n=14) | p-value | |
|---|---|---|---|---|
| Patient Age: median (range) | 46 (21–59) | 45 (22–62) | 44 (26–64) | 0.97a |
| Donor Age: median (range) | 44 (20–58) | 43 (27–64) | 39 (19–58) | 0.16a |
| Donor status | ||||
| Sibling | 16 (73%) | 7 (50%) | 7 (50%) | 0.27b |
| URD | 6 (27%) | 7 (50%) | 7 (50%) | |
| Hematopoietic Progenitor Cell Source | ||||
| Bone Marrow | 5 (23%) | 2 (14%) | 0 | 0.16b |
| Peripheral Blood | 17 (77%) | 12 (86%) | 14 (100%) | |
| Diagnosis: | ||||
| Lymphoid Malignancy | 10 (45%) | 7 (50%) | 6 (43%) | 0.89b |
| Myeloid Malignancy | 11 (50%) | 6 (43%) | 6 (43%) | |
| Other | 1 (5%) | 1 (7%) | 2 (14%) | |
| Conditioning Regimen: | ||||
| Myeloablative: | 14 (64%) | 10 (71%) | 8 (57%) | 0.73b |
| Nonmyeloablative: | 8 (36%) | 4 (29%) | 6 (43%) | |
| CMV Serology | ||||
| D+/R+ | 15 (68%) | 10 (71%) | 7 (50%) | 0.73b |
| D+/R- | 3 (13%) | 1 (7%) | 3 (21%) | |
| D-/R+ | 4 (18%) | 3 (21%) | 4 (29%) | |
Kruskal-Wallis test
Fisher's exact test or Chi-square test
Log-rank test
CMV Surveillance
CMV surveillance was done twice weekly, at day +21 to day +100 post-HCT, using a shell vial assay. Preemptive ganciclovir therapy was implemented based on the presence of one CMV positive shell vial culture (30). CMV plasma DNA Q-PCR was performed on plasma collected from the same blood specimen using the CMV-gB DNA as amplification product as previously described (31). Additional CMV surveillance was done beyond day +100 in “high-risk” recipients based on clinical management guidelines at City of Hope (COH). High-risk patients included those with persistent lymphopenia, grade 2–4 aGVHD, or those requiring continued immunosuppression for anti-GVHD therapy.
PD-1 assay
Cryopreserved peripheral blood mononuclear cells (PBMC) were quickly thawed in a 37°C water bath, washed twice with RPMI 1640 medium supplemented with 10% heat-inactivated fetal bovine serum (FBS), penicillin (100U/mL), streptomycin (100µg/mL), and L-glutamine (2mM) and centrifuged at 800 rpm for 10 minutes at 5°C. Tubes, containing about one million cells each, were used either with or without antigen stimulation, namely, CMV-specific pepmix (1µL CMV pp65 PepMix™, Jerini, Berlin, Germany), and incubated for 16 to 20 hours overnight at 37°C, 5% CO2. The cells were then stained with APC Mouse Anti-Human CD8, PE Mouse Anti-Human CD3, APC-Cy7 Mouse Anti-Human CD4, and FITC Mouse Anti-Human PD-1 (CD279) (BD Pharmingen, San Diego, CA) for 30 minutes on ice in the dark. The isotype controls were APC, PE, APC-Cy7, and FITC conjugated Mouse IgG1 κ Isotype (BD Pharmingen, San Diego, CA). The cells were analyzed using the FACSCanto™ flow cytometer, a Fluorescence Activated Cell Sorter (FACS) (BD, San Jose, CA). Total events (30K to 50K) were recorded using FACSDiva software, and analyzed using FCS Express Version 3.0 (De Novo Software, Los Angeles, CA). The lymphocytes were gated from the dot-plot defined by side scatter (SSC) and forward scatter (FSC) to determine the CD8+ or CD4+/PD-1+ population. The mean fluorescence intensity (MFI) of PD-1 was defined as the geometric mean of fluorescence within the gated area. This parameter is a measure of the average level of expression of the PD-1 molecule on a cell surface.
Intracellular Cytokine Assay
An intracellular cytokine assay (ICC), using interferon-γ (IFN-γ) as the marker protein, was performed on T cells as previously described (31) using Brefeldin A (25 µg/ml, Sigma, St. Louis, MO) to block the release of IFN-γ. After stimulation with either CMV Ag (Advanced Biotech, Paterson, NJ) (for CD4) or pp65 peptides (for CD8), the cells were fixed, then stained with anti-human CD4, CD8 and IFN-γ antibodies for FACS analysis.
Statistical analysis
Non-parametric analyses were performed using the GraphPad Prism® 5 (www.graphpad.com) software as follows: the Kruskal-Wallis test was used to compare the PD-1 MFI as well as the number of PD-1 positive CD4+ and CD8+ cells among the three groups (NV,PV and CD). A receiver-operator characteristic (ROC) curve was used to determine sensitivity and specificity of the PD-1 MFI patient values across the full range of cutoffs for positive and negative outcome for each group. Using SAS (SAS institute, Cary, NC), Cochran-Mantel-Haenszel chi-square tests were performed to assess whether PD-1 MFI, dichotomized into less than or greater than 200, correlated with outcome transplant parameters such as donor/recipient serology or CD4+/CD8+/IFN-γ+ adaptive immune responses when stratified by acute GVHD grades 0, I vs II, III, IV.
Results
Demographics of the study subjects
The demographic characteristics of HCT recipients in each group, the Non-Viremic Group, the Prolonged Viremia Group, and the CMV Disease Group, are described in Table 1. The groups were similar in median age, hematopoietic progenitor cell source, myeloablative vs non-myeloablative conditioning regimens used, and underlying diagnoses. The pairing of CMV antibody positive donor/recipient was similar among the three groups.
There was no difference in CMV infection in the CD and PV groups. The median time to first Q-PCR positivity was 35.5 days in the PV Group and 37 days in the CD Group. Among those with at least one positive plasma Q-PCR assay, 50% had a positive CMV blood culture by shell vial assay at some time during the active surveillance period. The median time to positive CMV shell culture was 87 days in the CD Group and 56.5 days in the PV Group. Within the CD Group, 29% had CMV pneumonia and 71% had CMV gastroenterocolitis. The median time to CD occurrence was 108 days post-HCT (minimum: 28 days; maximum: 297 days).
As anticipated, there was an increase in incidence of acute GVHD grade >2 in the CD group (86%) and in the PV Group (79%) compared to the NV Group (38%) (p = 0.006 using the Chi-square test). There was no significant increase in chronic GVHD among the groups (see table 2). The groups with CMV infection or disease had more exposure to corticosteroids, as was expected from their increased severity of acute GVHD. Of the 14 recipients in the Prolonged Viremia group, 11 were treated with ganciclovir based on a positive blood culture, 1 was treated prophylactically during a GVHD flare-up, and 2 were never treated due to persistently negative blood cultures. The overall survival rate at one year post-HCT was 71% for the Prolonged Viremia and 64% for the CMV Disease subjects, but it was 96% for the Non-Viremic group (Logrank test p= 0.007).
Table 2.
Univariable analysis of outcome in each group
| Non-Viremic P (n=22) | rolonged Viremia (n=14) | CMV Disease (n=14) | p-value | |
|---|---|---|---|---|
| Acute GVHD | ||||
| Grades 0–1 | 14 (62%) | 3 (21%) | 2 (14%) | 0.006b |
| Grades 2–3–4 | 8 (38%) | 11 (79%) | 12 (86%) | |
| Steroids (mg/kg): number (%) | ||||
| none | 6 (27%) | 0 | 2 (14%) | 0.01b |
| 0<1 | 13 (59%) | 5 (36%) | 9 (64%) | |
| >1+ | 3 (14%) | 9 (64%) | 3 (21%) | |
| Chronic GVHD: number (%) | ||||
| None | 6 (24%) | 2(14%) | 2 (14%) | 0.62b |
| Limited | 1 (5%) | 3 (21%) | 2 (14%) | |
| Extensive | 15 (71%) | 9 (65%) | 10 (72%) | |
| PD-1 MFI on CD4+ cellsa | ||||
| < 200 | 14 (64%) | 7 (50%) | 1 (7%) | 0.003b |
| > 200 | 8 (36%) | 7 (50%) | 13 (93%) | |
| PD-1 MFI on CD8+ cellsa | ||||
| < 200 | 9 (41%) | 4 (29%) | 0 14 | 0.02b |
| > 200 | 13 (59%) | 10 (71%) | 14(100%) | |
| CD4+/IFN-γ+ cellsc | ||||
| < 1×10⁶ | 9 (41%) | 7 (50%) | 7 (50%) | 0.81b |
| > 1×10⁶ | 13 (59%) | 7 (50%) | 7 (50%) | |
| CD8+/IFN-γ+ cellsc | ||||
| < 1×10⁶ | 4 (18%) | 4 (29%) | 1 (7%) | 0.34b |
| > 1×10⁶ | 18 (82%) | 10 (71%) | 13 (93%) | |
| Overall 1 year survival | ||||
| 0.96 (0.72,0.99) | 0.71 (0.41,0.88) | 0.64 (0.34,0.83) | 0.007c | |
highest MFI during 1 year post-HCT
Chi-square test
highest number of cells during 1 year post-HCT
CD4+/PD-1+ T cells expression in HCT recipients with chronic CMV infection and CMV disease
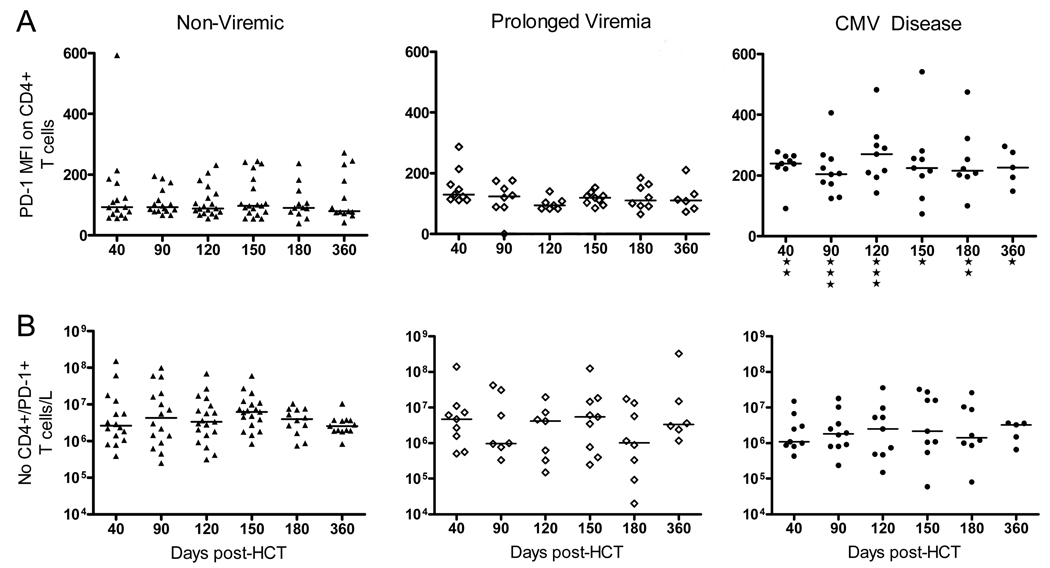
The CD4+ cells were analyzed for each clinical group and shown in Figure 1 by their PD-1 mean fluorescence intensity (MFI) (Figure 1A) and number of CD4+/PD-1+ cells/L (Figure 1B). The median value of PD-1 MFI was approximately 100 in the NV Group and in the PV Group, but it was above 200 in the CD Group. Using the Kruskal-Wallis test to compare the median MFI values in the 3 groups, only the MFI in the CD Group was significantly different from the NV Group for each day 40, 90, 120, 150, 180 to 360 (from p<0.01 to p< 0.05, Figure 1A). In contrast, the PV Group did not show a detectable difference in MFI when compared to the NV Group. The assay provided the same results whether pp65 pepmix or no peptide were included in the overnight incubation (results not shown). Of note, the total number of CD4+/PD-1+ T cells/L were similar in all groups. This is shown more graphically using a scatter plot of values for each group (Figure 1).
Figure 1. Expression of PD-1 in CD4+ T cells in the Non-viremic (NV), the Prolonged Viremia (PV) and the CMV Disease (CD) Groups.
A) Mean fluorescence intensity (MFI) of PD-1 is shown at indicated time post-HCT for each group; B) Number of CD4+/PD-1+ T cells per liter is represented at the same time intervals. The median value in each group is shown as a horizontal line. “*” = p<0.05, “**” = p<0.01 and “***” = p< 0.001 using the Kruskal-Wallis test comparing the three groups, at each time interval post-HCT.
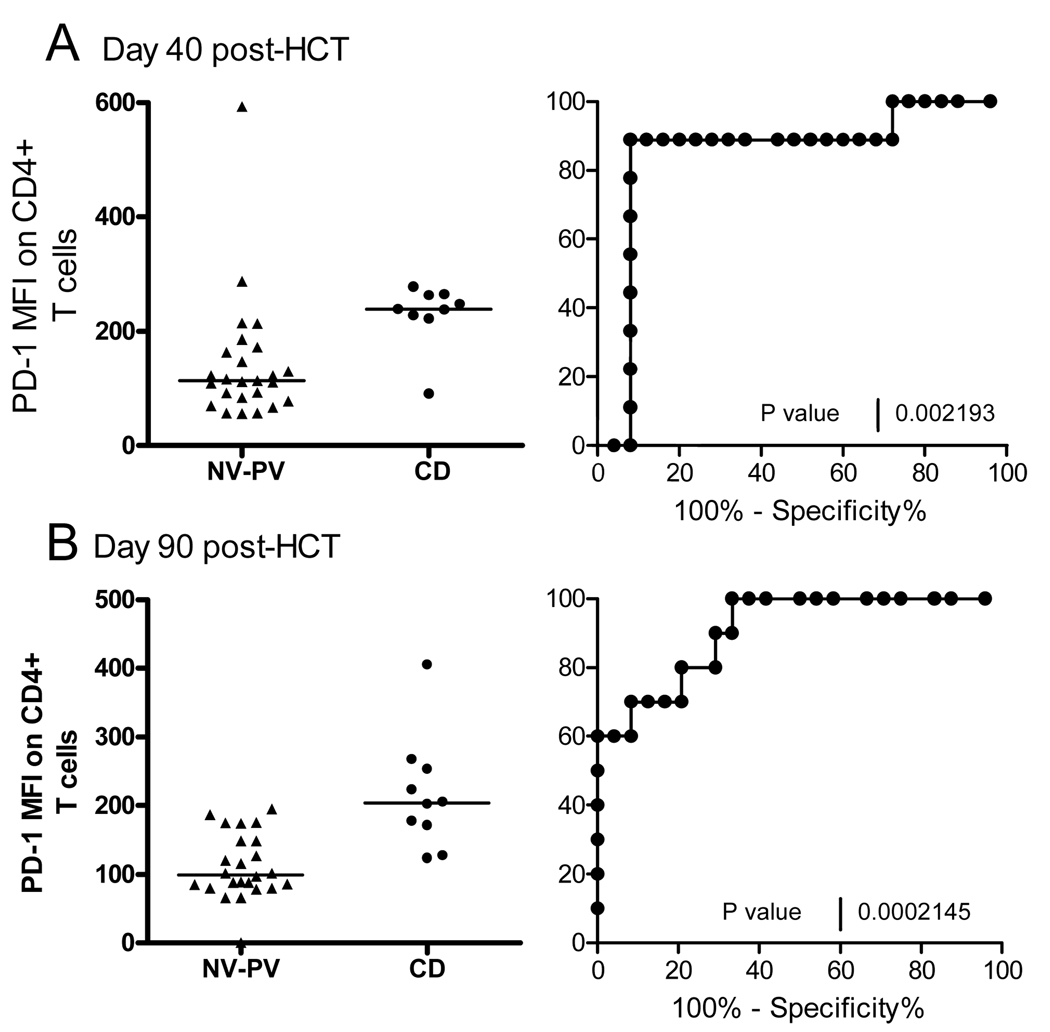
An attempt was then made to assess the predictive MFI values for CD by combining the NV and PV MFI values as control values and compare them to the CD values at day 40 (Figure 2A) and 90 (Figure 2B) post-HCT. A receiver-operator curve (ROC) analysis showed that at day 40 post-HCT, 80% subjects with CD (% sensitivity) had a CD4+/PD-1+ MFI >179 (see Figure 2A) and, at day 90, an MFI >174.5 (see Figure 2B). The ROC curve, shown as sensitivity (%) vs 100%-specificity (%) in Figure 2 (p=0.002 for day 40 and p=0.0002 for day 90 post-HCT), represents an area under the curve equal to 0.84 for day 40 and 0.90 for day 90 post-HCT.
Figure 2. ROC analysis of CD4+/PD-1+ MFI in Non-Viremic (NV) and Prolonged Viremia (PV) vs CMV Disease Group (CD).
A) MFI scatter plot and ROC curve is shown for each group at day 40 and B)at day 90 post-HCT
Elevated CD8+/PD-1+ T cells expression association with CMV disease and not with prolonged CMV infection
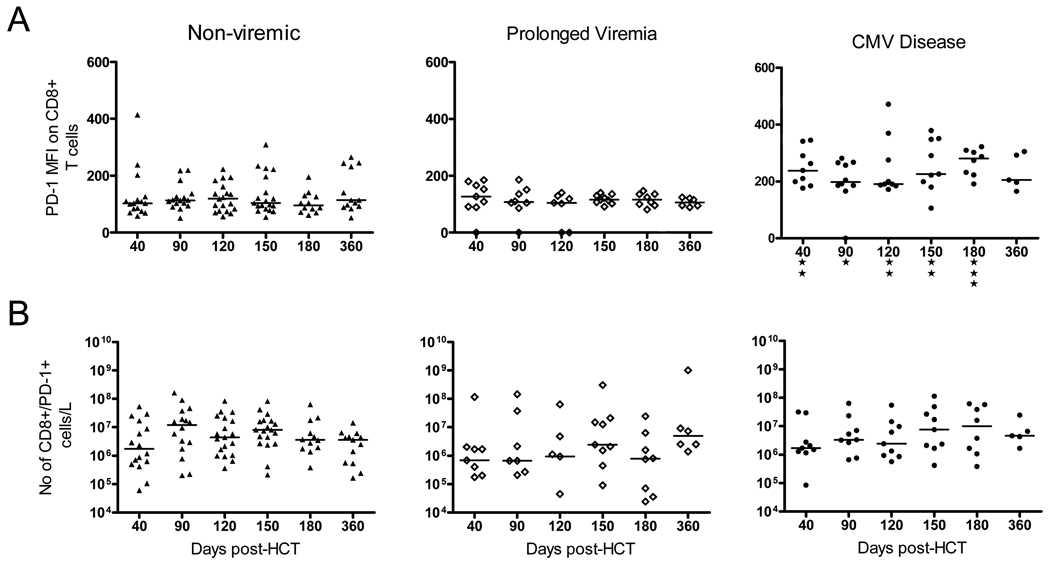
Similarly, the CD8+/PD-1+ T cells showed increased expression of PD-1, as measured by MFI in the CD Group, and this was significantly different from the NV Group (p<0.05 by Kruskal-Wallis test) up to 1 year post-HCT (See Figure 3). This Kruskal-Wallis test was used to compare the median of each group to each other and used the Dunn’s post test to compare the difference in the sum of ranks between 2 groups. The results consistently showed not only that the PD-1 MFI in the CD Group was significantly higher than that in the NV Group but was also significantly higher than the PV group at all time points. Again, in terms of total number of CD8+ cells expressing PD-1, there were no differences between groups (see Figure 3B). As was the case with CD4+/PD-1+ T cells, the MFI of the CD8 cells was increased in the CD Group.
Figure 3. Expression of PD-1 in CD8+ T cells in the Non-viremic (NV), the Prolonged Viremia (PV) and the CMV Disease (CD) Groups.
A) Mean fluorescence intensity (MFI) of PD-1 is shown at indicated times post-HCT for each group; B) Number of CD8+/PD-1+ T cells per liter is represented. The median value in each group is shown as a horizontal line. “*”= p<0.05, “**” = p<0.01 and “***” = p< 0.001 using the Kruskal-Wallis test comparing the three groups, at each time interval post-HCT.
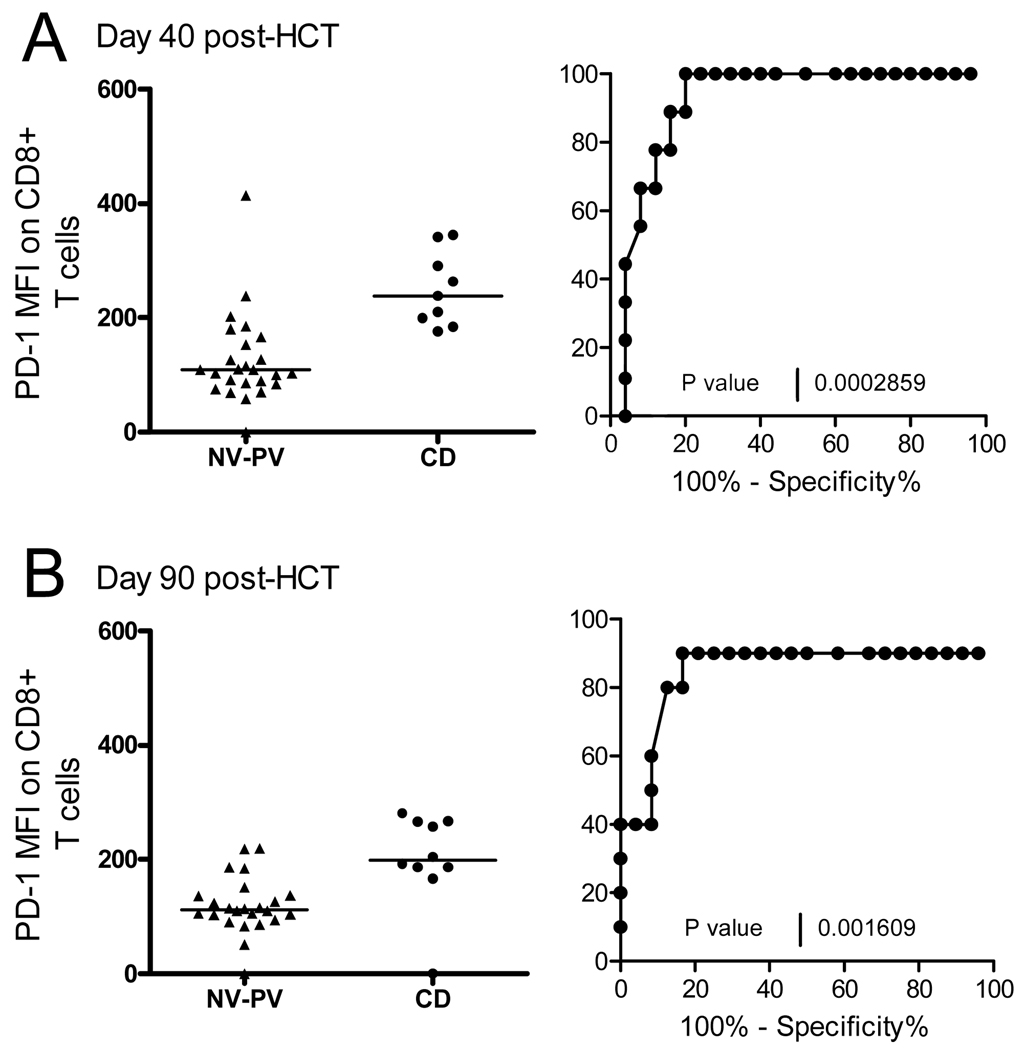
The predictive value of the CD8+/PD-1+ MFI for CD was assessed by ROC analysis against the combined values of the NV and the PV Group. MFI values >171 at day 40 (Figure 4 A) and >158 at day 90 post-HCT (Figure 4B) were predictive for 80% of the subjects with CMV disease (p=0.0002 and p=0.002 respectively).
Figure 4. ROC analysis of CD8+/PD-1+ MFI in Non-Viremic (NV) and Prolonged Viremia (PV) vs CMV Disease groups (CD).
A) MFI scatter plot and ROC curve is shown for each group at day 40 and B) at day 90 post-HCT
PD-1 MFI and clinical outcome
To assess whether the PD-1 MFI was the result of effect from any other factors than the Prolonged Viremia and CMV Disease, a univariable analysis was done, shown in Table 2, to cover parameters such as aGVHD, steroids administration, chronic GVHD and PD1-MFI. The PD-1 MFI was dichotomized, based on the ROC analysis, in greater than and less than 200. The adaptive immune response was also added as a risk parameter dichotomized into groups that reached levels greater or less than 1×10⁶ CD4+ or CD8+/IFN-γ cells/per liter during the first year of study. The occurrence aGVHD (p=0.006), the use of steroid treatment (p=0.01), and the PD-1 MFI levels on CD4+ (p=0.003) or CD8+ cells (p=0.02) were the only parameters that affected CMV outcome. The adaptive immune response was not affected (see Table 2).
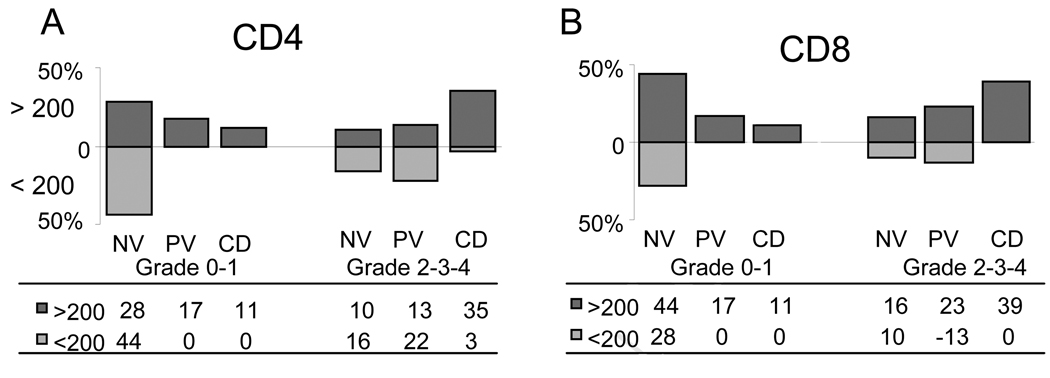
To test the aGVHD effect on MFI levels in the 3 Groups, a Cochran-Mantel-Haenszel test was used that compared multiple contingency tables. As shown in Figure 5A for CD4+ and 5B for CD8+ cells, there is a general association between the PD-1 MFI (< or >200) controlling for aGVHD grade 0-I vs II-IV. The p value was 0.009 for CD4+ cells and 0.01 for CD8+ meaning that there was a significant association between the PD-1 MFI levels and the aGVHD grade among the CMV groups. Figure 5 represents this analysis where the overall percentage of subjects above and below the baseline (MFI=200) within each aGVHD group (0-I or II-IV) are shown. In contrast, when recipients were analyzed by a Cochran-Mantel-Haenszel test, based on whether they achieved greater than 1×10⁶ CD4+/IFN-γ cells per liter or CD8+/IFN-γ cells, there was no association among the three groups in terms of the level of PD-1 expression and immunity (p=0.76 for CD4+ cells and p=0.38 for CD8+ cells).
Figure 5. Proportion of subjects showing PD-1 MFI levels (< or > 200) controlling for aGVHD grade 0-I and grade II+ for each CMV group.
Greater than 200 MFI is shown above the axis, less than 200 MFI below. A) A Cochran-Mantel-Haenszel test between the two aGVHD group, is shown for CD4+ cells (p=0.0009) and in B) for CD8+ cells (p=0.01).
Acute GVHD and PD-1 expression
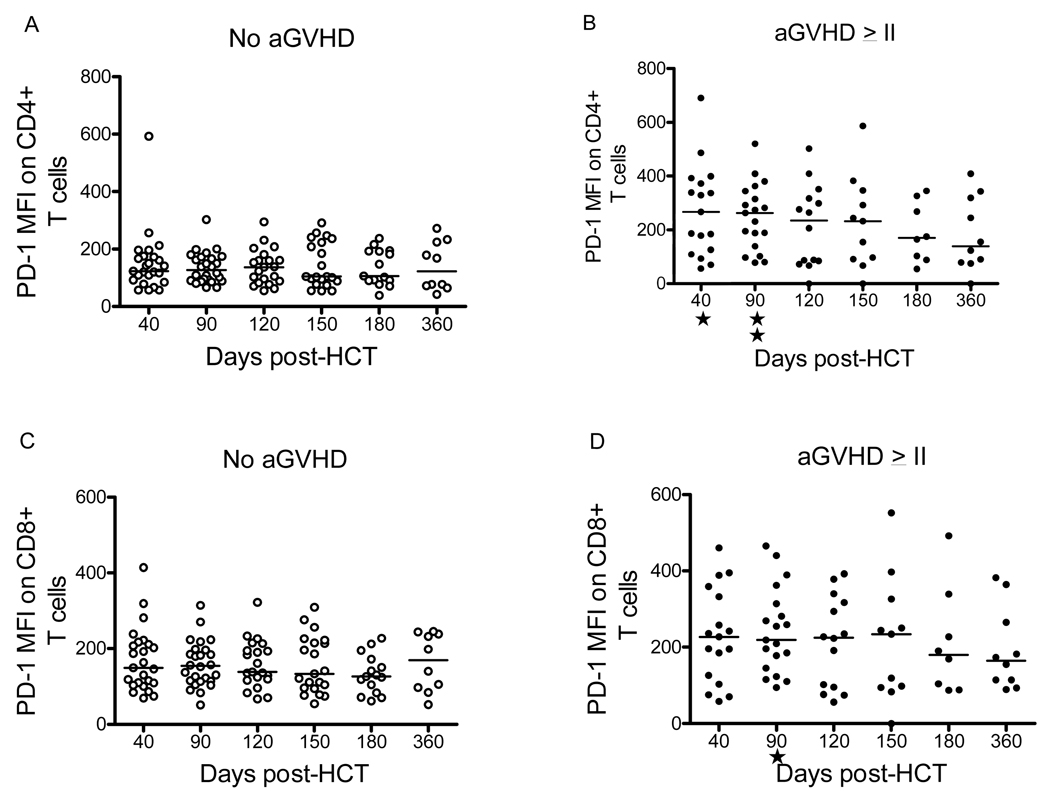
The demographics in Table 2 showed that the occurrence of severe aGVHD grade II-IV, but not chronic GVHD, was significantly associated with both the PV Group and with the CD Group. Assuming that persistent antigenic stimulation leads in some way to enhanced PD-1 expression, we investigated whether the higher MFI found in the CD group was due primarily to the presence of aGVHD. To dissociate the effects of aGVHD from those of CMV infection, we evaluated for PD-1 expression of the non-viremic (NV) subjects (n = 52), in the original cohort of 206 prospectively studied subjects. Of these 52 subjects, 30 had aGVHD grade 0-I and 22 had aGVHD grade II-IV. The demographic characteristics of these non-viremic recipients were not different from the overall group in terms of median age, gender, underlying diagnosis, type of transplant, conditioning regimen, or donor/recipient CMV serology. However, the PD-1 MFI values in recipients with aGVHD grade II-IV were significantly higher than those from patients with aGVHD grade 0-I at days 40 (Mann-Whitney test p=0.014) and 90 (p=0.001) post-HCT for CD4+ lymphocytes and at day 90 (p=0.01) for CD8+ cells (see Figure 6).
Figure 6. PD-1 Mean Fluorescence Intensive in CD4+ and CD8+ T cells of Non-viremic patients with or without GVHD.
Mean fluorescent intensity (MFI) is shown for patients with GVHD grade 0-I (panels A and C, labeled “No aGVHD”) or with GVHD >grade II (panels B and D, labeled “aGVHD >II”). Mann-whitney test was used to establish the association with MFI in CD4+/PD-1+ and h aGVHD >II (p= 0.01 at day 40 and p=0.001 at day 90) and between MFI of CD8+/PD-1+ cells and aGVHD >II on day 90 post-HCT (p= 0.01).
Discussion
This study utilized a cohort of patients prospectively studied for CMV infection and immunity, and then retrospectively tested for PD-1 expression based on the severity of CMV infection and disease. Because of published experience with other chronic viral infections such as HIV (21–23), HCV (24, 25), and HBV infection (26), it was hypothesized that both prolonged CMV viremia and CMV disease would be associated with enhanced PD-1 expression. The results, however, indicated that PD-1 expression is not associated with prolonged viremia but with CMV disease and with aGVHD.
In this study, CMV-infected subjects having prolonged CMV infection with no disease were analyzed as a separate group to determine if there were factors different from those either with no CMV infection or those with CMV disease. Neither PD-1 positive cell numbers nor intensity of PD-1 expression in CD4+ or CD8+/PD-1+ cells of the PV group were significantly different from the NV group. Occurrences of decreased cytokine production in response to viral antigen have been observed in HIV (20, 21) and HCV infections (24, 25). In our study, there was no correlation between PD-1 expression and CMV specific immunity. However, the group with prolonged CMV infection did have significantly more aGVHD than the NV group and received significantly more corticosteroid therapy (see Table 2). Thus, it is likely that the persistence of CMV infection in this PV group was due to iatrogenic immunosuppression and not to PD-1 induced T cell exhaustion.
In liver organ transplant subjects, higher PD-1 levels have been noted to be significantly associated with CMV disease and viremia, and this enhanced PD-1 expression was found in the total population of CD8+ cells (32). Recently, the functional deficiency of CMV-specific T cells in renal transplant recipients with CMV infection has been linked to PD-1 with in vitro evidence of reversal of the cytokine responsiveness with PD-L1 blockade (28). It is our experience in HCT recipients, however, that enhanced PD-1 expression is not due to viremia per se, since those with chronic CMV did not have elevated PD-1 expression.
It has been postulated that chronic antigen exposure is a requirement for induction of T cell exhaustion (14–17, 20, 21). This inhibitory response in the presence of chronic antigenic stimulation is presumably protective, and the absence PD-1 and the associated autoimmune diseases (4), suggests a role for PD-1 in prevention of immunopathology. PD-1 expression has been linked to alloreactivity in lymphocytes in animal models (7, 8). Thus, it is likely that chronic allogeneic stimulation would be associated with enhanced PD-1 expression after HCT, and this study observed for the first time that PD-1 MFI was significantly higher in HCT recipients with acute GVHD. Even when CMV infection was removed from the analysis, patients with grade II-IV aGVHD had significantly higher PD-1 MFI at days 40 and 90 post-HCT in CD4+/CD8+ lymphocytes (see Figure 6). This different expression of PD-1 during aGVHD in the group with no CMV infection was not observed at later times in the first year after HCT nor was it associated with chronic GVHD. Thus, PD-1 expression in CD4+ cells was significantly associated with timing and severity of aGVHD, and this is the first demonstration that aGVHD activates PD-1 expression in HCT in humans. However, the study was not designed to describe the timing of aGVHD and the onset of enhanced PD-1 expression and the role of PD-1 in the outcome and severity of GVHD deserves further study.
The presence of severe aGVHD was significantly associated with both prolonged CMV viremia and CMV disease (see Table 1), but enhanced PD-1 expression was correlated only with CMV disease. Using a ROC analysis, the PD-1 expression at day 40 or 90 post-HCT was predictive of future CMV disease (see ROC analysis in Figure 2 and Figure 4). It is interesting to note that those with CMV disease and those with prolonged CMV viremia had differences in PD-1 expression but similar rates of severe aGVHD (86% vs 79%, respectively). Thus, aGVHD by itself does not explain the variation in PD-1 expression in the Prolonged Viremia Group vs CMV Disease Group. Additional studies will be necessary to clarify the role of aGVHD and host factors that could contribute to variations in PD-1 expression. It is known, for example, that variations in splice patterns of PD-1 mRNA regulate the level of functional PD-1 in the cell (33).
Further studies are needed to test the hypothesis that PD-1 expression and T cell exhaustion, resulting from aGVHD, leads to progressive CMV infection. In this regard, it is still not clear how best to identify patients at highest risk for CMV disease after allogeneic HCT. Our data suggest that at early time’s post-HCT, the mean level of PD-1 expression on CD4 and CD8 cells is predictive of future CMV disease. A larger study will be necessary to confirm whether PD-1 expression can become a clinically useful tool to manage patients.
Acknowledgments
This work was supported by US Public Health Service grant no. RO1 AI58148 to JAZ; P01-CA30206 to S.J.F., J.A.Z. and D.J.D.; R01-CA77544 to D.J.D.; and M01-RR00043-38 in support of the General Clinical Research Center at City of Hope.
We thank Valerie Gonzales for her excellent technical expertise, the staff of the General Clinical Research Center for sample preparation and the coordinator nursing staff of the Bone Marrow Transplantation Unit for patient recruitment and obtaining the samples.
Footnotes
Publisher's Disclaimer: This is a PDF file of an unedited manuscript that has been accepted for publication. As a service to our customers we are providing this early version of the manuscript. The manuscript will undergo copyediting, typesetting, and review of the resulting proof before it is published in its final citable form. Please note that during the production process errors may be discovered which could affect the content, and all legal disclaimers that apply to the journal pertain.
References
- 1.Okazaki T, Honjo T. The PD-1-PD-L pathway in immunological tolerance. Trends Immunol. 2006;27:195–201. doi: 10.1016/j.it.2006.02.001. [DOI] [PubMed] [Google Scholar]
- 2.Chen L. Co-inhibitory molecules of the B7-CD28 family in the control of T-cell immunity. Nat Rev Immunol. 2004;4:336–347. doi: 10.1038/nri1349. [DOI] [PubMed] [Google Scholar]
- 3.Greenwald RJ, Freeman GJ, Sharpe AH. The B7 family revisited. Annu Rev Immunol. 2005;23:515–548. doi: 10.1146/annurev.immunol.23.021704.115611. [DOI] [PubMed] [Google Scholar]
- 4.Okazaki T, Honjo T. PD-1 and PD-1 ligands: from discovery to clinical application. Int Immunol. 2007;19:813–824. doi: 10.1093/intimm/dxm057. [DOI] [PubMed] [Google Scholar]
- 5.Okazaki T, Maeda A, Nishimura H, Kurosaki T, Honjo T. PD-1 immunoreceptor inhibits B cell receptor-mediated signaling by recruiting src homology 2-domain-containing tyrosine phosphatase 2 to phosphotyrosine. Proc Natl Acad Sci U S A. 2001;98:13866–13871. doi: 10.1073/pnas.231486598. [DOI] [PMC free article] [PubMed] [Google Scholar]
- 6.Chemnitz JM, Parry RV, Nichols KE, June CH, Riley JL. SHP-1 and SHP-2 associate with immunoreceptor tyrosine-based switch motif of programmed death 1 upon primary human T cell stimulation, but only receptor ligation prevents T cell activation. J Immunol. 2004;173:945–954. doi: 10.4049/jimmunol.173.2.945. [DOI] [PubMed] [Google Scholar]
- 7.Blazar BR, Carreno BM, Panoskaltsis-Mortari A, et al. Blockade of programmed death-1 engagement accelerates graft-versus-host disease lethality by an IFN-gamma-dependent mechanism. J Immunol. 2003;171:1272–1277. doi: 10.4049/jimmunol.171.3.1272. [DOI] [PubMed] [Google Scholar]
- 8.Schilbach K, Schick J, Wehrmann M, et al. PD-1-PD-L1 pathway is involved in suppressing alloreactivity of heart infiltrating t cells during murine gvhd across minor histocompatibility antigen barriers. Transplantation. 2007;84:214–222. doi: 10.1097/01.tp.0000268074.77929.54. [DOI] [PubMed] [Google Scholar]
- 9.Habicht A, Kewalaramani R, Vu MD, et al. Striking dichotomy of PD-L1 and PD-L2 pathways in regulating alloreactive CD4(+) and CD8(+) T cells in vivo. Am J Transplant. 2007;7:2683–2692. doi: 10.1111/j.1600-6143.2007.01999.x. [DOI] [PubMed] [Google Scholar]
- 10.Kitazawa Y, Fujino M, Wang Q, et al. Involvement of the programmed death-1/programmed death-1 ligand pathway in CD4+CD25+ regulatory T-cell activity to suppress alloimmune responses. Transplantation. 2007;83:774–782. doi: 10.1097/01.tp.0000256293.90270.e8. [DOI] [PubMed] [Google Scholar]
- 11.Ljungman P, Perez-Bercoff L, Jonsson J, et al. Risk factors for the development of cytomegalovirus disease after allogeneic stem cell transplantation. Haematologica. 2006;91:78–83. [PubMed] [Google Scholar]
- 12.Ozdemir E, Saliba RM, Champlin RE, et al. Risk factors associated with late cytomegalovirus reactivation after allogeneic stem cell transplantation for hematological malignancies. Bone Marrow Transplant. 2007;40:125–136. doi: 10.1038/sj.bmt.1705699. [DOI] [PubMed] [Google Scholar]
- 13.Jantunen E, Ruutu P, Niskanen L, et al. Incidence and risk factors for invasive fungal infections in allogeneic BMT recipients. Bone Marrow Transplant. 1997;19:801–808. doi: 10.1038/sj.bmt.1700737. [DOI] [PubMed] [Google Scholar]
- 14.Zajac AJ, Blattman JN, Murali-Krishna K, et al. Viral immune evasion due to persistence of activated T cells without effector function. J Exp Med. 1998;188:2205–2213. doi: 10.1084/jem.188.12.2205. [DOI] [PMC free article] [PubMed] [Google Scholar]
- 15.Gallimore A, Glithero A, Godkin A, et al. Induction and exhaustion of lymphocytic choriomeningitis virus-specific cytotoxic T lymphocytes visualized using soluble tetrameric major histocompatibility complex class I-peptide complexes. J Exp Med. 1998;187:1383–1393. doi: 10.1084/jem.187.9.1383. [DOI] [PMC free article] [PubMed] [Google Scholar]
- 16.Barber DL, Wherry EJ, Masopust D, et al. Restoring function in exhausted CD8 T cells during chronic viral infection. Nature. 2006;439:682–687. doi: 10.1038/nature04444. [DOI] [PubMed] [Google Scholar]
- 17.Freeman GJ, Wherry EJ, Ahmed R, Sharpe AH. Reinvigorating exhausted HIV-specific T cells via PD-1-PD-1 ligand blockade. J Exp Med. 2006;203:2223–2227. doi: 10.1084/jem.20061800. [DOI] [PMC free article] [PubMed] [Google Scholar]
- 18.Zhang JY, Zhang Z, Wang X, et al. PD-1 up-regulation is correlated with HIV-specific memory CD8+ T-cell exhaustion in typical progressors but not in long-term nonprogressors. Blood. 2007;109:4671–4678. doi: 10.1182/blood-2006-09-044826. [DOI] [PubMed] [Google Scholar]
- 19.D'Souza M, Fontenot AP, Mack DG, et al. Programmed death 1 expression on HIV-specific CD4+ T cells is driven by viral replication and associated with T cell dysfunction. J Immunol. 2007;179:1979–1987. doi: 10.4049/jimmunol.179.3.1979. [DOI] [PubMed] [Google Scholar]
- 20.Streeck H, Brumme ZL, Anastario M, et al. Antigen load and viral sequence diversification determine the functional profile of HIV-1-specific CD8+ T cells. PLoS Med. 2008;5:e100. doi: 10.1371/journal.pmed.0050100. [DOI] [PMC free article] [PubMed] [Google Scholar]
- 21.Day CL, Kaufmann DE, Kiepiela P, et al. PD-1 expression on HIV-specific T cells is associated with T-cell exhaustion and disease progression. Nature. 2006;443:350–354. doi: 10.1038/nature05115. [DOI] [PubMed] [Google Scholar]
- 22.Trautmann L, Janbazian L, Chomont N, et al. Upregulation of PD-1 expression on HIV-specific CD8+ T cells leads to reversible immune dysfunction. Nat Med. 2006;12:1198–1202. doi: 10.1038/nm1482. [DOI] [PubMed] [Google Scholar]
- 23.Petrovas C, Casazza JP, Brenchley JM, et al. PD-1 is a regulator of virus-specific CD8+ T cell survival in HIV infection. J Exp Med. 2006;203:2281–2292. doi: 10.1084/jem.20061496. [DOI] [PMC free article] [PubMed] [Google Scholar]
- 24.Urbani S, Amadei B, Tola D, et al. PD-1 expression in acute hepatitis C virus (HCV) infection is associated with HCV-specific CD8 exhaustion. J Virol. 2006;80:11398–11403. doi: 10.1128/JVI.01177-06. [DOI] [PMC free article] [PubMed] [Google Scholar]
- 25.Radziewicz H, Ibegbu CC, Fernandez ML, et al. Liver-infiltrating lymphocytes in chronic human hepatitis C virus infection display an exhausted phenotype with high levels of PD-1 and low levels of CD127 expression. J Virol. 2007;81:2545–2553. doi: 10.1128/JVI.02021-06. [DOI] [PMC free article] [PubMed] [Google Scholar]
- 26.Maier H, Isogawa M, Freeman GJ, Chisari FV. PD-1:PD-L1 interactions contribute to the functional suppression of virus-specific CD8+ T lymphocytes in the liver. J Immunol. 2007;178:2714–2720. doi: 10.4049/jimmunol.178.5.2714. [DOI] [PubMed] [Google Scholar]
- 27.La Rosa C, Limaye AP, Krishnan A, Longmate J, Diamond DJ. Longitudinal assessment of cytomegalovirus (CMV)-specific immune responses in liver transplant recipients at high risk for late CMV disease. J Infect Dis. 2007;195:633–644. doi: 10.1086/511307. [DOI] [PubMed] [Google Scholar]
- 28.Sester U, Presser D, Dirks J, Gartner BC, Kohler H, Sester M. PD-1 expression and IL-2 loss of cytomegalovirus- specific T cells correlates with viremia and reversible functional anergy. Am J Transplant. 2008;8:1486–1497. doi: 10.1111/j.1600-6143.2008.02279.x. [DOI] [PubMed] [Google Scholar]
- 29.Ljungman P, Griffiths P, Paya C. Definitions of cytomegalovirus infection and disease in transplant recipients. Clin Infect Dis. 2002;34:1094–1097. doi: 10.1086/339329. [DOI] [PubMed] [Google Scholar]
- 30.Gleaves CA, Smith TF, Shuster EA, Pearson GR. Comparison of standard tube and shell vial cell culture techniques for the detection of cytomegalovirus in clinical specimens. J Clin Microbiol. 1985;21:217–221. doi: 10.1128/jcm.21.2.217-221.1985. [DOI] [PMC free article] [PubMed] [Google Scholar]
- 31.Gallez-Hawkins G, Thao L, Lacey SF, et al. Cytomegalovirus immune reconstitution occurs in recipients of allogeneic hematopoietic cell transplants irrespective of detectable cytomegalovirus infection. Biol Blood Marrow Transplant. 2005;11:890–902. doi: 10.1016/j.bbmt.2005.07.008. [DOI] [PubMed] [Google Scholar]
- 32.La Rosa C, Krishnan A, Longmate J, et al. Programmed death-1 expression in liver transplant recipients as a prognostic indicator of cytomegalovirus disease. J Infect Dis. 2008;197:25–33. doi: 10.1086/523652. [DOI] [PubMed] [Google Scholar]
- 33.Nielsen C, Ohm-Laursen L, Barington T, Husby S, Lillevang ST. Alternative splice variants of the human PD-1 gene. Cell Immunol. 2005;235:109–116. doi: 10.1016/j.cellimm.2005.07.007. [DOI] [PubMed] [Google Scholar]


