Abstract
The MADS genes encode a family of transcription factors, some of which control the identities of floral organs in flowering plants. To understand the role of MADS genes in the evolution of floral organs, five MADS genes (CMADS1, 2, 3, 4, and 6) were cloned from the fern Ceratopteris richardii, a nonflowering plant. A gene tree of partial amino acid sequences of seed plant and fern MADS genes showed that the fern genes form three subfamilies. All members of one of the fern MADS subfamilies have additional amino-terminal amino acids, which is a synapomorphic character of the AGAMOUS subfamily of the flowering plant MADS genes. Their structural similarity indicates a sister relationship between the two subfamilies. The temporal and spatial patterns of expression of the five fern MADS genes were assessed by Northern blot analyses and in situ hybridizations. CMADS1, 2, 3, and 4 are expressed similarly in the meristematic regions and primordia of sporophyte shoots and roots, as well as in reproductive structures, including sporophylls and sporangial initials, although the amount of expression in each tissue is different in each gene. CMADS6 is expressed in gametophytic tissues but not in sporophytic tissues. The lack of organ-specific expression of MADS genes in the reproductive structures of the fern sporophyte may indicate that the restriction of MADS gene expression to specific reproductive organs and the specialization of MADS gene functions as homeotic selector genes in the flowering plant lineage were important in floral organ evolution.
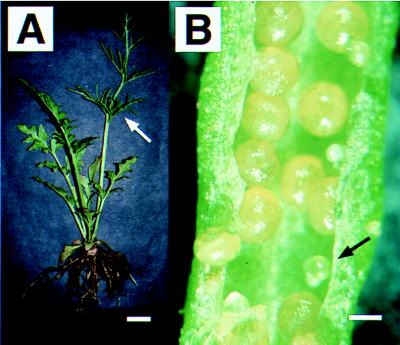
The reproductive structure of angiosperms, the flower, typically bears four types of organs: sepals, petals, stamens, and carpels. Within the carpels and stamens, specialized mega- or microspore mother cells undergo meiosis to form the mega- or microspores, which divide mitotically to produce the haploid female or male gametophytes. These, in turn, form the haploid eggs or sperm. More primitive vascular plants (e.g., ferns) have simpler reproductive structures that lack all accessory floral organs. Ferns produce naked sporangia on the abaxial sides of leaves (Fig. 1); each sporangium contains spore mother cells that undergo meiosis to form the haploid reproductive spores. Ferns are usually homosporous, i.e., they produce only one kind of spore mother cell and spore. Unlike flowering plants, the haploid spores of ferns are shed, and the gametophytes derived from them are entirely independent of the spore-producing plant (the sporophyte). The fossil record supports the hypothesis that the common ancestor of flowering plants and ferns had no floral organs but, like ferns, had naked sporangia and an independent gametophyte generation (1, 2). The two groups are thought to have diverged from one another about 400 million years ago (1, 2).
Figure 1.
The Ceratopteris richardii sporophyte. (A) A whole plant with reproductive (arrow) and vegetative leaves. The vegetative leaves are less dissected than reproductive leaves. All postembryonic roots are adventitious roots and originate at the base of each leaf. (Bar = 1 cm.) (B) Naked sporangia on the abaxial surface of a reproductive leaf. Part of the leaf margin was removed to show the sporangia. Most sporangia mature at the same time, but a few sporangia develop later than others (arrow). (Bar = 0.5 mm.)
Studies of mutations that affect floral organ identity in Arabidopsis thaliana, Antirrhinum majus, and some other flowering plants have shown that the identity of each floral organ is specified by the combinatorial action of three classes of homeotic selector genes (3, 4). Most of the homeotic genes are collectively referred to as MADS genes because they contain a functional motif termed the MADS box (5, 6). The MADS genes encode transcription factors, and the MADS box is a highly conserved, ca. 60-aa sequence that functions in DNA-binding, dimerization, and accessory-factor interactions (6). Plant MADS genes have an additional conserved domain of ca. 70 aa residues named the K box, which potentially forms amphipathic helices that may be involved in protein–protein interactions (7). MADS genes have been reported from the animal, fungi, and plant kingdoms (6, 8–10). Recently, several MADS genes containing the K box were isolated from some ferns (11). A MADS gene tree, incorporating the seed plant and fern MADS genes, revealed that the known fern MADS genes form only three divergent gene groups, which is considerably less than the number of MADS gene groups in seed plants (11).
To address the function of the MADS genes in a plant with primitive reproductive structures lacking specialized floral organs, MADS genes were newly sought from the fern Ceratopteris richardii (Fig. 1). A study of this fern is important because of its tractable genetics, its relatively rapid life cycle, and the large body of information known about its development (12, 13). Five genes, representing all three fern MADS gene groups, were cloned from Ceratopteris, and their patterns of expression during sporophyte and gametophyte development were examined. Because four of the five genes were found to be similarly expressed in both reproductive and vegetative organs, we speculate that the ancestral MADS gene(s) was globally expressed in developing organs of the plant and that, as specialized floral organs evolved, the number of MADS genes increased while expression patterns of some of the genes became more restricted. The evolution of genes that regulate MADS gene expression thus had an important role in the evolution of floral organs.
MATERIALS AND METHODS
RNA was isolated from pulverized tissue in a buffer containing 4 M guanidine thiocyanate, 1 M ammonium thiocyanate, 1% lauryl sarcosine, 0.5% PVP 360,000, and 1% 2-mercaptoethanol. After three chloroform/isoamyl alcohol (24:1) extractions, nucleic acids were ethanol precipitated. RNA was purified further by CTAB precipitation (14).
For reverse transcription–PCR, total RNA was extracted from the vegetative leaves (1 to 2 cm long), the partially coiled reproductive leaves (≈10 cm long) without stipules, and the reproductive shoot tips including apical meristems, leaf primordia, young leaves less than 5-mm long, and root primordia less than 1 mm. Complementary DNAs from each RNA sample were synthesized by using the Superscript II reverse transcriptase (GIBCO/BRL) and the adapter primer [5′-CUACUACUACUAGGCCACGCGTCGACTAGTACT16-3′) supplied by GIBCO/BRL. PCR was performed by using the cDNA as template, the adapter primer, and the MADS domain-specific primer encoding the amino acids Lys-Lys-Ala-Tyr-Glu-Leu-Ser-Val. The degenerate primer sequence was 5′-CAUCAUCAUCAUAARAARGCITAYGARCTITCNTCNGT-3′ (where R = A or G; I = inosine; Y = C or T; N = A, C, G, or T). The PCR mix contained 1/10th volume of the cDNA solution, 2 μM MADS domain-specific primer, 1 μM adapter primer, 0.2 μM deoxyribonucleotides, 10 mM Tris⋅HCl (pH 9.0), 50 mM KCl, 0.1% Triton X-100, and 1.5 mM MgCl2. The mixture was heated to 80°C before adding 2.5 units Taq DNA polymerase (Promega). PCR was performed as follows: 5 min at 94°C and 35–40 cycles of 1 min at 94°C, 1 min at 52°C, and 2 min at 72°C. The PCR products were separated on 1% agarose gels. Fragments between 0.6 kb and 1.5 kb were purified and cloned into the pAMP1 vector (GIBCO/BRL); 158 clones (40, 78, and 40 clones for each cDNA sample from vegetative leaves, reproductive stem tips, and roots, respectively) were characterized. All clones were digested with Sau3A1, sorted, and sequenced.
Northern hybridizations were performed as described in Church and Gilbert (15). Membranes were hybridized at 68°C for 16 hr in a hybridization buffer (0.5 M phosphate, pH 7.2/1 mM EDTA/7% SDS) and then washed at 68°C in a wash buffer (40 mM phosphate, pH 7.2/1 mM EDTA/1% SDS).
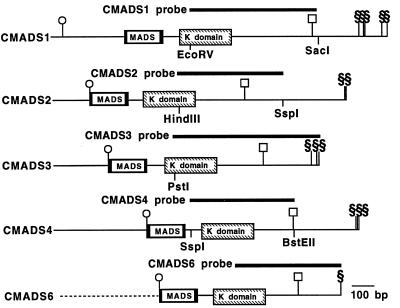
The CMADS1-specific probe was a 575-bp EcoRV-SacI fragment of the cloned cDNA, the CMADS2-specific probe was a 486-bp HindIII-SspI fragment of the cloned cDNA, and the CMADS4-specific probe was a 465-bp SspI-BstEII fragment of the cloned cDNA. The CMADS3-specific probe (676 bp) extended from the CMADS3 cDNA PstI site to the 3′ end of the gene. The CMADS6-specific probe (470 bp) was cloned by PCR with the CMADS6-specific internal primer (5′-CGATCTGAAGCTTCTGTCTGCAG-3′) and poly(T) primer. The probes did not include the conserved MADS domain-encoding region (Fig. 2). Each probe hybridized to unique genomic fragments (data not shown) and did not hybridize to the others in Southern hybridization experiments, indicating that the probes are gene-specific. For Northern and Southern hybridization experiments, DNA fragments were labeled with 32P by PCR labeling (16). In situ hybridizations with digoxigenin-labeled probes were performed as described previously (17). Using the sense probes as negative controls, weak signals were detected in the protoxylem of the petiole vascular bundle, but no other sense signals could be detected (data not shown). All sections were 8 μm thick.
Figure 2.
The structure of CMADS1, 2, 3, 4, and 6 cDNAs. The symbols ○, □, and § indicate the positions of the translation initiation and termination codons and poly(A)+ tails, respectively. Plain boxes indicate the MADS box, and the hatched boxes indicate the K box. The position of the initiation codon of CMADS6 is based on the CRM3 gene (11), which has the same amino acid sequences as the CMADS6. The dotted line of the CMADS6 represents unknown upstream sequences. The probes used for RNA expression analyses are indicated.
The amino acid sequences of plant MADS genes, obtained from the GenBank DNA database, were aligned by using the clustal w program (18) and then were revised manually. (The alignment is available from M.H. on request.) The 113 aa residues corresponding to positions 25–61, 116–131, 142–146, 149–176, 184–193, and 197–213 from the initial methionine codon of CMADS2 were used to calculate the evolutionary distances with the protdis program (19) under the Dayhoff and PAM matrix. The regions used for phylogenetic analyses included the MADS and K domains. The residues between the two domains and the residues beyond the K domain were not included in the analysis because these regions could not be aligned well. The tree was obtained with the neighbor-joining method (20) by using the neighbor program (19).
RESULTS
Cloning of MADS Genes from Ceratopteris richardii.
Candidate MADS-like Ceratopteris cDNA clones obtained by PCR using a MADS box-specific degenerate primer and an adapter primer were sorted into five distinct groups depending on their digestion patterns with Sau3AI. Each group was represented by 104, 1, 7, 39, and 7 clones, respectively, and 17, 1, 5, 7, and 4 clones of each group were sequenced, respectively. The sequences confirmed that each group represents a single distinct gene. The genes are named CMADS1, 2, 3, 4, and 5. The 5′ regions of the CMADS genes were cloned by using the 5′ RACE kit (GIBCO/BRL) and then sequenced. Further screening for CMADS genes from total RNA isolated from 14-day-old gametophytes produced one more clone, CMADS6. Because CMADS3 and CMADS6 are identical in amino acid sequence to the previously reported CRM1 and CRM3 genes (11), 5′ RACE for CMADS6 was not performed. CMADS5 was omitted from further studies because some of the PCR products contained in-frame stop codons, indicating that CMADS5 may be an atypically truncated MADS gene or a pseudogene. Percentages of identical DNA sequences between the newly cloned CMADS genes (CMADS1, 2, 4, and 5) and previously reported Ceratopteris richardii genes (CRM1, 3, and 7) are around 50%.
CMADS1, 2, 3, 4, and 6 all potentially encode proteins that contain the MADS domain as well as the K domain, another conserved domain common to all plant MADS genes (6, 8–10) (Fig. 2). The initiation codons of the angiosperm MADS genes are located adjacent to the 5′ end of the sequences encoding the MADS domain with the exception of most of the members of the AGAMOUS (AG) group (9, 10). The latter encode proteins with additional amino-terminal amino acids. CMADS1 contains the additional 5′ sequence found in the members of the AG group, whereas CMADS2, 3, 4, and 6 do not (Fig. 2).
Gene Tree of Plant MADS Genes.
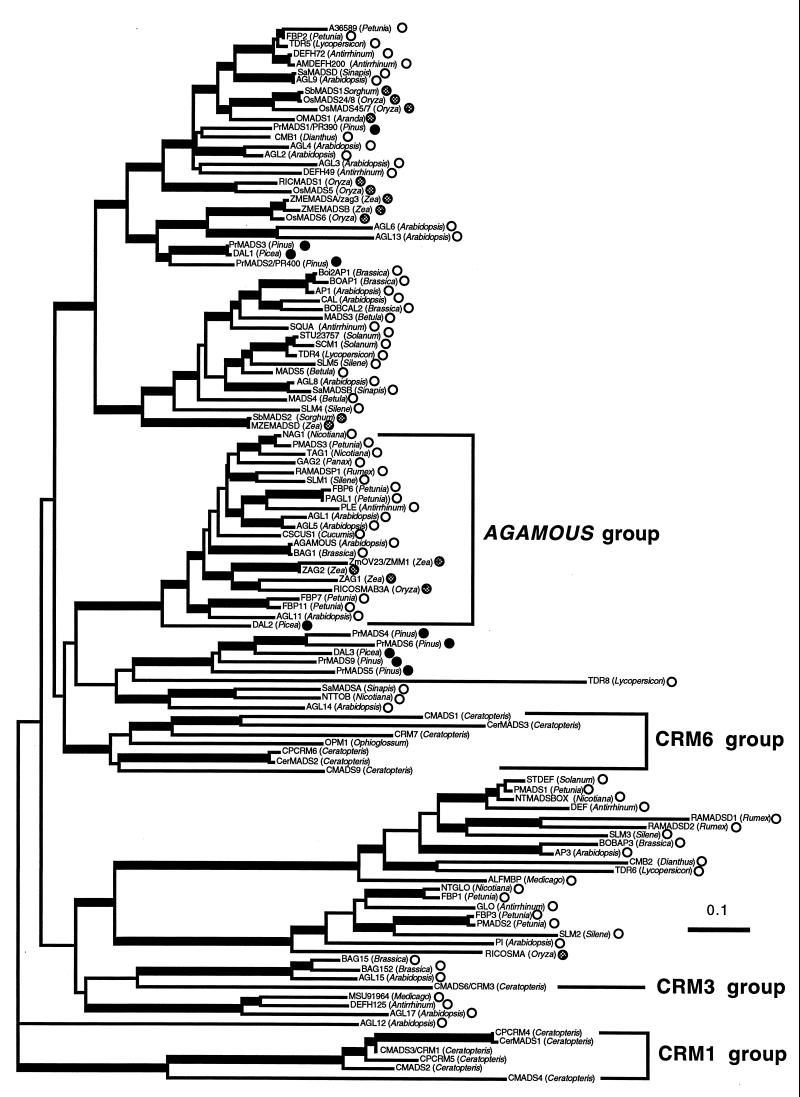
A gene tree based on the comparison of the amino acid sequences of plant MADS genes shows that the CMADS genes form three divergent groups as described previously (11). CMADS1, CMADS2/3/4, and CMADS6 are included in the CRM6, CRM1, and CRM3 groups previously isolated from Ceratopteris (11), respectively. The three groups do not cluster with any other seed plant MADS gene group with high statistical confidence (Fig. 3). Because both CMADS1 and the AG group of MADS domain-encoded proteins have the additional amino-terminal amino acids, it is likely that the CRM6 group, which includes CMADS1, is more closely related to the AG group than to other seed plant MADS genes. Kofuji and Yamaguchi (21) reported the presence of two other genes in the CRM6 group (CerMADS2 and 3 in Fig. 3), which also have the additional amino-terminal amino acids. The amino-terminal regions of other genes in the CRM6 group have not been reported.
Figure 3.
A gene tree of plant MADS genes based on the neighbor-joining method (20). The horizontal branch length is proportional to the estimated number of amino acids substitutions per residue. (Bar = 0.1 aa substitution per residue.) Internal branches with more than 50% bootstrap values in 100 bootstrap replicates performed by using the seqboot program (19) are indicated as broader lines. This is an unrooted tree. The symbols after the gene names indicate the dicots (open circles), monocots (hatched circles), or gymnosperms (solid circles). Three Ceratopteris MADS gene groups and the monophyletic AGAMOUS group (8–10) are indicated by brackets.
Expression of CMADS mRNAs.
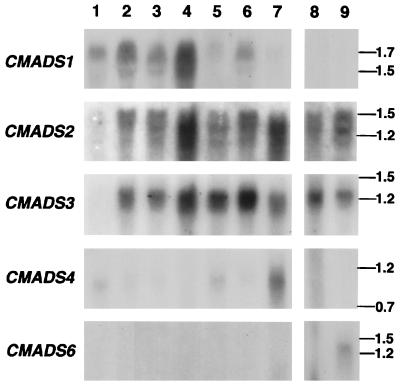
The results of the Northern hybridizations using CMADS1, 2, 3, 4, and 6 specific probes are shown in Fig. 4. The CMADS1, 2, and 3 genes have similar patterns of expression in almost all sporophytic tissues, but the amount of expression in each tissue is different in each gene. CMADS2 and 3 are expressed predominantly in gametophytes. CMADS4 expression is high in the root, but weak signals are detectable in all other sporophytic tissues examined. CMADS6 expression is detectable only in hermaphroditic gametophytes.
Figure 4.
Northern blot analysis using CMADS1, 2, 3, 4, and 6 specific probes. Each lane contained 10 μg of total RNA from: the reproductive shoot meristem, including shoot, root, and leaf primordia (lane 1), coiled young reproductive leaves 1-cm long, without petioles (lane 2); expanding reproductive leaves lacking the petiole (lane 3); mature reproductive leaves with spores (lane 4); expanded vegetative leaves without petioles (lane 5); petioles of reproductive leaves (lane 6); entire roots (lane 7); male gametophytes (lane 8); and mutant hermaphroditic1 (4) hermaphroditic gametophytes (lane 9).
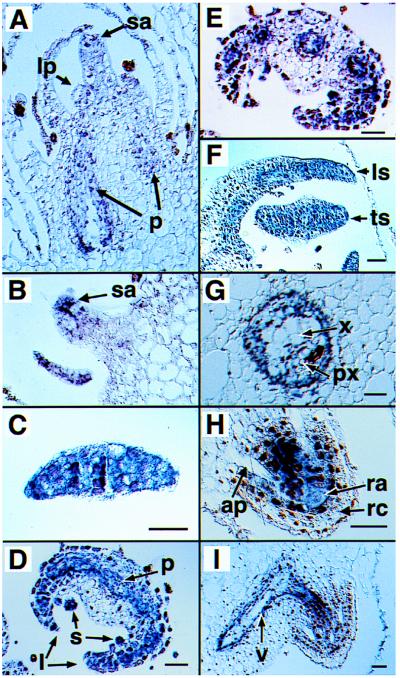
The detailed spatial patterns of expression of the CMADS genes during sporophyte development was assessed by RNA in situ hybridization for CMADS1–5. In general, the patterns of CMADS1, 2, and 3 expression are very similar, although CMADS2 and 3 signals are always weaker than CMADS1 signals (data not shown). The CMADS4 expression pattern in the root is not distinguishable from CMADS1, 2, and 3, although CMADS1 signal is weaker than other CMADS signals (data not shown). For these reasons, the results of in situ hybridizations using the CMADS1 antisense probe (Fig. 2) are shown in Fig. 5. In developing shoot systems, expression is seen in the shoot apical meristem, leaf primordia, and procambium (Fig. 5A). The expression in the apical meristem and leaf primordia tissues appears weaker than in the procambium. The same patterns of expression are observed in the apical meristems of the many adventitious shoots that develop on the adaxial surface of leaves as they mature (Fig. 5B). As the leaf increases in cell number, the CMADS signal becomes stronger and distributed uniformly in all cells at the tip of each leaf (Fig. 5 C and F). The meristematic tip forms the coiled main axis of the leaf, or crosier (22). As tissue systems differentiate in the leaf, the CMADS signal gradually becomes restricted to three parts of the leaf: the procambium, the sporangium initials, and the regions of the leaf that will give rise to the lamina, or pinnae (Fig. 5 C–E). The signal observed in the developing procambium of the leaf continues into the differentiated vascular bundles of the petiole (Fig. 5G). Ceratopteris forms adventitious roots at the base of each leaf, and hybridization signals are detected in the root apical meristems and their associated provascular cell files (Fig. 5H). The hybridization signals of the root provascular cell files are continuous with the vascular bundles in the petiole of the leaf (Fig. 5I).
Figure 5.
CMADS1 RNA localization in sporophyte tissues as detected by in situ hybridization. (A) A longitudinal section through the terminal meristematic region of a stem showing the shoot apical meristem (sa), the leaf primordia (lp), and the procambium (p). (B) A longitudinal section of an adventitious shoot on the adaxial surface of a leaf showing the apical meristem (sa). (C–E) A series of transverse sections of a reproductive leaf at increasing distances from the tip shown in C showing leaf margins (l), the sporangium initial cells (s) that form on the abaxial surface of the leaf, and the procambium (p). (F) A transverse (ts) and a longitudinal section (ls) of two young vegetative leaves ≈1 cm in length. (G) Transverse section through the basal portion of the petiole of a young leaf 1 cm in length. x, xylem; px, protoxylem. (H) Longitudinal section of the growing tip of an adventitious root. ap, air passage; ra, root apical cell; rc, root cap. (I) Longitudinal section of the petiole and an adventitious root. v, vascular bundle of the petiole, which is continuous with the vascular bundle of the adventitious root. (Bar = 50 μm.)
The reproductive phase of development (sporangium formation) in Ceratopteris begins on the abaxial surface of the leaf with an oblique division of an epidermal cell (the sporangial initial) forming an inner and an outer cell (Fig. 6A) (23). After the first division of the initial cell, a strong CMADS hybridization signal is observed in the outer cell and a weak signal is observed in the inner one. Derivatives of the inner cell ultimately contribute to the sporangium stalk and the basal region of the sporangial jacket. Derivatives of the outer cell ultimately contribute to the distal part of the sporangial jacket, the tapetum, and the sporogenous cells. A strong CMADS hybridization signal is detected in the apical cell derived from the outer cell (Fig. 6 B and C). A periclinal division of this apical cell produces an internal cell whose derivatives form the tapetum and the sporogenous cells. After this periclinal division, the CMADS hybridization signal becomes restricted to the internal cell (Fig. 6D) and its derivatives, the tapetum and sporogenous cells (Fig. 6E). CMADS expression is not observed in the sporangia containing mature spores (Fig. 6F); however, each mature spore has a hard spore coat that makes it difficult to section and assess CMADS gene expression. In fully expanded, fertile leaf segments, hybridization signals are not observed in laminar or vascular tissues, but are observed in the late-developing sporangia (Fig. 6G). The Northern analysis indicates that mature, senescing leaves with spore-filled sporangia express relatively high levels of CMADS1, 2, and 3 (Fig. 4). The in situ hybridization studies show that this signal results from CMADS expression in the late-developing sporangia, in the numerous (>30) adventitious plantlets that develop along the adaxial surface of each leaf (Fig. 5B), and in the vascular bundles in the rachis (data not shown).
Figure 6.
CMADS1 RNA localization in developing sporangia. Transverse section of a young (1 cm; A–D) and older (15 cm; E–G) fertile leaf showing sporangium development. (A) A sporangium initial cell divided to form an inner cell (i) and an outer cell (o). The arrow head of “i” points to a nucleus of the inner cell. (B–D) The apical cell (ac) of the sporangium (B and C) divides to form an internal cell (ic) (D). (E) Derivatives of the internal cell will form the sporogenous cells (sc) and tapetum cells (tc). (F) A portion of the mature sporangium including some spores (s). (G) A late developing sporangium (arrowhead). [Bar = 10 μm (A–F) or 50 μm (G).]
DISCUSSION
The CMADS genes obtained in this study are divergent and fall into three MADS gene groups (Fig. 3). The expression patterns of four of the genes (CMADS1, 2, 3, and 4) are very similar in vegetative and reproductive sporophyte tissues, although CMADS4 gene expression is much higher in the root than in other sporophytic tissues. This overlap in expression pattern, particularly among the CMADS1, 2, and 3 genes, indicates that the CMADS genes may have redundant functions, even though they fall in two different classes. Although the functions of the CMADS genes are unknown, their expression patterns in the regions of the sporophyte that are meristematic or primordial indicates that these probable transcription factors (by virtue of their sequence similarity) may be involved in regulating cell divisions in the initiation and early development of all organs and in unknown functions in differentiated vascular bundles. The ancestral functions of MADS genes can be investigated further by studying MADS genes in plant groups such as lycopods and bryophytes, which arose before ferns and flowering plants. Moreover, it is necessary to screen more CMADS genes in Ceratopteris and other ferns to confirm our hypothesis.
The number of MADS gene subfamilies or groups in angiosperms (>10) is much greater than the three that have been identified so far in ferns (8–10). This observation is consistent with the hypothesis that duplication of the MADS genes and their subsequent divergence is related to the co-option of MADS genes as a homeotic selector genes and to the increase in the complexity of reproductive organs presently observed in angiosperms. The analyses of MADS gene homologues in other plant groups (e.g., gymnosperms), which branched off from the vascular plant lineage after ferns, will be useful in understanding the relationship between MADS gene evolution and the evolution of reproductive organs.
In flowering plants, some MADS genes are expressed in specific floral organ primordia as homeotic selector genes, whereas other MADS genes are expressed in both reproductive and vegetative organs (8–10). As with the latter type of flowering plant MADS genes, most of the fern CMADS genes are expressed in both the reproductive and vegetative organs. The generally expressed MADS genes may be more primitive than the reproductive organ-specific MADS genes. If so, it is likely that some of the MADS genes were co-opted as homeotic selector genes of specialized reproductive organs and their expression was restricted to specific floral organ primordia, events that occurred after the divergence of ferns and angiosperms. The restriction of MADS gene expression may have been caused by the evolution of other genes that regulate the MADS genes. The Arabidopsis LEAFY (24) and/or CURLY LEAF (25) genes, for example, have been shown to regulate or restrict MADS gene expression in Arabidopsis. By comparing the functions of these types of regulatory genes in Arabidopsis and their homologues in Ceratopteris, important insights into the evolution of the regulatory cascade of MADS genes and subsequent floral organ evolution will be gained.
Acknowledgments
We thank H. Sakai and E. Meyerowitz for help with the in situ hybridizations; R. Sano for providing total RNA; C. Juarez, C. Chapple, G. Rothwell, T. Nishiyama, and anonymous reviewers for suggestions on the manuscript; R. Kofuji and K. Yamaguchi for a preprint of their manuscript; and K. Iwatsuki, T. Nagata, and H. Fukuda for experimental facilities. This research was supported by grants from The Japan Society for the Promotion of Science (M.H.); Nissan Science Foundation (M.H.); Ministry of Education, Science and Culture, Japan (M.H., M.K.); and the National Science Foundation (J.A.B.). This is journal paper 15515 of the Purdue University Agricultural Experimental Station.
ABBREVIATION
- AG
AGAMOUS
Footnotes
References
- 1.Gifford E M, Foster A S. Morphology and Evolution of Vascular Plants. 3rd Ed. New York: Freeman; 1988. [Google Scholar]
- 2.Stewart W N, Rothwell G W. Paleobotany and the Evolution of Plants. 2nd Ed. Cambridge, U.K.: Cambridge Univ. Press; 1993. [Google Scholar]
- 3.Coen E S, Meyerowitz E M. Nature (London) 1991;353:31–37. doi: 10.1038/353031a0. [DOI] [PubMed] [Google Scholar]
- 4.Meyerowitz E M, Smyth D R, Bowman J L. Development. 1989;106:209–217. [Google Scholar]
- 5.Schwarz-Sommer Z, Huijser P, Naken W, Saedler H, Sommer H. Science. 1990;250:931–936. doi: 10.1126/science.250.4983.931. [DOI] [PubMed] [Google Scholar]
- 6.Shore P S, Sharrocks A D. Eur J Biochem. 1995;229:1–13. doi: 10.1111/j.1432-1033.1995.tb20430.x. [DOI] [PubMed] [Google Scholar]
- 7.Davies B, Schwartz-Sommer Z. In: Results and Problems in Cell Differentiation. Nover L, editor. Vol. 20. Berlin: Springer; 1994. pp. 235–258. [DOI] [PubMed] [Google Scholar]
- 8.Theissen G, Saedler H. Curr Opin Genet Dev. 1995;5:628–639. doi: 10.1016/0959-437x(95)80032-8. [DOI] [PubMed] [Google Scholar]
- 9.Theissen G, Kim J T, Saedler H. J Mol Evol. 1996;43:484–516. doi: 10.1007/BF02337521. [DOI] [PubMed] [Google Scholar]
- 10.Hasebe M, Banks J A. In: Evolution and Diversification of Land Plants. Iwatsuki K, Raven P H, editors. Tokyo: Springer; 1997. pp. 179–197. [Google Scholar]
- 11.Munster T, Pahnke J, Rosa A D, Kim J T, Martin W, Saedler H, Theissen G. Proc Natl Acad Sci USA. 1997;94:2415–2420. doi: 10.1073/pnas.94.6.2415. [DOI] [PMC free article] [PubMed] [Google Scholar]
- 12.Hickok L G, Warne T, Fribourg R S. Int J Plant Sci. 1995;156:332–345. [Google Scholar]
- 13.Eberle J, Nemacheck J, Wen C-K, Hasebe M, Banks J A. Int J Plant Sci. 1995;156:359–366. [Google Scholar]
- 14.Murray M G, Thompson W F. Nucleic Acids Res. 1980;8:4321–4328. doi: 10.1093/nar/8.19.4321. [DOI] [PMC free article] [PubMed] [Google Scholar]
- 15.Church G M, Gilbert W. Proc Natl Acad Sci USA. 1984;81:1991–1995. doi: 10.1073/pnas.81.7.1991. [DOI] [PMC free article] [PubMed] [Google Scholar]
- 16.Schowalter B D, Sommer S S. Anal Biochem. 1989;177:90–94. doi: 10.1016/0003-2697(89)90019-5. [DOI] [PubMed] [Google Scholar]
- 17.Coen E S, Romero J M, Doyle S, Elliot R, Murphy G, Carpenter R. Cell. 1990;63:1311–1322. doi: 10.1016/0092-8674(90)90426-f. [DOI] [PubMed] [Google Scholar]
- 18.Thompson J D, Higgins D G, Gibson T J. Nucleic Acids Res. 1994;22:4673–4680. doi: 10.1093/nar/22.22.4673. [DOI] [PMC free article] [PubMed] [Google Scholar]
- 19.Felsenstein J. phylip, Phylogenetic Inference Package. Seattle: Univ. of Washington; 1993. , Version 3.572c. [Google Scholar]
- 20.Saitou N, Nei M. Mol Biol Evol. 1987;4:406–425. doi: 10.1093/oxfordjournals.molbev.a040454. [DOI] [PubMed] [Google Scholar]
- 21.Kofuji R, Yamaguchi K. J Phytogeography Taxon. 1997;45:83–91. [Google Scholar]
- 22.Steeves T A, Sussex I M. Patterns in Plant Development. New York: Cambridge Univ. Press; 1989. [Google Scholar]
- 23.Pal N, Pal S. Bot Gaz. 1963;125:405–412. [Google Scholar]
- 24.Weigel D, Meyerowitz E M. Science. 1993;261:1723–1726. doi: 10.1126/science.261.5129.1723. [DOI] [PubMed] [Google Scholar]
- 25.Goodrich J, Puangsomlee P, Martin M, Long D, Meyerowitz E M, Coupland G. Nature (London) 1997;386:44–51. doi: 10.1038/386044a0. [DOI] [PubMed] [Google Scholar]


