

Abstract
Breast Cancer Metastasis Suppressor 1 (BRMS1) suppresses metastasis of human breast cancer, ovarian cancer and melanoma in athymic mice. Studies have also shown that BRMS1 is significantly downregulated in some breast tumors, especially in metastatic disease. However, the mechanisms which regulate BRMS1 expression are currently unknown. Upon examination of the BRMS1 promoter region by methylation specific PCR (MSP) analysis, we discovered a CpG island (−3477 to −2214), which was found to be hypermethylated across breast cancer cell lines. A panel of 20 patient samples analyzed showed that 45% of the primary tumors and 60% of the matched lymph node metastases, displayed hypermethylation of BRMS1 promoter. Furthermore, we found a direct correlation between the methylation status of the BRMS1 promoter in the DNA isolated from tissues, with the loss of BRMS1 expression assessed by immunohistochemistry. There are several studies investigating the mechanism by which BRMS1 suppresses metastasis; however thus far there is no study that reports the cause(s) of loss of BRMS1 expression in aggressive breast cancer. Here we report for the first time that BRMS1 is a novel target of epigenetic silencing; and aberrant methylation in the BRMS1 promoter may serve as a cause of loss of its expression.
Keywords: BRMS1, Methylation, Epigenetic silencing, CpG island
Introduction
Breast cancer is a highly metastatic disease and the second leading cause of cancer deaths in women. Cancer diagnosed prior to metastasis has a more favorable prognosis and is often curable. However, when tumor cells disseminate and colonize distant sites, cure rates are significantly diminished. Hence understanding the regulation of genes that control metastasis is of utmost importance. Research in the last two decades has unraveled a group of genes specifically targeted at metastasis suppression such that they are distinct in effecting only the formation of distant metastases not primary tumors [1].
Breast Cancer Metastasis Suppressor 1 (BRMS1) was originally identified to suppress metastasis of highly metastatic human breast cancer cell lines when injected into nude mice [2–4]. Reduced expression of the BRMS1 mRNA is correlated with poor prognosis in breast cancer [5, 6]. Breast cancer brain metastases have also been shown to have reduced BRMS1 expression [6]. Loss of BRMS1 protein expression has been reported to predict reduced disease-free survival [7]. A series of interesting findings have been reported regarding possible mechanisms by which BRMS1 may regulate metastasis. BRMS1 has been shown to play a role in cell-cell communication [2, 8, 9] and reduce phosphoinositide signaling [10]. BRMS1 has also been reported to suppress NFκ-B signaling through blockage of IκBα [11–13]. Further, BRMS1 gene regulatory mechanisms have been shown to involve histone deacetylases [14, 15]. Proteomic as well as genomic analysis strategies have been used to reveal downstream targets of BRMS1 [16–18].
An interesting and important aspect of BRMS1 biology still remains unexplored: what causes the loss of BRMS1 expression? While genomic deletion was not found to be a major cause for loss of BRMS1 expression [7], we hypothesized that epigenetic regulation, specifically methylation, could be responsible.
Materials and methods
Cell culture
MDA-MB-231 and MDA-MB-435 cells were grown in DMEM/F-12 (Invitrogen, Carlsbad, CA) supplemented with 5% heat inactivated FBS (Atlanta Biologicals, Atlanta, GA), 200 µM sodium pyruvate (Invitrogen), and 20 µM non-essential amino acids (Invitrogen). MCF10A, MCF10AT and MCF10CA 1a cl.1 and MCF10CA cl.d cell lines [19, 20] were grown in DMEM/F-12 supplemented with 5% heat inactivated horse serum (Invitrogen), 100 ng/ml cholera toxin (Calbiochem, San Diego CA), 10 µg/ml insulin (Sigma, St. Louis, MO), 25 ng/ml murine epidermal growth factor (Sigma), and 500 ng/ml hydrocortisone (Sigma). All cells were maintained in a humidified 5% CO2 environment at 37°C. The tissue origin of the MDA-MB-435 cells has been under debate for a few years [21–24], it expresses milk lipids [25], does not metastasize from subcutaneous sites [26] and in fact, still remains one of the few available models of orthotopic metastasis of breast cancer in animal models.
To confirm if methylation can be attributed to loss of BRMS1 in vivo, cells were treated with the demethylating agent 5-aza-2′-deoxycytidine (Sigma). Cells were grown to 70% confluence (~3.0 × 10⁶ cells/plate), and the growth medium was replaced with medium containing 5-aza-2′-deoxycytidine at 0.5 and 1 µM concentrations. The medium containing 5-aza-2′-deoxycytidine was changed daily over the course of 4 days. On day 5 cells were harvested for DNA, RNA and protein collection as detailed.
Tumor samples and laser capture microdissection
Tissues of matched patient samples were mounted on MMI Membrane slides (Molecular Machines & Industries GmbH, Eching, Germany). Samples were obtained from UAB Comprehensive Cancer Center and USA-Mitchell Cancer Institute BioBank with appropriate IRB approvals. Anonimized matched samples were obtained from patients that included normal ductal epithelium, primary breast carcinoma, and lymph node metastasis. Area of the tissue sections corresponding to “Normal’, ‘Tumor’, and ‘Lymph node metastasis’ were identified independently by two pathologists (ARF and JAK). All samples were H&E stained prior to dissection with the MMI CellCut Laser Capture Microdissection system (Molecular Machines Inc.). Upon microdissection, samples were lysed in 200 µl of extraction buffer containing TE (10 mM/10 mM) to which 1% Tween and 200 µg/ml Proteinase K was added. After overnight incubation at 50°C the samples were dialyzed against TE (10 mM/2 mM) for 24 h.
Western blotting analysis
Protein lysates were collected in NP-40 buffer (150 mM NaCl, 50 mM Tris, 1% NP-40) and spun at 13,300 rpm at 4°C. 40 µg of total protein was loaded onto a 10% SDS-PAGE gel and transferred to PVDF membrane. All membranes were blocked overnight at 4°C and immunoblotting was done with mouse anti-BRMS1 antibody (at 1:2,500) [27] or with mouse anti-β-actin antibody (1:30,000). Anti-mouse HRP conjugated secondary antibody was used for detection and blots were developed with SuperSignal enhanced chemiluminescence substrate (Pierce, Rockford, IL) and exposed using a Fuji LAS3000 imager. Densitometry was performed with the AlphaEase®FC image analysis software. The graph in Fig. 2b represents integrated density values (IDVs) normalized to untreated MDA-MB-231 signal intensity to obtain fold change.
Fig. 2.

CpG island identified upstream of BRMS1 is responsible for silencing in MDA-MB-231 cells. (a) Schematic of BRMS1 in which CpG islands were identified using CpG island searcher. The transcription initiation site (TIS) is marked at +1 with one island lying within the first exon of BRMS1 (−531 to +608) while the other is 1683 bp upstream (−3477 to −2214). E1 and E2 are exon 1 and 2 respectively and ATG is translation start site for BRMS1. (b) MDAMB-231 cells were treated with 5-aza-2′-deoxycytidine (5-aza-dC) at two concentrations of 0.5 and 1.0 µM and assayed for BRMS1 expression by western blotting. Beta-actin was used as loading control. The densitometric change in the expression of BRMS1 is depicted as the IDV normalized to untreated MDA-MB-231 cells
Genomic DNA isolation and RNA isolation
Cells were grown to 80% confluence and harvested for isolation of genomic DNA. Briefly, cells were collected in 5 ml ice cold PBS and spun at 1,000 rpm at 4°C for 5 min. The cell pellet was washed and re-suspended in 5 ml of TE (10 mM/10 mM) to which 1% Tween and 200 µg/ml Proteinase K was added. After overnight incubation at 50°C the samples were dialyzed against TE (10 mM/2 mM) for 24 h. Samples were visualized on a 0.8% agarose gel to verify the quality of the genomic DNA.
For RNA isolation, cells at 80% confluence were harvested in Trizol (Invitrogen), and extraction of RNA from Trizol was completed as per manufacturer’s protocol. RNA was dissolved in DEPC dH2O. 18S and 28S ribosomal RNA were visualized on a 1% agarose gel to assess quality of RNA.
CpG island prediction
CpG islands were identified with the use of CpG Island Searcher [28], set at the following parameters: %GC 60, ObsCpG/ExpCpG .70, length 200 bp, distance 100 bp.
Sodium bisulfite modification
The CpGenome Modification kit (Chemicon, Temecula, CA) was used for modification of all genomic DNA originating from cell lines. Modification was carried out as per the manufacturer’s protocol. Briefly, 1 µg genomic DNA was treated with sodium bisulfite at 50°C overnight. Subsequently, the DNA was desulfonated and washed several times followed by elution using TE.
Bisulfite modification of DNA directly isolated from tissue was performed with the EZ DNA methylation kit (Zymo, Orange, CA) as per the manufacturer’s protocol. For all reactions 1 µg of DNA was used for modification and eluted into a final volume of 10 µl TE.
Methylation specific PCR (MSP)
All MSP reactions were carried out using 200 ng of modified genomic DNA. PCR was performed using Platinum Taq DNA Polymerase (Invitrogen) along with either the specific methylated (M) or unmethylated (U) primers. Primers were generated using MethPrimer [29] with the parameters set for optimal results as follows: product size 200 bp, Tm 55°C and primer length 25 bp. For methylated BRMS1 specific PCR, the primers utilized were: forward—5′ TAG ATG TTT TAC GTT ATT CGG TGC 3′ (−2461 to −2436) and reverse—5′ ATT AAT CTT ACT CCT CCT ACC CGT A (−2356 to −2337). For unmethylated BRMS1 specific PCR the primers utilized were: forward—5′ AGA TGT TTT ATG TTA TTT GGT GTG T 3′ (−2460 to −2436) and reverse—5′ ATT AAT CTT ACT CCT CCT ACC CAT A 3′ (−2356 to −2337). (Note: Transcription start site of BRMS1 is +1). Both amplify a 130 bp product. Modified DNA was subjected to the following PCR amplification protocol: 1 cycle of 94°C for 5 min, 40 cycles of 94°C for 30 s, annealing at 50°C (U specific) or 53.5°C (M specific) for 30 s, 45 s extension at 72°C, and final extension at 72°C for 7 min. Products were visualized on a 2% agarose gel. Controls for each MSP reaction included using both enzymatically methylated human placental DNA (Chemicon) and a BRMS1 BAC clone as an unmethylated control.
Bisulfite genomic sequencing
Bisulfite genomic sequencing (BGS) PCR was carried using a similar protocol as MSP. Primers were generated using MethPrimer under the same parameters as previously mentioned. The region targeted for sequencing encompassed the same region that was amplified by MSP. The following primer sequences were used for BGS: forward—5′ GTT TTT TAT TAG TTG TTG TTG GT 3′ (−2436 to −2414) and reverse—5′ AAT ATT AAT CTT ACT CCT CCT ACC C 3′ (−2352 bp to −2333 bp). Briefly, 200 ng of modified DNA was used as a template for BGS PCR using the following protocol: 1 cycle of 95°C for 5 min, 35 cycles of 95°C for 30 s, annealing at 50°C 30 s, 1 min extension at 72°C, and final extension at 72°C for 7 min which yielded a product of 109 bp. Products were visualized on a 2% agarose gel.
PCR products were cloned using the TOPO TA cloning system (Invitrogen) and sequenced with the T7 promoter and M13 reverse primers by Laragen Inc. (Los Angeles, CA) sequencing facility. Analysis of sequencing was done using both Chromas LITE (http://www.technelysium.com.au/chromas_lite.html) and MultAlin (http://bioinfo.genopole-toulouse.prd.fr/multalin/multalin.html) softwares.
Note: The MSP and BGS studies in tissues were conducted without knowledge of the expression status of BRMS1.
Quantitative RT-PCR
For analysis of mRNA levels in cell lines as well as to determine changes in expression upon treatment with 5-aza-2′-deoxycytidine, RNA was from various cell lines was subjected to real time quantitative RT-PCR. cDNA was generated using the High Capacity Reverse Transcription kit (Applied Biosystems, Foster City, CA). 1 µg of total RNA was used to synthesize cDNA as follows: 25°C for 10 min and 37°C for 2 h. PCR was done using 40 ng of cDNA with BRMS1 TaqMan primer probe sets in TaqMan Universal PCR Master Mix (Applied Biosystems). GAPDH was used as an endogenous control to normalize all reactions. The real time PCR was performed using a BioRad iQ5Real-Time Detection system (Bio-Rad, Hercules, CA) with the following thermocycling conditions of two initial steps of 50°C for 2 min, 95°C for 10 min followed by 40 cycles of 95°C for 15 s and 60°C for 1 min. BRMS1 transcript levels were normalized to GAPDH levels (ΔCT) which was used to calculate changes in BRMS1 expression (2−ΔΔCT). For analysis of gene expression across breast lines human adult breast RNA (Stratagene, La Jolla, CA) was set as calibrator and all other samples were compared accordingly.
Immunohistochemistry
A breast cancer tissue microarray was sectioned to 5 µm-thickness and stained using an anti-human BRMS1 rabbit polyclonal antibody (S0705, a kind gift from Applied Genomics, Inc., Huntsville, Alabama) at 1:1,000 dilution. Secondary detection was achieved via a streptavidin, horseradish peroxidase secondary detection system (Signet Laboratories, Multispecies USA) using diaminobenzidine (BioGenex) as the chromogen. The staining was primarily nuclear. The intensity of staining of tumor cells was assessed as 0 (no staining) to 4 (strongest possible intensity of staining). The immunoscore was derived as the product of the percentage of cells at each intensity and the corresponding intensity. The products were added to get an immunoscore for the section [30].
Results
BRMS1 expression is significantly reduced in aggressive breast cancer cell lines
BRMS1 expression has previously been shown to be lower in some breast cancers with worse prognosis [5–7]. We verified by qRT-PCR that BRMS1 is indeed downregulated in metastatic breast cancer cell lines. Expression of BRMS1 mRNA from various cultured breast lines ranging from immortalized epithelium (MCF10A) to highly metastatic lines (MCF10CA1a cl.1, MDA-MB-231, and MDAMB-435) was compared to BRMS1 transcripts from human adult normal breast. While MCF10A displayed comparable levels of BRMS1 when compared to normal breast, MCF10AT, MCF10CA1a cl.1, MDA-MB-231, and MDAMB-435, all displayed a decrease in BRMS1 mRNA levels when compared to normal breast (Fig. 1).
Fig. 1.

BRMS1 mRNA levels are decreased in tumorigenic and/or metastatic breast cancer cell lines. RNA was isolated from breast cancer cell lines, cDNA was generated and subjected to real-time PCR. The CT values of BRMS1 were normalized to GAPDH and fold change in BRMS1 was calculated by comparing cell lines to normal breast RNA (defined as 100%)
BRMS1 promoter shows presence of CpG islands
The examination of the sequence from −3600 to +3472 (transcription start site of BRMS1 is designated as +1) of the BRMS1 genomic sequence shows the presence of two potential CpG islands. As seen in the schematic (Fig. 2a) the BRMS1 gene shows a large intron before the second exon where the translation start (ATG) site is located. This putative regulatory region shows no significant CpG island as defined by the CpG Island Searcher [28]. Upstream from the transcription start site of BRMS1 is an intergenic region preceded by β3GNT1 [4]. Our in-silico searches revealed two strong CpG islands, one extending through the first exon of BRMS1 (−531 to +608), and another starting about 1683 bp upstream (−3477 to −2214) (Fig. 2a).
Treatment with demethylating agent restores BRMS1 expression in MDA-MB-231 cells
To test if the decreased expression of BRMS1 in aggressive cell lines was due to hypermethylation, we treated MDA-MB-231 cells with the demethylating agent 5-aza-2′-deoxycytidine (0.5 and 1.0 µM). BRMS1 protein levels markedly (7- to 10-fold) increased compared to untreated cells (Fig. 2b). This observed alleviation of BRMS1 suppression in the MDA-MB-231 cells led us to further examine each of the identified CpG islands for a role in BRMS1 suppression.
MSP analysis of the BRMS1 promoter reveals the existence of a CpG island
MSP analysis was performed using DNA from a panel of breast cancer cell lines: MCF10A cells that represent immortalized normal breast epithelium and five different breast cell lines ranging from tumorigenic (MCF10AT) to cancers with metastatic capability (MCF10CA1a cl.1,MDAMB-231, MDA-MB-435). MSP analysis examining ‘CpG island A’ did not identify methylation specific amplicons, indicating that this particular CpG island is not hypermethylated (Supplemental Figure 1). Hence, cells were analysed for presence of methylation at ‘CpG island B’, using primer pairs spanning −2460 to −2337 bp. MCF10A and MCF10AT displayed an intense band with primers specific to unmethylated DNA, however, there was no detectable signal in either cell generated by the methylated DNA specific primer set. On the other hand, all the metastatic lines MCF10CA1a cl.1,MDA-MB-231 and MDA-MB-435, show a very distinct methylated amplicon concluding that the upstream island is methylated (Fig. 3a). There is also an unmethylated product that appears in all four cell lines, most likely meaning that not all allelic copies are methylated. Treatment of MCF10CA1a cl.1, MDA-MB-231 and MDAMB-435 with 5-aza-2′-deoxycytidine reversed of this MSP pattern (Fig. 3b). Notably, the treatment reversed the presence of the M band in the metastatic cell lines indicating that the CG residues were de-methylated.
Fig. 3.

CpG island B is hypermethylated with increasing metastatic potential of breast cancer cell lines. (a) DNA was isolated and subjected to bisulfite modification and subsequent MSP analysis. A band at 109 bp was generated for both unmethylated (U) and methylated (M) reactions. Lack of the M bands in the lanes of MCF 10A and MCF10AT was a clear indication of no hypermethylation. Control represents the chemically methylated DNA.U = Unmethylated primers; M = Methylated primers. (b) Cells were treated with either 0.5 or 1.0 µM 5-aza-2′-deoxycytidine to demethylate the BRMS1 CpG island. The hypomethylated phenotype is characterized by the appearance of the ‘U’ amplicon in the MCF10CA, MDA-MB-231 and MDA-MB-435 cells concomitant with a decreased intensity of the ‘M’ amplicon. U = Unmethylated primers; M = Methylated primers. (c) Modified DNA was subjected to BGS which targeted −2460 to −2337 bp of the CpG island B. Four representative sequenced clones are shown here. Open circle represents unmethylated and closed circle depicts methylated CG residues
Bisulfite genomic sequencing (BGS) establishes the CpG methylation profile for Island B in breast cancer cell lines
BGS was used to identify methylation status of individual CG residues from CpG island B. Primers encompassed the same region as the MSP primers; spanning −2352 to −2414 bp. The targeted sequence included a total of six CpGs. A distinctive change was notable amongst all cytosine residues after bisulfite treatment. MCF10A and MCF10AT did not have any methylcytosines at any of the residues analyzed by BGS (Fig. 3c). In all three metastatic lines, MCFC10CA1a cl.1, MDA-MB-231, and MDA-MB-435 sequencing identified a specific region of methylation (Fig. 3c).
Aberrant methylation of BRMS1 is observed in breast tumors
To study if there is a correlation between epigenetic modulation of BRMS1 and disease prognosis, we examined the methylation profile in breast cancer clinical samples. Tissues from patients included normal ductal epithelium, primary locally invasive cancer, and lymph node metastases. Tissues were laser microdissected and used for subsequent bisulfite modification. Twelve sets from individual patients had matched normal epithelium, primary tumor, and lymph node metastases and an additional eight patients provided four lymph node metastases and five primary tumors. To assess if hypermethylation of BRMS1 correlated to different stages of cancer progression, MSP analysis was done. Methylation specific bands were detected in both, primary tumors and in lymph node metastases. From the 12 matched samples, methylation of BRMS1 was evident in five of the primary tumors as well as eight lymph node metastases (Fig. 4a). In five patients both primary tumor and lymph node obtained from the same patient displayed BRMS1 hypermethylation suggesting that hypermethylation of BRMS1 could be an early event, one that may be involved in disease progression. Overall, from 20 patients, 60% of the lymph node metastases and 45% of the primary tumors metastases produced methylated amplicons (Table 1).
Fig. 4.

Methylation of BRMS1 is correlated with metastatic breast tumors. (a) A cohort of matched-patients breast tumors were analyzed using MSP. Cells were isolated using laser capture microdissection from which DNA was extracted and subjected to MSP. All twelve matched patient samples examined are shown here. U = Unmethylated primers; M = Methylated primers. (b) One set of matched patient tissues was examined by BGS. A representative of 10 sequenced clones is shown here. The open circle represents unmethylated CG residues while the closed circle depicts methylated CG residues
Table 1.
Methylation status of the BRMS1 CpG island B in the tumor specimens assessed
| Patient 1 | Normal | Unmethylated |
| Tumor | Unmethylated | |
| LN Met | Methylated | |
| Patient 2 | Normal | Unmethylated |
| Tumor | Unmethylated | |
| LN Met | Unmethylated | |
| Patient 3 | Normal | Unmethylated |
| Tumor | Unmethylated | |
| LN Met | Unmethylated | |
| Patient 4 | Normal | Unmethylated |
| Tumor | Unmethylated | |
| LN Met | Methylated | |
| Patient 5 | Normal | Unmethylated |
| Tumor | Methylated | |
| LN Met | Methylated | |
| Patient 6 | Normal | Methylated |
| Tumor | Methylated | |
| LN Met | Methylated | |
| Patient 7 | Normal | Unmethylated |
| Tumor | Methylated | |
| LN Met | Methylated | |
| Patient 8 | Normal | Unmethylated |
| Tumor | Methylated | |
| LN Met | Methylated | |
| Patient 9 | Normal | Unmethylated |
| Tumor | Unmethylated | |
| LN Met | Unmethylated | |
| Patient 10 | Normal | Unmethylated |
| Tumor | Methylated | |
| LN Met | Methylated | |
| Patient 11 | Normal | Unmethylated |
| Tumor | Unmethylated | |
| LN Met | Methylated | |
| Patient 12 | Normal | Unmethylated |
| Tumor | Unmethylated | |
| LN Met | Unmethylated | |
| Patient 13 | LN Met | Methylated |
| Patient 14 | LN Met | Methylated |
| Patient 15 | Tumor | Methylated |
| Patient 16 | Tumor | Methylated |
| Patient 17 | Tumor | Unmethylated |
| LN Met | Methylated | |
| Patient 18 | Tumor | Methylated |
| Patient 19 | Tumor | Methylated |
| Patient 20 | LN Met | Methylated |
We established a pattern of CpG methylation in the matched tissue set from one patient by means of BGS. Sequences from normal, primary, and lymph node metastases were compared. Both primary tumor and metastases had more methylated cytosines (Fig. 4b), consistent with a role of methylation in downregulating expression of BRMS1.
BRMS1 expression in primary tumors was correlated to the methylation profile using immunohistochemistry. As depicted in Table 2, in patients 6 and 7 where hypermethylation was evident in both the primary tumor as well as lymph node metastases, immunohistochemistry revealed a low level of BRMS1 protein expression in the primary tumors (immunoscores = 0.70 and 0.83). Moreover, Patient 6 revealed the lowest amount of BRMS1 nuclear staining; in this particular patient (Patient 6) all three tissues yielded a methylated amplicon. In Patient 11, BRMS1 staining was stronger (immunoscore = 1.83); this was in agreement with the MSP analysis of the primary tumor which did not indicate any methylation.
Table 2.
Decreased staining of BRMS1 in primary tumors correlates with hypermethylation
| Patient | Tissue | MSP | Nuclear Score |
Photomicrograph |
|---|---|---|---|---|
| Patient 6 | Primary Tumor |
Methylated | 0.70 |  |
| Patient 7 | Primary Tumor |
Methylated | 0.83 | 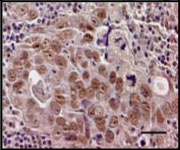 |
| Patient 11 | Primary Tumor |
Unmethylated | 1.83 |  |
Selected primary tissues were sectioned and stained for BRMS1. Immunostaining was primarily nuclear. Immunoscores were derived by a scoring system that incorporates both the percentage of cells staining and the intensity of the staining. The number of cells with nuclear staining and the intensity of staining is greater in the tumor from patient 11 than in those from Patients 6 and 7. Photomicrographs were obtained at 200× magnification. The bar corresponds to 50 microns. Scores were compared to MSP analysis to determine a correlation between BRMS1 expression and hypermethylation
Discussion
Epigenetic modifications play a significant role in regulation of a variety of genes responsible for cancer progression. Genes having significant relevance in breast cancer such as nm23, BRCA1, p16, and 14-3-3σ have been reported to also be under the control of epigenetic mechanisms suggesting that hypermethylation of genes is a broad spectrum phenomenon [31–38]. Methylation of 14-3-3σ is commonly seen in prostate cancer lesions, ovarian cancer, breast and lung carcinomas [34, 39–44]. The metastasis suppressor gene, nm23 is methylated in breast cancer and re-expression of the gene following treatment with 5-aza-2′-deoxycytidine resulted in a decrease in motility of the breast cancer cells [31]. Recent research has provided more insight into the role of BRMS1 as a potential prognostic marker in breast cancer. While various clinical studies have demonstrated that the loss of BRMS1 during breast cancer progression is correlated with patient survival signifying poor prognosis [5–7], some other studies have reported contrasting findings [45, 46]. These studies however, did not involve microdissected tumor material that would ensure purity of the starting material in a heterogeneous tumor mass. Moreover, it has recently been shown that BRMS1 protein is stabilized by Hsp90 and that its turnover is proteosome-dependent [14]. Thus, assessment of BRMS1 mRNA may not be correlative to the protein levels of BRMS1. Here we show that in breast cancer, BRMS1 promoter shows a hypermethylated CpG island.
We identified two putative CpG islands in the promoter region of BRMS1. Furthermore, using breast cancer cell lines that represent various levels of aggressiveness we determined that the tumorigenic and metastatic cell lines display reduced levels of BRMS1 (Fig. 1). Hence we hypothesized that promoter hypermethylation is a cause of BRMS1 downregulation in advanced stage breast carcinomas. We performed MSP and determined that the metastatic cell lines display methylation of CpG Island B. Further, treatment of the cells with the demethylating agent, 5-aza-2′-deoxycytidine reversed the methylation pattern in the cells with respect to CpG Island B. We correspondingly saw a 7–10 fold increase in the expression of BRMS1 protein from the treated MDA-MB-231 cells (Fig. 2b). CpG island B is also upstream of b3GNT1 (Fig. 2a) [47]. We saw a moderate increase in the level of β3GNT1 upon 5-aza-2′-deoxycytidine treatment of MCF10A and MCF10AT cells, whereas, treatment of the MCF10CA1a cl.1, MDA-MB-231 and MDA-MB-435 showed a decrease in the β3GNT1 levels (Supplemental Figure 2). There are no published reports of involvement of β3GNT1 in any type of cancer nor are there any reported studies on regulation of β3GNT1 by promoter methylation. However the exact nature of the impact of methylation of CpG island B on β3GNT1 and its disease relevance needs to be explored.
Further, we assessed multiple matched patient tissues and found a significant number of lymph node metastases to be hypermethylated in Island B, upstream of the BRMS1 promoter. Hypermethylation occurred in 60% of the lymph node metastases and 45%of the primary tumors in the patients that were examined, signifying that an increase in methylation coincides with cancer development and progression. Unexpectedly, in one case, MSP indicated methylation in the normal tissue as well. This could be attributed to the possible contamination from cells of the primary tumor or could be indicative of cases of somatic hypermethylation of BRMS1. We have minimized the possibility of contamination from unwanted cells by obtaining pure cell populations using laser capture microdissection under the guidance of two independent pathologists. Hence we believe that contamination is not an issue. Somatic hypermethylation events have been reported for km23 (a TGF-β receptor-interacting protein), ATM, BRCA1 & 2 [48–50]. Our observations on the existence of somatic hypermethylation of BRMS1 may have a bearing on the susceptibility to develop breast cancer metastases or overall patient prognosis; however this study is underpowered to address this issue.
We also observe that the extent of downregulation of BRMS1 in various cancer cell lines (as seen in Fig. 1) is not directly proportional to the CpG methylation signature e.g., MDA-MB-231 shows extensive methylation of the CG residues (Fig. 3c) but does not show a proportionately reduced expression of BRMS1 mRNA (Fig. 1), as one might expect. This could be due to two possibilities: Firstly, methylation status may be under-estimated because the high density of CpG in the region made primer design difficult. Secondly, there could be other mechanism(s) of regulation of BRMS1 that may operate independently or in concert with methylation of the promoter region.
In Fig. 4b, which depicts the BGS of Patient 1, we see that the primary tumor cells show evidence (3 out of 10 sequenced clones) of hypermethylation of BRMS1. Interestingly, this is not reflected in the MSP of this patient (Fig. 4a). This may represent hemi-methylation of the BRMS1 alleles in the primary tumor. Further the lymph node metastases from this patient show hypermethylation of BRMS1 by MSP (Fig. 4a) and BGS (Fig. 4b), suggesting that the methylation of the CG residues increases at the metastatic site. Currently there are no known mutations in the BRMS1 gene that would lead to alterations in expression. Hicks et al. previously examined BRMS1 gene copy number in patients exhibiting low BRMS1 staining as a plausible means of expression loss however; it was concluded that gene copy number did not change, by means of comparative genomic hybridization, significantly in these cases to effect BRMS1 expression [7]. We immunostained selected primary tumor tissues for BRMS1 and discovered that the levels of BRMS1 protein correlated with the methylation status of the BRMS1 promoter (Table 2). Thus, the two tissues that revealed methylation of Island B showed low immunoscores for BRMS1.
Mechanism of CpG methylation is still under debate [51–53]. Deregulation of DNA methyltransferases have been implicated as a potential link to hypermethylation [54]. Some studies suggest that the activity of DNA methyltransferases does not correlate with the hypermethylation of CpGs within a gene [55] yet, others have shown elevated DNA methyltransferases in a subset of patients which exhibit gene hypermethylation [53, 56, 57].
In conclusion, BRMS1 silencing occurs via an epigenetic mechanism in breast cancer development and progression. Moreover, treatment with 5-aza-2′-deoxycytidine reversed the methylated status of the BRMS1 promoter allowing for increased expression of BRMS1 protein. Thus, epigenetic silencing of BRMS1 may not only be useful as potential prognostic marker, but also could possibly be used for targeted breast cancer treatment [31, 58].
Supplementary Material
Acknowledgments
This work was supported by grants BCTR0402317 (LAS) and BCTR0503488 (RSS) from Susan G. Komen for the Cure and CA88728 (DRW) and CA89019 (DRW, ARF, LRS, RSS), National Foundation for Cancer Research (DRW, ARF).
Abbreviations
- 5-aza-dC
5-Aza-2′-deoxycytidine
- BGS
Bisulfite genomic sequencing
- BRMS1
Breast Cancer Metastasis Suppressor
- IDV
Integrated density value
- LN Met
Metastatic breast cancer cells that metastasized to the lymph node
- MSP
Methylation specific PCR
- TE
Tris–EDTA
Footnotes
Electronic supplementary material The online version of this article (doi:10.1007/s10585-008-9187-x) contains supplementary material, which is available to authorized users.
Contributor Information
Brandon J. Metge, Department of Oncologic Sciences, USA-Mitchell Cancer Institute, University of South Alabama, 307 N. University Blvd., Mobile, AL 36688, USA
Andra R. Frost, Department of Pathology, University of Alabama at Birmingham, Birmingham, AL, USA
Judy A. King, Department of Pharmacology, University of South Alabama, Mobile, AL, USA Department of Pathology, University of South Alabama, Mobile, AL, USA.
Donna Lynn Dyess, Department of Surgery, University of South Alabama, Mobile, AL, USA.
Danny R. Welch, Email: danwelch@uab.edu, Department of Pathology, University of Alabama at Birmingham, Birmingham, AL, USA; NFCR-Center for Metastasis Research, University of Alabama at Birmingham, Birmingham, AL, USA.
Rajeev S. Samant, Email: lsamant@usouthal.edu, Department of Oncologic Sciences, USA-Mitchell Cancer Institute, University of South Alabama, 307 N. University Blvd., Mobile, AL 36688, USA.
Lalita A. Shevde, Department of Oncologic Sciences, USA-Mitchell Cancer Institute, University of South Alabama, 307 N. University Blvd., Mobile, AL 36688, USA
References
- 1.Shevde LA, Welch DR. Metastasis suppressor pathways—an evolving paradigm. Cancer Lett. 2003;198:1–20. doi: 10.1016/s0304-3835(03)00304-5. doi: 10.1016/S0304-3835(03)00304-5. [DOI] [PubMed] [Google Scholar]
- 2.Samant RS, Seraj MJ, Saunders MM, Sakamaki TS, Shevde LA, Harms JF, et al. Analysis of mechanisms underlying BRMS1 suppression of metastasis. Clin Exp Metastasis. 2000;18:683–693. doi: 10.1023/a:1013124725690. doi: 10.1023/A:1013124725690. [DOI] [PubMed] [Google Scholar]
- 3.Seraj MJ, Samant RS, Verderame MF, Welch DR. Functional evidence for a novel human breast carcinoma metastasis suppressor, BRMS1, encoded at chromosome 11q13. Cancer Res. 2000;60:2764–2769. [PubMed] [Google Scholar]
- 4.Samant RS, Debies MT, Shevde LA, Verderame MF, Welch DR. Identification and characterization of the murine ortholog (brms1) of breast-cancer metastasis suppressor 1 (BRMS1) Int J Cancer. 2002;97:15–20. doi: 10.1002/ijc.1569. doi: 10.1002/ijc.1569. [DOI] [PubMed] [Google Scholar]
- 5.Zhang Z, Yamashita H, Toyama T, Yamamoto Y, Kawasoe T, Iwase H. Reduced expression of the breast cancer metastasis suppressor 1 mRNA is correlated with poor progress in breast cancer. Clin Cancer Res. 2006;12:6410–6414. doi: 10.1158/1078-0432.CCR-06-1347. doi: 10.1158/1078-0432.CCR-06-1347. [DOI] [PubMed] [Google Scholar]
- 6.Stark AM, Tongers K, Maass N, Mehdorn HM, Held-Feindt J. Reduced metastasis-suppressor gene mRNA-expression in breast cancer brain metastases. J Cancer Res Clin Oncol. 2005;131:191–198. doi: 10.1007/s00432-004-0629-9. doi: 10.1007/s00432-004-0629-9. [DOI] [PubMed] [Google Scholar]
- 7.Hicks DG, Yoder BJ, Short S, Tarr S, Prescott N, Crowe JP, et al. Loss of breast cancer metastasis suppressor 1 protein expression predicts reduced disease-free survival in subsets of breast cancer patients. Clin Cancer Res. 2006;12:6702–6708. doi: 10.1158/1078-0432.CCR-06-0635. doi: 10.1158/1078-0432.CCR-06-0635. [DOI] [PMC free article] [PubMed] [Google Scholar]
- 8.Saunders MM, Seraj MJ, Li Z, Zhou Z, Winter CR, Welch DR, et al. Breast cancer metastatic potential correlates with a breakdown in homospecific and heterospecific gap junctional intercellular communication. Cancer Res. 2001;61:1765–1767. [PubMed] [Google Scholar]
- 9.Shevde LA, Samant RS, Goldberg SF, Sikaneta T, Alessandrini A, Donahue HJ, et al. Suppression of human melanoma metastasis by the metastasis suppressor gene, BRMS1. Exp Cell Res. 2002;273:229–239. doi: 10.1006/excr.2001.5452. doi: 10.1006/excr.2001.5452. [DOI] [PubMed] [Google Scholar]
- 10.DeWald DB, Torabinejad J, Samant RS, Johnston D, Erin N, Shope JC, et al. Metastasis suppression by breast cancer metastasis suppressor 1 involves reduction of phosphoinositide signaling in MDA-MB-435 breast carcinoma cells. Cancer Res. 2005;65:713–717. [PubMed] [Google Scholar]
- 11.Liu Y, Smith PW, Jones DR. Breast cancer metastasis suppressor 1 functions as a corepressor by enhancing histone deacetylase 1-mediated deacetylation of RelA/p65 and promoting apoptosis. Mol Cell Biol. 2006;26:8683–8696. doi: 10.1128/MCB.00940-06. doi: 10.1128/MCB.00940-06. [DOI] [PMC free article] [PubMed] [Google Scholar]
- 12.Cicek M, Fukuyama R, Welch DR, Sizemore N, Casey G. Breast cancer metastasis suppressor 1 inhibits gene expression by targeting nuclear factor-kappaB activity. Cancer Res. 2005;65:3586–3595. doi: 10.1158/0008-5472.CAN-04-3139. doi: 10.1158/0008-5472.CAN-04-3139. [DOI] [PubMed] [Google Scholar]
- 13.Samant RS, Clark DW, Fillmore RA, Cicek M, Metge BJ, Chandramouli KH, et al. Breast cancer metastasis suppressor 1 (BRMS1) inhibits osteopontin transcription by abrogating NF-kappaB activation. Mol Cancer. 2007;6:6. doi: 10.1186/1476-4598-6-6. doi: 10.1186/1476-4598-6-6. [DOI] [PMC free article] [PubMed] [Google Scholar]
- 14.Hurst DR, Mehta A, Moore BP, Phadke PA, Meehan WJ, Accavitti MA, et al. Breast cancer metastasis suppressor 1 (BRMS1) is stabilized by the Hsp90 chaperone. Biochem Biophys Res Commun. 2006;348:1429–1435. doi: 10.1016/j.bbrc.2006.08.005. doi: 10.1016/j.bbrc.2006.08.005. [DOI] [PMC free article] [PubMed] [Google Scholar]
- 15.Meehan WJ, Samant RS, Hopper JE, Carrozza MJ, Shevde LA, Workman JL, et al. Breast cancer metastasis suppressor 1 (BRMS1) forms complexes with retinoblastoma-binding protein 1 (RBP1) and the mSin3 histone deacetylase complex and represses transcription. J Biol Chem. 2004;279:1562–1569. doi: 10.1074/jbc.M307969200. doi: 10.1074/jbc.M307969200. [DOI] [PubMed] [Google Scholar]
- 16.Champine PJ, Michaelson J, Weimer BC, Welch DR, Dewald DB. Microarray analysis reveals potential mechanisms of BRMS1-mediated metastasis suppression. Clin Exp Metastasis. 2007;24:551–565. doi: 10.1007/s10585-007-9092-8. doi: 10.1007/s10585-007-9092-8. [DOI] [PMC free article] [PubMed] [Google Scholar]
- 17.Cicek M, Samant RS, Kinter M, Welch DR, Casey G. Identification of metastasis-associated proteins through protein analysis of metastatic MDA-MB-435 and metastasis-suppressed BRMS1 transfected-MDA-MB-435 cells. Clin Exp Metastasis. 2004;21:149–157. doi: 10.1023/b:clin.0000024729.19084.f0. doi: 10.1023/B:CLIN.0000024729.19084.f0. [DOI] [PubMed] [Google Scholar]
- 18.Rivera J, Megias D, Bravo J. Proteomics-based strategy to delineate the molecular mechanisms of the metastasis suppressor gene BRMS1. J Proteome Res. 2007;6:4006–4018. doi: 10.1021/pr0703167. [DOI] [PubMed] [Google Scholar]
- 19.Santner SJ, Dawson PJ, Tait L, Soule HD, Eliason J, Mohamed AN, et al. Malignant MCF10CA1 cell lines derived from premalignant human breast epithelial MCF10AT cells. Breast Cancer Res Treat. 2001;65:101–110. doi: 10.1023/a:1006461422273. doi: 10.1023/A:1006461422273. [DOI] [PubMed] [Google Scholar]
- 20.Miller FR, Santner SJ, Tait L, Dawson PJ. MCF10DCIS.com xenograft model of human comedo ductal carcinoma in situ. J Natl Cancer Inst. 2000;92:1185–1186. doi: 10.1093/jnci/92.14.1185a. doi: 10.1093/jnci/92.14.1185A. [DOI] [PubMed] [Google Scholar]
- 21.Ellison G, Klinowska T, Westwood RF, Docter E, French T, Fox JC. Further evidence to support the melanocytic origin of MDA-MB-435. Mol Pathol. 2002;55:294–299. doi: 10.1136/mp.55.5.294. doi: 10.1136/mp. 55.5.294. [DOI] [PMC free article] [PubMed] [Google Scholar]
- 22.Rae JM, Ramus SJ, Waltham M, Armes JE, Campbell IG, Clarke R, et al. Common origins of MDA-MB-435 cells from various sources with those shown to have melanoma properties. Clin Exp Metastasis. 2004;21:543–552. doi: 10.1007/s10585-004-3759-1. doi: 10.1007/s10585-004-3759-1. [DOI] [PubMed] [Google Scholar]
- 23.Rae JM, Creighton CJ, Meck JM, Haddad BR, Johnson MD. MDA-MB-435 cells are derived from M14 melanoma cells–a loss for breast cancer, but a boon for melanoma research. Breast Cancer Res Treat. 2007;104:13–19. doi: 10.1007/s10549-006-9392-8. doi: 10.1007/s10549-006-9392-8. [DOI] [PubMed] [Google Scholar]
- 24.Christgen M, Lehmann U. MDA-MB-435: the questionable use of a melanoma cell line as a model for human breast cancer is ongoing. Cancer Biol Ther. 2007;6:1355–1357. doi: 10.4161/cbt.6.9.4624. [DOI] [PubMed] [Google Scholar]
- 25.Sellappan S, Grijalva R, Zhou X, Yang W, Eli MB, Mills GB, et al. Lineage infidelity of MDA-MB-435 cells: expression of melanocyte proteins in a breast cancer cell line. Cancer Res. 2004;64:3479–3485. doi: 10.1158/0008-5472.CAN-3299-2. doi: 10.1158/0008-5472.CAN-3299-2. [DOI] [PubMed] [Google Scholar]
- 26.Welch DR. Technical considerations for studying cancer metastasis in vivo. Clin Exp Metastasis. 1997;15:272–306. doi: 10.1023/a:1018477516367. doi: 10.1023/A:1018477516367. [DOI] [PubMed] [Google Scholar]
- 27.Hurst DR, Xie Y, Vaidya KS, Mehta A, Moore BP, Accavitti-Loper MA, Samant RS, Saxena R, Silveira AC, Welch DR. Alterations of breast cancer metastasis suppressor 1:At rich interactive domain 4A interaction modify gene expression but still suppress metastasis in human breast cancer cells. J Biol Chem. 2008;283(12):7438–7444. doi: 10.1074/jbc.M709446200. [DOI] [PMC free article] [PubMed] [Google Scholar]
- 28.Takai D, Jones PA. The CpG island searcher: a new WWW resource. In Silico Biol. 2003;3:235–240. [PubMed] [Google Scholar]
- 29.Li LC, Dahiya R. MethPrimer: designing primers for methylation PCRs. Bioinformatics (Oxford, England) 2002;18:1427–1431. doi: 10.1093/bioinformatics/18.11.1427. doi: 10.1093/bioinformatics/18.11.1427. [DOI] [PubMed] [Google Scholar]
- 30.Shevde LA, Samant RS, Paik JC, Metge BJ, Chambers AF, Casey G, et al. Osteopontin knockdown suppresses tumorigenicity of human metastatic breast carcinoma, MDA-MB-435. Clin Exp Metastasis. 2006;23:123–133. doi: 10.1007/s10585-006-9013-2. doi: 10.1007/s10585-006-9013-2. [DOI] [PMC free article] [PubMed] [Google Scholar]
- 31.Hartsough MT, Clare SE, Mair M, Elkahloun AG, Sgroi D, Osborne CK, et al. Elevation of breast carcinoma Nm23-H1 metastasis suppressor gene expression and reduced motility by DNA methylation inhibition. Cancer Res. 2001;61:2320–2327. [PubMed] [Google Scholar]
- 32.Loeb DM, Evron E, Patel CB, Sharma PM, Niranjan B, Buluwela L, et al. Wilms’ tumor suppressor gene (WT1) is expressed in primary breast tumors despite tumor-specific promoter methylation. Cancer Res. 2001;61:921–925. [PubMed] [Google Scholar]
- 33.Evron E, Umbricht CB, Korz D, Raman V, Loeb DM, Niranjan B, et al. Loss of cyclin D2 expression in the majority of breast cancers is associated with promoter hypermethylation. Cancer Res. 2001;61:2782–2787. [PubMed] [Google Scholar]
- 34.Umbricht CB, Evron E, Gabrielson E, Ferguson A, Marks J, Sukumar S. Hypermethylation of 14-3-3 sigma (stratifin) is an early event in breast cancer. Oncogene. 2001;20:3348–3353. doi: 10.1038/sj.onc.1204438. doi: 10.1038/sj.onc.1204438. [DOI] [PubMed] [Google Scholar]
- 35.Asch BB, Barcellos-Hoff MH. Epigenetics and breast cancer. J Mammary Gland Biol Neoplasia. 2001;6:151–152. doi: 10.1023/a:1011306222533. doi: 10.1023/A:1011306222533. [DOI] [PubMed] [Google Scholar]
- 36.Yang X, Yan L, Davidson NE. DNA methylation in breast cancer. EndocrRelat Cancer. 2001;8:115–127. doi: 10.1677/erc.0.0080115. doi: 10.1677/erc.0.0080115. [DOI] [PubMed] [Google Scholar]
- 37.Jacinto FV, Esteller M. Mutator pathways unleashed by epigenetic silencing in human cancer. Mutagenesis. 2007;22:247–253. doi: 10.1093/mutage/gem009. doi: 10.1093/mutage/gem009. [DOI] [PubMed] [Google Scholar]
- 38.Jing F, Zhang J, Tao J, Zhou Y, Jun L, Tang X, et al. Hypermethylation of tumor suppressor genes BRCA1, p16 and 14-3-3sigma in serum of sporadic breast cancer patients. Onkologie. 2007;30:14–19. doi: 10.1159/000096892. doi: 10.1159/000096892. [DOI] [PubMed] [Google Scholar]
- 39.Cheng L, Pan CX, Zhang JT, Zhang S, Kinch MS, Li L, et al. Loss of 14-3-3sigma in prostate cancer and its precursors. Clin Cancer Res. 2004;10:3064–3068. doi: 10.1158/1078-0432.ccr-03-0652. doi: 10.1158/1078-0432.CCR-03-0652. [DOI] [PubMed] [Google Scholar]
- 40.Henrique R, Jeronimo C, Hoque MO, Carvalho AL, Oliveira J, Teixeira MR, et al. Frequent 14-3-3 sigma promoter methylation in benign and malignant prostate lesions. DNA Cell Biol. 2005;24:264–269. doi: 10.1089/dna.2005.24.264. doi: 10.1089/dna.2005.24.264. [DOI] [PubMed] [Google Scholar]
- 41.Ferguson AT, Evron E, Umbricht CB, Pandita TK, Chan TA, Hermeking H, et al. High frequency of hypermethylation at the 14-3-3 sigma locus leads to gene silencing in breast cancer. Proc Natl Acad Sci USA. 2000;97:6049–6054. doi: 10.1073/pnas.100566997. doi: 10.1073/pnas.100566997. [DOI] [PMC free article] [PubMed] [Google Scholar]
- 42.Iwata N, Yamamoto H, Sasaki S, Itoh F, Suzuki H, Kikuchi T, et al. Frequent hypermethylation of CpG islands and loss of expression of the 14-3-3 sigma gene in human hepatocellular carcinoma. Oncogene. 2000;19:5298–5302. doi: 10.1038/sj.onc.1203898. doi: 10.1038/sj.onc.1203898. [DOI] [PubMed] [Google Scholar]
- 43.Osada H, Tatematsu Y, Yatabe Y, Nakagawa T, Konishi H, Harano T, et al. Frequent and histological type-specific inactivation of 14-3-3sigma in human lung cancers. Oncogene. 2002;21:2418–2424. doi: 10.1038/sj.onc.1205303. doi: 10.1038/sj.onc.1205303. [DOI] [PubMed] [Google Scholar]
- 44.Kaneuchi M, Sasaki M, Tanaka Y, Shiina H, Verma M, Ebina Y, et al. Expression and methylation status of 14-3-3 sigma gene can characterize the different histological features of ovarian cancer. Biochem Biophys Res Commun. 2004;316:1156–1162. doi: 10.1016/j.bbrc.2004.02.171. doi: 10.1016/j.bbrc.2004.02.171. [DOI] [PubMed] [Google Scholar]
- 45.Lombardi G, Di Cristofano C, Capodanno A, Iorio MC, Aretini P, Isola P, et al. High level of messenger RNA for BRMS1 in primary breast carcinomas is associated with poor prognosis. Int J Cancer. 2007;120:1169–1178. doi: 10.1002/ijc.22379. doi: 10.1002/ijc.22379. [DOI] [PubMed] [Google Scholar]
- 46.Kelly LM, Buggy Y, Hill A, O′Donovan N, Duggan C, McDermott EW, et al. Expression of the breast cancer metastasis suppressor gene, BRMS1, in human breast carcinoma: lack of correlation with metastasis to axillary lymph nodes. Tumour Biol. 2005;26:213–216. doi: 10.1159/000086955. doi: 10.1159/000086955. [DOI] [PubMed] [Google Scholar]
- 47.Schwientek T, Nomoto M, Levery SB, Merkx G, van Kessel AG, Bennett EP, et al. Control of O-glycan branch formation. Molecular cloning of human cDNA encoding a novel beta1, 6-N-acetylglucosaminyltransferase forming core 2 and core 4. J Biol Chem. 1999;274:4504–4512. doi: 10.1074/jbc.274.8.4504. doi: 10.1074/jbc.274.8.4504. [DOI] [PubMed] [Google Scholar]
- 48.Campbell IG, Phillips WA, Choong DY. Genetic and epigenetic analysis of the putative tumor suppressor km23 in primary ovarian, breast, and colorectal cancers. Clin Cancer Res. 2006;12:3713–3715. doi: 10.1158/1078-0432.CCR-06-0800. doi: 10.1158/1078-0432.CCR-06-0800. [DOI] [PubMed] [Google Scholar]
- 49.Gumy-Pause F, Wacker P, Maillet P, Betts DR, Sappino AP. ATM promoter analysis in childhood lymphoid malignancies: a brief communication. Leuk Res. 2006;30:335–337. doi: 10.1016/j.leukres.2005.07.012. doi: 10.1016/j.leukres.2005.07.012. [DOI] [PubMed] [Google Scholar]
- 50.Alvarez S, Diaz-Uriarte R, Osorio A, Barroso A, Melchor L, Paz MF, et al. A predictor based on the somatic genomic changes of the BRCA1/BRCA2 breast cancer tumors identifies the non-BRCA1/BRCA2 tumors with BRCA1 promoter hypermethylation. Clin Cancer Res. 2005;11:1146–1153. [PubMed] [Google Scholar]
- 51.Hasegawa M, Nelson HH, Peters E, Ringstrom E, Posner M, Kelsey KT. Patterns of gene promoter methylation in squamous cell cancer of the head and neck. Oncogene. 2002;21:4231–4236. doi: 10.1038/sj.onc.1205528. doi: 10.1038/sj.onc.1205528. [DOI] [PubMed] [Google Scholar]
- 52.Lu R, Fang JY, Zhu HY, Chen YX, Cheng ZH, Li EL. Effect of eukaryotic expression plasmid DNA methyltransferase gene on methylation status and transcription level of DNA mismatch repair genes in human colon cancer cell line. Zhonghua Yi Xue Za Zhi. 2004;84:1014–1017. [PubMed] [Google Scholar]
- 53.Wang L, Wang J, Sun S, Rodriguez M, Yue P, Jang SJ, et al. A novel DNMT3B subfamily, DeltaDNMT3B, is the predominant form of DNMT3B in non-small cell lung cancer. Int J Oncol. 2006;29:201–207. [PubMed] [Google Scholar]
- 54.Tate PH, Bird AP. Effects of DNA methylation on DNA-binding proteins and gene expression. Curr Opin Genet Dev. 1993;3:226–231. doi: 10.1016/0959-437x(93)90027-m. doi: 10.1016/0959-437X(93)90027-M. [DOI] [PubMed] [Google Scholar]
- 55.Sato M, Horio Y, Sekido Y, Minna JD, Shimokata K, Hasegawa Y. The expression of DNA methyltransferases and methyl-CpG-binding proteins is not associated with the methylation status of p14(ARF), p16(INK4a) and RASSF1A in human lung cancer cell lines. Oncogene. 2002;21:4822–4829. doi: 10.1038/sj.onc.1205581. doi: 10.1038/sj.onc.1205581. [DOI] [PubMed] [Google Scholar]
- 56.Gao Y, Guan M, Su B, Liu W, Xu M, Lu Y. Hypermethylation of the RASSF1A gene in gliomas. Clin Chim Acta. 2004;349:173–179. doi: 10.1016/j.cccn.2004.07.006. doi: 10.1016/j.cccn.2004.07.006. [DOI] [PubMed] [Google Scholar]
- 57.Fang JY, Cheng ZH, Chen YX, Lu R, Yang L, Zhu HY, et al. Expression of Dnmt1, demethylase, MeCP2 and methylation of tumor-related genes in human gastric cancer. World J Gastroenterol. 2004;10:3394–3398. doi: 10.3748/wjg.v10.i23.3394. [DOI] [PMC free article] [PubMed] [Google Scholar]
- 58.Steeg PS, Ouatas T, Halverson D, Palmieri D, Salerno M. Metastasis suppressor genes: basic biology and potential clinical use. Clin Breast Cancer. 2003;4:51–62. doi: 10.3816/cbc.2003.n.012. [DOI] [PubMed] [Google Scholar]
Associated Data
This section collects any data citations, data availability statements, or supplementary materials included in this article.