Abstract
Background
Accurate fluid mechanics models are important tools for predicting the flow field in the carotid artery bifurcation and for understanding the relationship between hemodynamics and the initiation and progression of atherosclerosis. Clinical imaging modalities can be used to obtain geometry and blood flow data for developing subject-specific, human carotid artery bifurcation models.
Method of Approach
We developed subject-specific computational fluid dynamics (CFD) models of the human carotid bifurcation from magnetic resonance (MR) geometry data and phase contrast MR (PCMR) velocity data, measured in vivo. Two simulations were conducted with identical geometry, flow rates, and fluid parameters: (1) Simulation 1 used in vivo, measured velocity distributions as time-varying boundary conditions, and (2) Simulation 2 used idealized, fully-developed velocity profiles as boundary conditions.
Results
The position and extent of negative axial velocity regions (NAVR) vary between the two simulations at any given point in time, and these regions vary temporally within each simulation. The combination of inlet velocity boundary conditions, geometry, and flow waveforms influences NAVRs. In particular, the combination of flow division and the location of the velocity peak with respect to individual carotid geometry landmarks (bifurcation apex position and the departure angle of the IC) influences the size and location of these reversed flow zones. Average axial wall shear stress (WSS) distributions are qualitatively similar for the two simulations; however, instantaneous WSS values vary with the choice of velocity boundary conditions.
Conclusions
By developing subject-specific simulations from in vivo measured geometry and flow data and varying the velocity boundary conditions in otherwise identical models we isolated the effects of measured versus idealized velocity distributions on blood flow patterns. Choice of velocity distributions at boundary conditions are shown to influence pathophysiologically relevant flow patterns in the human carotid bifurcation. Although mean WSS distributions are qualitatively similar for measured and idealized inlet boundary conditions, instantaneous NAVRs differ and warrant imposing in vivo velocity boundary conditions in computational simulations. A simulation based on in vivo measured velocity distributions is preferred for modeling hemodynamics in subject-specific carotid artery bifurcation models when studying atherosclerosis initiation and development.
Keywords: atherosclerosis, carotid artery, computational fluid dynamics (CFD), fluid mechanics, wall shear stress (WSS), negative axial velocity regions (NAVR)
INTRODUCTION
Atherosclerotic plaque initiation, progression, and vulnerability in the human carotid artery correlate with localized fluid flow phenomena (e.g., low and oscillating wall shear stress (WSS), locally reversed flow) [1, 2]. These salient flow features are sensitive to variations in boundary conditions such as bifurcation angle and flow division [3]. Due to inter-subject variability of geometry and flow rate [3, 4] this sensitivity creates challenges when constructing in vitro and computational fluid dynamics models with the goal of elucidating disease initiation and progression in individuals.
Non-invasive imaging techniques coupled with computational fluid dynamics (CFD) simulations are important tools for studying the flow field in individual, human arterial models, and these numerical models are a convenient platform for evaluating the influence of parameters (e.g., vessel geometry, wall compliance) on pathophysiologically relevant biomechanical properties [5]. Steinman [6] provides a thorough review of computational models based on medical imaging. Clinical imaging modalities such as magnetic resonance (MR) imaging measure geometry, flow rate, and velocity information for defining boundary conditions of CFD models [3, 7–13]. Due to the carotid bifurcation size and proximity to the surface, clinical imaging methods can provide accurate subject-specific, time-varying velocity data; however, the typical application of in vivo measured flow data for CFD boundary conditions often is as fully-developed velocity profiles [7, 9–13]. CFD simulations are inherently influenced by the choice of boundary conditions, and imposing either measured or idealized velocity distributions may influence flow field solutions, specifically local flow patterns relevant to atherosclerosis development. Milner et al. [11] identified, via phase contrast MR (PCMR), asymmetric velocity distributions in the common carotid of normal subjects and conjectured that, in addition to carotid bifurcation geometry and flow rate, the velocity boundary conditions affect the flow field.
In this study, we developed subject-specific CFD simulations from in vivo measured geometry, flow rate, and velocity distributions. By varying velocity boundary conditions in otherwise identical simulations, we isolated the contribution of velocity inlet conditions to the flow field and compared the effects of measured versus idealized velocity boundary conditions on clinically relevant flow patterns in a subject-specific model of a human carotid bifurcation. To further assess the influence of velocity boundary conditions on the flow field, we compared the results of these simulations with velocity data measured in vivo.
METHODS
A subject-specific model of a normal human carotid bifurcation was constructed from MR data of a right carotid measured in a 1.5T clinical scanner (Philips Medical Systems) with a head coil. The subject was a 26-year old female with no evidence of disease. The study was approved by the Emory University internal review board.
Two simulations were conducted with identical geometry, flow rates, and fluid parameters. Simulation 1 used in vivo, measured velocity distributions as time-varying boundary conditions. For Simulation 2 idealized, fully-developed velocity profiles were applied as boundary conditions.
Model geometry
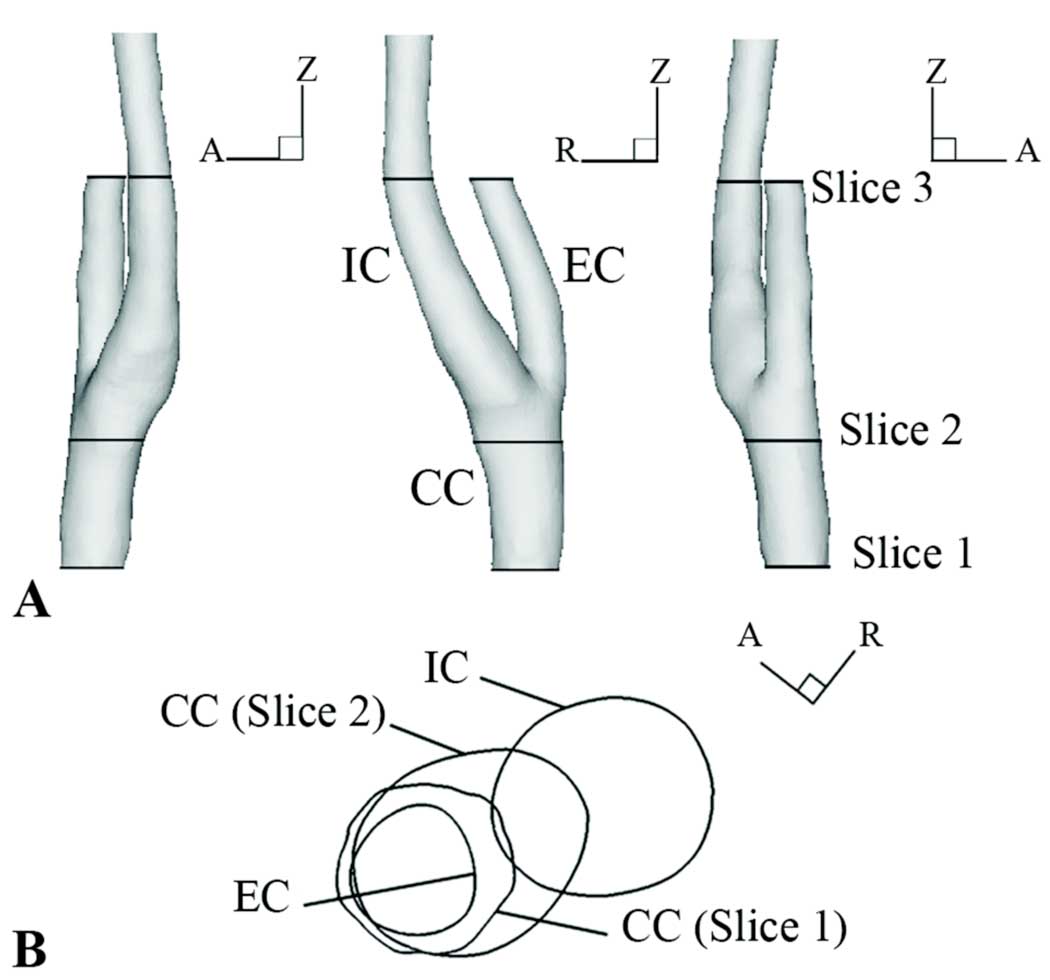
Image data were acquired using a 3D time of flight, gradient echo sequence (80 slices; 512×512 matrix; 160×160 field-of-view, 0.6mm slice thickness). Image acquisition was ECG-gated and occurred during diastole in the transverse plane. Lumen segmentation and geometry reconstruction of the three-dimensional data set were performed via conformal curvature flow implemented with level set methods [14]. This approach permits the user to adjust the weight of pixel intensity and curvature in the three-dimensional segmentation (and edge-detection) algorithm to suit the requirements of a particular data set and its applications. In addition, this method accommodates the topologically challenging “pinching-off” segmentation of bifurcating vessels and allows for reconstructing the vessel lumen with a physiologic apex. Using Visualization Toolkit v. 4.0.2. (Kitware, Inc.), the reconstructed surface was decimated, smoothed, and trimmed at the common carotid (CC) inlet, internal carotid (IC) outlet, and external carotid (EC) outlet to align with the velocity boundary condition acquisition planes and to produce smooth faces for application of boundary conditions (Fig. 1). GAMBIT (Fluent, Inc.) was used to construct the computational volume and to discretize it into hexahedral volume elements. The final computational model contained 173,000 nodes.
Figure 1.
A) MR-based subject-specific geometry with PCMR data slice locations. B) Axial view of Slice 1 and Slice 2 locations relative to IC and EC bifurcation directions.
Model boundary conditions
Following the MR geometry scan, time-varying axial velocities of the carotid artery blood flow were measured using PCMR at three slice locations normal to the vessel axial direction: Slice 1 and Slice 2 were measured proximal of the bifurcation and Slice 3 was measured distal of the bifurcation (Fig. 1, Table 1). Data from Slice 1 and Slice 3 were used for determining inflow boundary conditions and outflow boundary conditions, respectively; Slice 2 data were used for comparison with calculated results.
Table 1.
Phase contrast magnetic resonance (PCMR) imaging parameters.
| Slice 1 | Slice 2 | Slice 3 | |
|---|---|---|---|
| Phases | 16 | 16 | 15 |
| Resolution | 256×256 pixels | 256×256 pixels | 256×256 pixels |
| Slice dimensions | 160×160×6 mm | 160×160×4 mm | 160×160×4 mm |
Although in-plane velocities were not included as boundary conditions, the authors realize their contribution to the downstream velocity field is not negligible. Caro et al. (1992) demonstrated that head position induced secondary velocity differences in the CC and determined that repositioning the head to allow the CC artery to straighten reduced the in-plane velocity [15]. Glor et al. (2004) measured the change in maximum axial velocity in the CC, IC, and EC when head position was altered and concluded that changes in flow rate are larger contributors to differences in downstream maximum axial velocity than the geometric variation of the centerline, which could introduce non-axial flow [12]. In previous scans (not included in this study) the authors observed velocity profile skewing due to head position, and aware of the phenomenon, avoided such positioning, minimizing this contribution to downstream maximum axial velocities.
In vivo measured velocity distribution
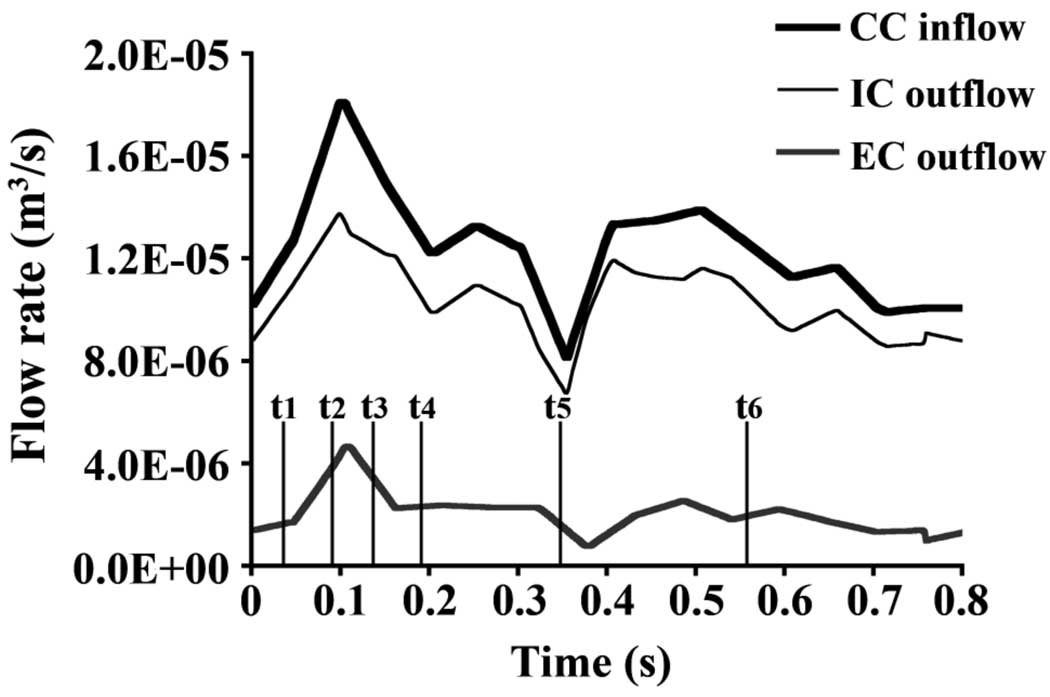
For Simulation 1, measured time- and spatially-varying velocity profiles were imposed as CC inflow and EC outflow boundary conditions. Using MATLAB (The MathWorks, Inc.) the nodal distributions across the CC inlet and EC outlet faces of the model were aligned with the lumens of their respective arteries in the magnitude images of the PCMR data. Since the faces of the computational model were aligned with the artery lumens in the PCMR data, radial wall motion at the CC inlet and EC outlet was accommodated when extracting velocity from the PCMR data; however, at Slice 2 the PCMR data showed considerable expansion/contraction and bulk movement (axial and in-plane) of the lumen. From the corresponding phase image of the PCMR data, the axial velocity values at each node location were bilinearly interpolated in-plane at each PCMR acquisition time point (16 time points at the CC inlet and 15 time points at the EC outlet) (Table 1) [16]. At each data acquisition time point, PCMR data were normalized against tissue that was presumed stationary: velocity values were averaged over a portion of muscle tissue, and the averaged value was subtracted from velocity values over the entire image. For each node on the inlet/outlet boundaries, velocity values were linearly interpolated (over time) between all PCMR data time points to construct the velocity waveform over the pulse cycle for the individual node. The velocity waveforms at all computational nodes across the CC inlet and EC outlet faces defined the velocity boundary conditions on those faces. The resulting time-varying volumetric flow across the CC inlet and IC and EC outlet faces is shown in Fig. 2.
Figure 2.
Flow rate (m3/s) over time at the common carotid (CC) inlet, internal carotid (IC) outlet, and external carotid (EC) outlet.
Idealized velocity distribution
Time-varying, fully-developed velocity profiles were defined as CC inflow and EC outflow boundary conditions for Simulation 2. Given the relationship between volumetric flow waveform and axial velocity in fully-developed, pulsatile flow through a straight, rigid tube [17] the CC and EC volumetric flow waveforms of Simulation 1 (Fig. 2) were decomposed into axisymmetric, time-varying velocity profiles. The calculated velocity profiles were registered with the inlet/outlet faces, and the time-varying velocity profiles were determined and applied at each computational node on the CC inlet and EC outlet faces.
Simulation details
Computational simulations were conducted using the commercially available finite element code, FIDAP (Fluent, Inc.) parallelized across two 450 MHz processors of a Sun Ultra 80 UPA/PCI [with four 450MHz UltraSPARC-II processors] (Sun Microsystems, Inc.). The rigid wall assumption was used for both simulations, and the fluid was assumed Newtonian with parameters chosen for consistency with blood values (ρ=1053 kg/m3, μ=0.00368 N-s/m2). In both simulations the no-slip boundary condition was applied at the wall, and the IC outlet was defined as traction-free.
To initiate the unsteady computations, a steady state simulation with boundary conditions from the initial PCMR data time point was run to convergence. The unsteady simulation for the pulse cycle was started from this steady state result. Both simulations contained more than 500 time steps over the course of a 0.811 s pulse cycle. At the CC inlet the time-averaged Reynolds number is 790 and the Womersley parameter, α=3.4.
Comparison and Analysis
Simulation results were visualized with TECPLOT (Tecplot, Inc.). The axial direction is defined as the z-direction of the MR coordinate system, which was aligned with the axial direction of the CC. Axial velocity contours, instantaneous maximum axial velocity values (Vmax), negative axial velocity regions (NAVR), and average axial WSS are compared between the two simulations. The instantaneous Vmax is defined as the maximum axial velocity value in a given plane at a given time. Instantaneous Vmax values from both simulations are compared to PCMR measured values at the same axial location and time. An NAVR is defined as an area where instantaneous axial velocity is less than or equal to zero.
RESULTS
To determine the impact of velocity boundary conditions on velocity distributions in a subject-specific model, axial velocity contours, Vmax, NAVR, and average axial WSS are compared between Simulation 1 and Simulation 2. Because of the tremendous amount of data available from computational simulations, representative data are presented for initial systolic acceleration (t1), the time point immediately prior to peak systole (t2), initial systolic deceleration (t3), mid-systolic deceleration (t4), minimum flow rate (t5), and mid-diastole (t6) (Fig. 2).
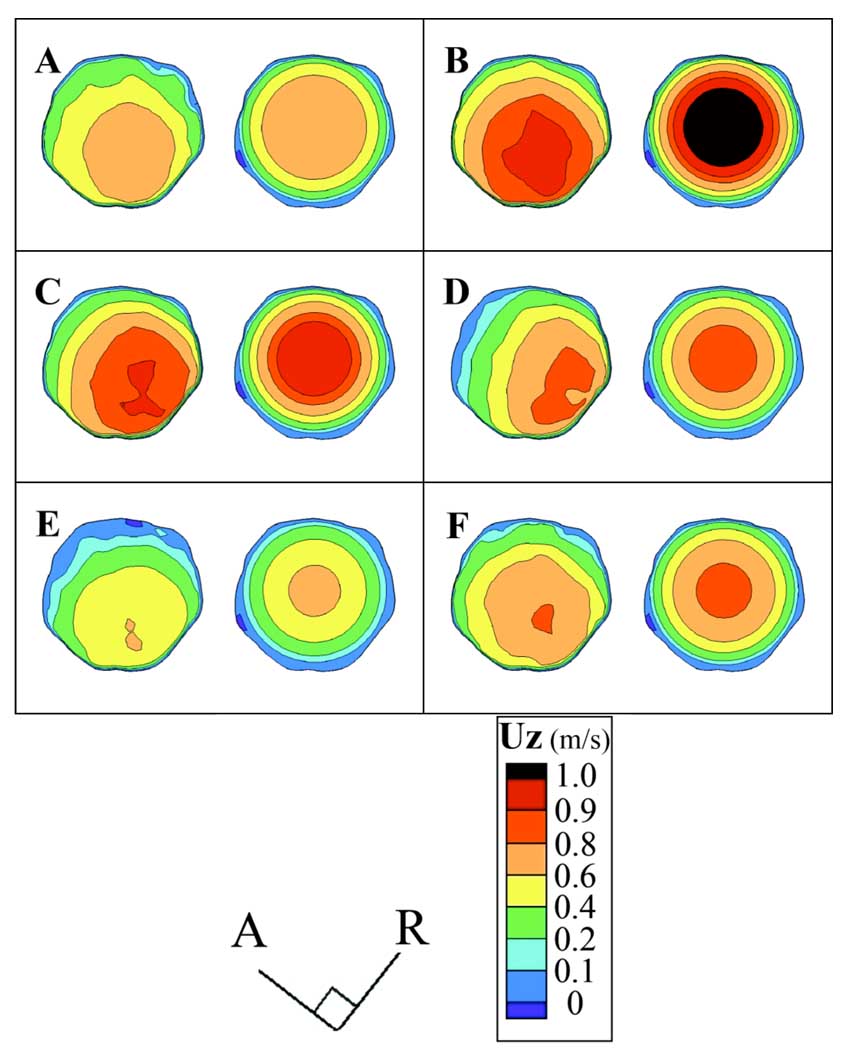
Differences between the inlet velocity distributions of the two simulations are readily apparent at each time point (Fig. 3). In Simulation 1, the location of the high velocity region varies with time, while by definition the inlet velocity profile in Simulation 2 is axisymmetric and the peak velocity is in the center of the CC inlet plane, as described by Hale et al. [18]. In Simulation 1 the maximum velocity area skews towards the posterior side of the bifurcation (Fig. 1B, Fig. 3) and the direction from which the IC originates (Fig. 3D).
Figure 3.
Axial velocity (UZ) (m/s) contours for Slice 1 at the model inlet over several time points: A) initial systolic acceleration (t1), B) immediately prior to peak systole (t2), C) initial systolic deceleration (t3), D) mid-systolic deceleration (t4), E) minimum flow rate (t5), and F) mid-diastole (t6). Within each panel the left figure is from Simulation 1, and the right is from Simulation 2.
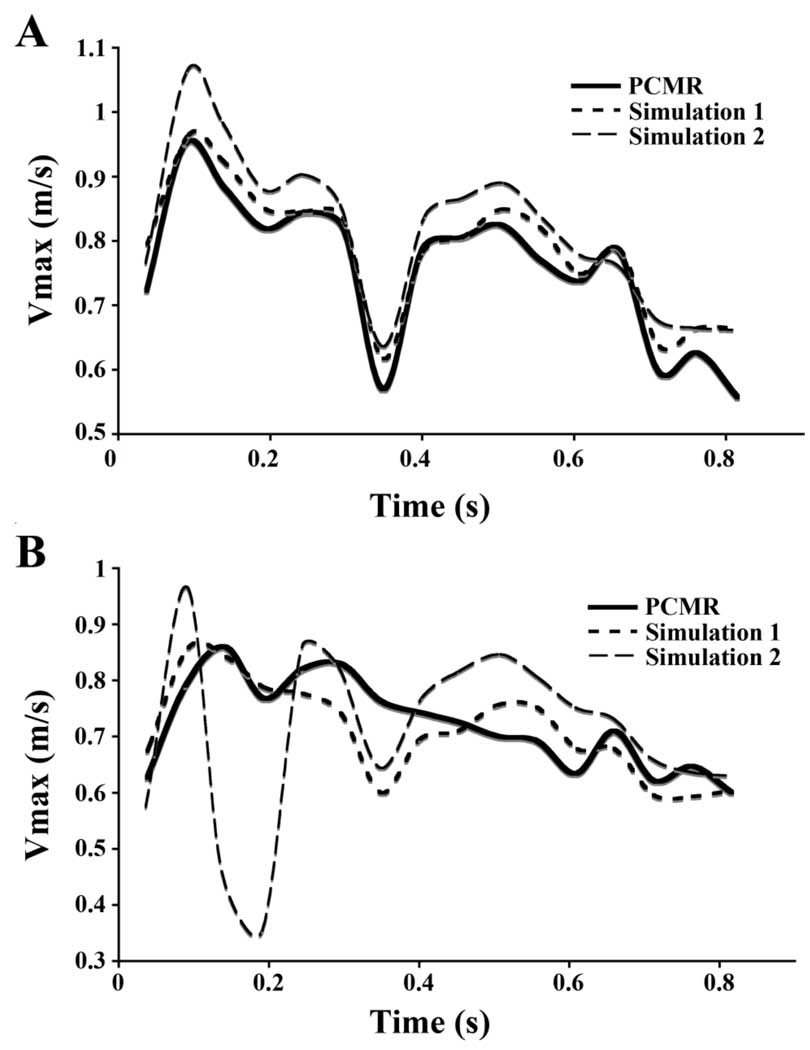
The Vmax at the inlet and comparison planes for both simulations are compared to the PCMR-measured Vmax at the same slice location and time (Fig. 4). By definition of boundary conditions, Vmax values in Simulation 1 compare favorably to the PCMR-measured Vmax values across the CC inlet (Fig. 4A), with differences attributed to interpolation of velocity values between grid nodes and to application of the no-slip boundary condition at the rigid walls of the model. Simulation 2 overestimates Vmax over the majority of the pulse cycle by an average of 9%.
Figure 4.
Maximum axial velocities (Vmax) (m/s) at A) Slice 1, and B) Slice 2 locations.
At the comparison plane, Slice 2, Simulation 1 more accurately estimates Vmax over time than Simulation 2 (Fig. 4B). The time-averaged difference between calculated and measured maximum axial velocities is 7% in Simulation 1, which is approximately half that for Simulation 2 (15%). The largest discrepancy at an individual time point (54%), occurs in Simulation 2 in systolic deceleration.
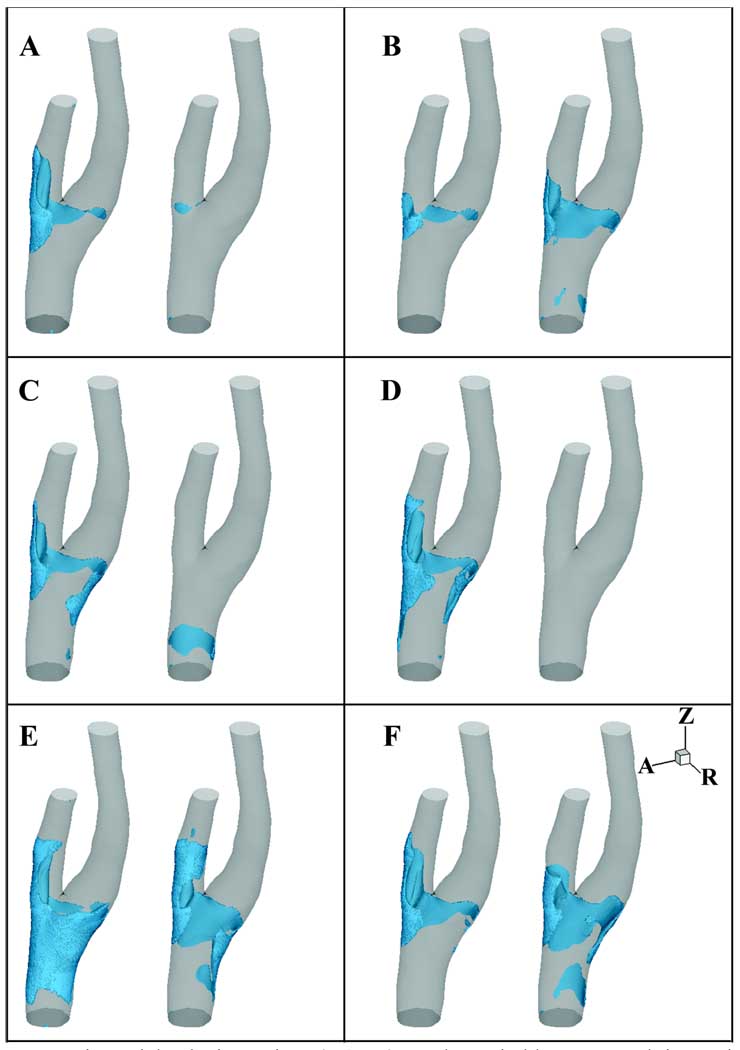
In both models, NAVRs vary spatially and temporally (Fig. 5). The position, size, and intrusion into the lumen of the NAVR vary significantly between the two simulations at any given time point, and the transient regions of reverse flow migrate in each simulation over time. The temporally varying NAVR in Simulation 1 predominantly resides in the EC with some extension across the bifurcation to the outer wall of the IC sinus. In contrast, in Simulation 2 several time points demonstrate NAVRs extending from the EC across the medial side of the bifurcation and curling to the outside wall of the proximal IC sinus, but the region of negative axial flow varies dramatically over time in Simulation 2 with little to no near wall negative flow at select time points (Fig. 5A, C, D).
Figure 5.
Negative axial velocity regions (NAVR) are shown in blue at several time points: A) initial systolic acceleration (t1), B) immediately prior to peak systole (t2), C) initial systolic deceleration (t3), D) mid-systolic deceleration (t4), E) minimum flow rate (t5), and F) mid-diastole (t6). Within each panel the left figure is from Simulation 1, and the right is from Simulation 2.
Just prior to peak systole, NAVRs are observed in both models; this is the smallest region of reversed axial flow for Simulation 1 (Fig. 5B). During systolic deceleration (t3, t4) large regions of negative axial velocities are seen in Simulation 1 which are not present in Simulation 2 (Fig. 5C, D). At t1, t3, and t4 there is little if any negative axial flow in Simulation 2 (Fig. 5A, C, D).
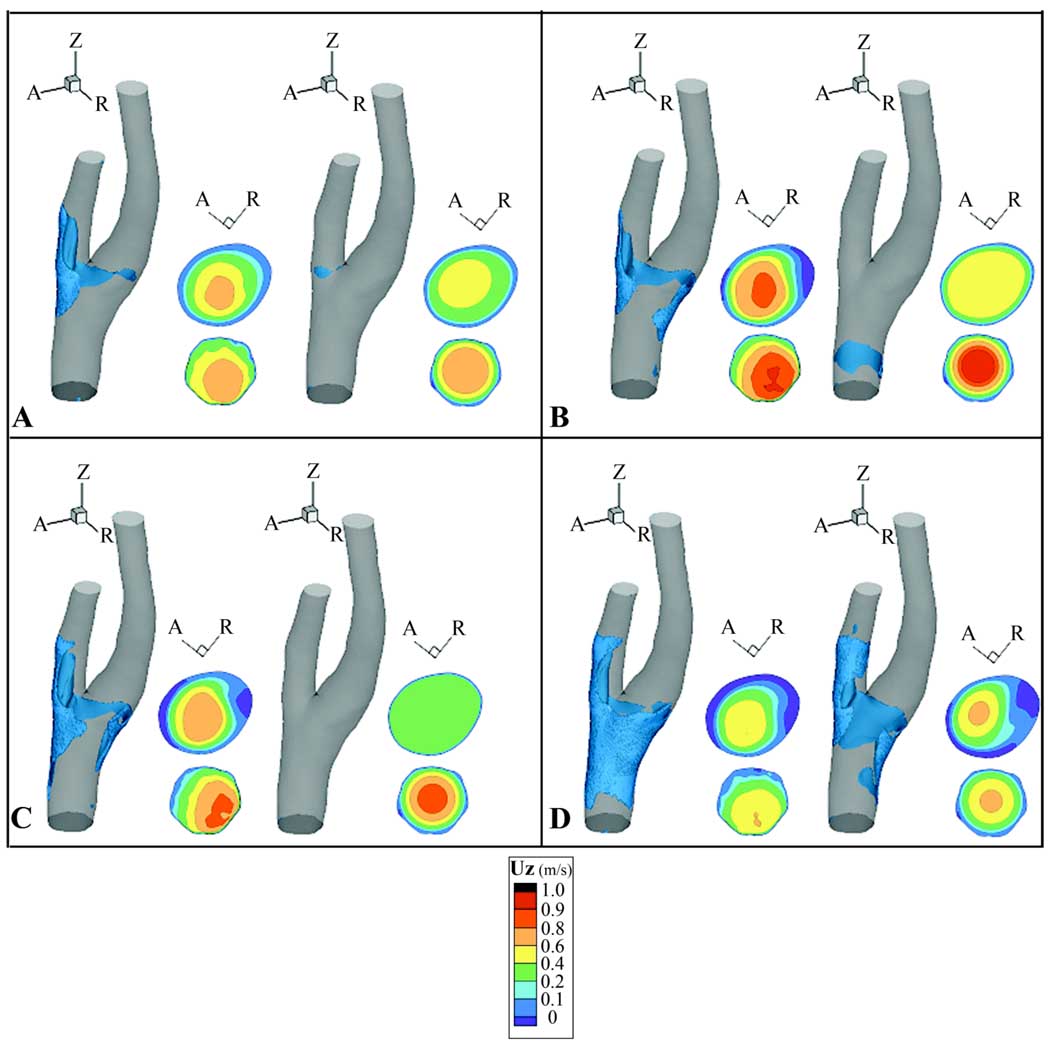
Velocity contours at the Slice 2 location reflect and contribute to NAVRs. At the Slice 2 location Simulation 1 contours exhibit peaks roughly aligned with the flow divider (Fig. 6). Throughout systolic deceleration Simulation 2 exhibits a flattened velocity profile not demonstrated in Simulation 1 (Fig. 6B, C). In both simulations the NAVR encompasses the maximum extent around the lumen circumference at the minimum flow rate, t5 (Fig. 6D). At mid-diastole the velocity distributions are similar between the two simulations, but the bifurcation region in Simulation 1 demonstrates a smaller span of near wall negative velocities than is present in Simulation 2 (Fig. 5F).
Figure 6.
Negative axial velocity regions (NAVR) and axial velocity (UZ) (m/s) contours at several time points: A) initial systolic acceleration (t1), B) initial systolic deceleration (t3), C) mid-systolic deceleration (t4), and D) minimum flow rate (t5). Axial velocity contours (viewed from proximal direction) at Slice 2 (top) and Slice 1 (bottom) are shown to the right of NAVR at each time point. Within each panel, the left set of figures is from Simulation 1, and the right is from Simulation 2.
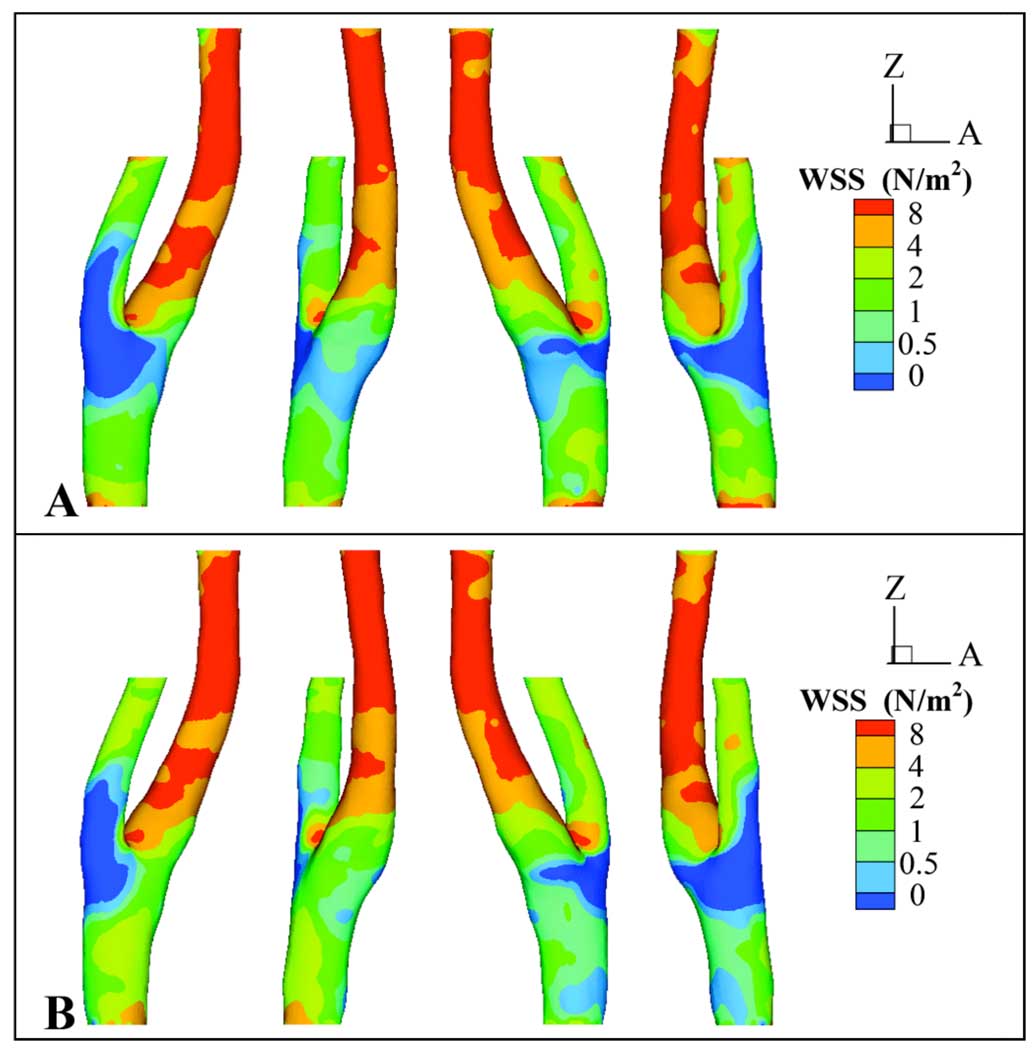
Axial WSS values for each simulation were averaged over the 16 time points at which PCMR data were acquired at Slice 1 and Slice 2, and the average WSS distributions are qualitatively similar in both simulations (Fig. 7). In both models an area of locally high WSS resides at the bifurcation apex. Globally, areas of low average WSS (WSS ≤1 N/m2) are similar between the two models, extending from the EC across the bifurcation region to the IC sinus, but the region of WSS ≤1 N/m2 extends proximally in Simulation 2 to the CC inlet. Simulation 1 demonstrates a larger span of average WSS ≤0.5 N/m2 than Simulation 2. This region of average WSS ≤0.5 N/m2 encircles the bifurcation region, including the proximal IC sinus.
Figure 7.
Four different views (at 90-degree increments) of time-averaged axial wall shear stress (WSS) (N/m2) for A) Simulation 1 and B) Simulation 2.
DISCUSSION
By isolating the contribution of velocity inlet distributions to flow details in a subject-specific model of the human carotid bifurcation, we were able to identify the impact of velocity boundary conditions on pathophysiologically relevant flow characteristics. For Simulation 1 the inlet velocity profile is skewed more towards the posterior side of the bifurcation region than the axisymmetric velocity distribution of Simulation 2, but at the Slice 2 location the Simulation 1 velocity peak is roughly aligned with the bifurcation apex. The combination of the flow rate and the location of the velocity peak with respect to subject specific geometry (especially, the bifurcation apex location) influences the NAVRs. Further, the skewing of the inlet velocity profiles in concert with the departure angle of the IC (with respect to the CC axial direction) affect the average WSS distribution in the CC and bifurcation regions. The variation between the simulations with respect to location and time dependence of NAVRs and the average WSS distributions are discussed below.
In the present subject-specific geometry both simulations exhibited fluctuating regions of reversed flow in the EC. Typically, negative flow is reported at the outer wall of the IC-CC junction; however, in vitro [2] and computational [9, 19] studies of idealized and individual geometries report reversed flow at other locations including the EC and the side walls of the bifurcation. These studies attributed reversed flow location differences to volumetric flow division between the daughter branches and to the geometry of the bifurcation [2, 9]. Flow visualization studies in a large-scale, averaged, human carotid bifurcation model showed no negative flow regions at the EC-CC junction for EC flow greater than or equal to 30% of the total outflow, but reversed flow developed in the EC-CC junction at flow rates less than or equal to 20% of the total outflow [2]. The outflow through the EC of the current model varied over the pulse cycle between approximately 5–25% of the total outflow (Fig. 2); given the findings of Bharadvaj et al. [2], the development of NAVR in the EC is not surprising.
Further, although separation in the large-scale model occurred at the IC-CC junction for IC flow up to 90% of the total outflow, this phenomenon is attributed to the adverse pressure gradient due to the IC sinus geometry contributing to separation [1, 2]. Velocity distributions, particularly with respect to the bifurcation apex location, affect NAVR formation. In the current model the apex of the flow divider is not centered with respect to the CC inlet, and the EC continues roughly along the same direction as the CC (though with a smaller cross-sectional area); whereas the IC sinus branches off from the CC (Fig. 1B). In the large-scale in vitro carotid artery model studies the bifurcation apex is symmetrical with respect to the CC inlet [1–4, 20]. Since the bifurcation and sinus shape of the present subject-specific, carotid bifurcation geometry varies considerably from that of the large scale, averaged carotid artery model, the geometry-induced adverse pressure gradient, and consequently the extent of reversed flow in the IC, also varies between the subject-specific and averaged models.
Geometry, outflow division, and inlet velocity profile contribute to the environment producing near wall negative flow, and the combination of these factors can overcome the effect of bulk fluid acceleration/deceleration on NAVRs. Systolic acceleration is an unexpected time for flow separation in the absence of other factors, but NAVRs develop just prior to peak systole in both simulations (Fig. 5B). In these simulations, peak systole coincides with the maximum percentage of flow through the EC (approximately 25% of total outflow). In Simulation 1, maximum percentage of outflow through the EC coincides with the smallest NAVR in the EC, a result which agrees with the negative correlation between percentage outflow through a daughter branch and extent of reversed flow in that branch [2]. Further, although deceleration of flow can cause flow separation and reversal, there exists no separation in the bifurcation region of Simulation 2 during systolic deceleration (t3, t4) (Fig. 5C, D). The velocity distribution at the Slice 1 location, with respect to the bifurcation geometry, contributes to the development and suppression of zones of near-wall negative axial velocity downstream. At the CC inlet Vmax in Simulation 1 is less than that of Simulation 2; however, at Slice 2 Vmax in Simulation 1 is greater than that of Simulation 2 for initial systolic acceleration (t1) and during systolic deceleration (t3, t4). This change in the relative maximum velocities between the simulations is manifested as a rapid flattening of the velocity profile in Simulation 2 as it progresses distally (Fig. 4, Fig. 6A, B, C). In particular Simulation 2 velocities at the Slice 2 location are more evenly distributed during deceleration than during acceleration (Fig. 6A, B, C). At these time points there exist NAVRs in Simulation 1, but there is almost no negative flow in Simulation 2. The flattened velocity profile of Simulation 2 illustrates a more even distribution of momentum across the bifurcation at the Slice 2 location, hindering the development of near-wall negative axial velocity zones.
Although the average axial WSS distributions are qualitatively similar for the measured and idealized velocity boundary conditions, the most notable difference in WSS patterns between the two simulations is that Simulation 1 exhibits more symmetrical WSS distributions in the CC and bifurcation region than in Simulation 2. In the current study, the geometries are identical; only the velocity boundary conditions vary between the two simulations. The combination of the location of the velocity peak with respect to subject-specific geometry (especially, the bifurcation apex location) and flow rate influences the regions of near-wall negative flow and consequently average axial WSS patterns. At the CC inlet Simulation 1 velocity profiles are skewed more towards the posterior side of the bifurcation from which the IC sinus expands than those of Simulation 2; however, over the pulse cycle velocity profiles at Slice 2 are rather central (Fig. 3, Fig. 6). This shift in peak velocity location with respect to the lumen is in part due to the lateral expansion of the CC at the Slice 2 location (a result of the angle of departure of the IC) relative to the proximal CC (Fig. 1B). Further, the flattened velocity profile of Simulation 2 (Fig 6. ABC) hinders development of instantaneous NAVR and decreases instantaneous negative wall shear stress values, resulting in an increase of time-averaged WSS reflected in the extent of the WSS ≤0.5 N/m2 region encircling the bifurcation (Figure 7). Consequently the bifurcation geometry, particularly the angle at which the IC departs from the CC axial direction, and the inlet velocity profile affect the WSS distribution in the current models.
Milner et al. [11] implicate geometry as the dominant factor in WSS distributions in CFD models constructed from MR-measured geometry and flow rate data. Moyle et al. [13] observe that the proximal CC geometry influences how “fully developed” flow will be in the carotid bifurcation model and conclude that WSS distributions were affected by non-axisymmetric flow (induced by helical entrance lengths) much less than by intra-subject geometric differences, which were due to scanning reproducibility and vessel reconstruction in patients with evidence of plaque [10]. It has been shown that proximal CC geometry varies between subjects and varies with vessel orientation of the same subject in subsequent scans [10, 13]. This inter- and intra- subject variability of geometric parameters (e.g., CC tortuosity and bifurcation angle) in older subjects with evidence of plaque is greater than those of younger patients [21] and is important to note when comparing studies on young, normal subjects (e.g., in this study) and elderly subjects with evidence of disease (e.g., [10, 13]). However, in this study the differences between the simulations of both Vmax and velocity distributions at the Slice 2 location (Fig. 4B, Fig. 6) demonstrate distinct local fluid flow patterns when different velocity boundary conditions are applied at the proximal common carotid. It is not asserted here that velocity boundary conditions affect flow phenomena more than geometry and flow division, rather that the three factors synergistically impact flow patterns. The current simulations demonstrate the feasibility of applying in-vivo measured velocity profiles without adding artificial entrance lengths to models, and they isolate the effect of axisymmetric and in vivo measured velocity boundary conditions (temporally-varying, natural velocity distributions not necessarily in the spectrum of asymmetry studied by Moyle et al. [13]) on hemodynamics in a subject specific carotid bifurcation model.
Since reverse flow and low/oscillating WSS correlate with atherosclerosis development in the carotid artery bifurcation [1, 2], it is important to assess the accuracy of the models and the impact of modeling assumptions on the results. Although both simulations overestimate velocities for the majority of the cycle compared to PCMR data at the inlet plane, Vmax is more accurately represented in Simulation 1 than in Simulation 2. Comparison with PCMR data at Slice 2 reveals that a model with measured inlet velocity distribution better predicts maximum axial velocity at a distal location than a model with idealized velocity profiles (Fig. 4B). Our results are consistent with the aorto-iliac bifurcation simulations of Long et al. [22], who showed that an MR-based simulation generally overestimated velocities compared to measured values. As discussed, flattening of the velocity profile inhibits NAVR development. Given this relationship between Vmax and NAVR and the correlation of reversed flow with plaque development [2] we conclude that a simulation which better predicts downstream peak velocities (in this study: Simulation 1 which is based on in vivo measured velocity distributions) is preferred for modeling hemodynamics in subject-specific carotid artery bifurcation models when studying atherosclerosis initiation and development.
Basic modeling assumptions of the flow field also influence NAVRs in computational simulations. Major assumptions in this model are (1) omission of smaller vessels and (2) the rigid wall assumption. Bharadvaj et al. [2] reported that under in vivo conditions the superior thyroid artery (not included in the present model) pulls slow-moving blood from the EC, reducing separation at the EC-CC junction. Inclusion of the superior thyroid artery in the current model is expected to decrease the extent of NAVR in the EC and potentially increase NAVR in the IC; however, the effect would be largely conserved between the two models, thus not altering our conclusions about the influence of velocity boundary conditions. In this model vessel walls are assumed rigid, but comparisons are made to PCMR data of real, compliant arteries; hence, it is important to consider the potential effects of compliant walls on the simulations when interpreting results. Previous in vitro experiments [20] and computational simulations [9, 19] of large-scale, averaged models and individual carotid bifurcation geometries demonstrate that zones of negative or near zero velocity begin more proximally, are larger, and persist longer in compliant models than in rigid models. Inclusion of compliance in a carotid bifurcation model reduces the magnitude of instantaneous WSS values [20] and decreases mean WSS by 25–30% for computational [19] and experimental [20] studies. Thus, we expect inclusion of compliance in the current model would cause the NAVRs in both simulations to expand and to remain for longer periods of time and would consequently cause a decrease in average WSS. In addition the rigid wall assumption potentially contributes to the discrepancy between measured and simulated values of Vmax: in vivo, arteries expand with an increase in volumetric flow; however, the simulations use the rigid wall assumption. Therefore, if the flux is the same in vivo as it is in the model and the in vivo lumen area increases, the PCMR-measured Vmax is expected to be lower than the computed values.
In conclusion, developing models with in vivo measured geometry and flow data and comparing the effects of measured versus idealized velocity distributions on blood flow patterns reveals that the velocity distribution at boundary conditions influences physiologically relevant flow patterns in subject-specific models of the human carotid bifurcation. This study isolates the effect of velocity boundary conditions on the flow field and demonstrates the feasibility of applying PCMR-measured velocity profiles as boundary conditions without the time and computational expense of adding artificial entrance lengths to the models. Although mean WSS distributions are qualitatively similar, instantaneous NAVRs (and we can infer instantaneous WSS and consequently oscillating WSS) differ between the two simulations. It is important and feasible to use the most physiologically representative boundary conditions given the correlation of oscillating WSS and local regions of reversed flow with atherosclerosis [1,2]. Although a single subject is insufficient for establishing a correlation between disease and fluid mechanics, it does demonstrate the influence of velocity distributions in otherwise identical simulations. For future investigations of carotid hemodynamics it is recommended to consider the temporal intra-subject variability. A study based on a single in vivo measurement of geometry and flow data gives a “snapshot” of the instantaneous hemodynamic condition; however, geometry and flow vary with a number of factors across days and over a lifetime. Longitudinal studies averaging subject-specific (geometry, flow, and velocity distribution) models of individuals over time may better elucidate the relationship between hemodynamics and atherosclerosis initiation and progression.
ACKNOWLEDGEMENTS
The authors would like to thank Marc Niethammer and James Costello for granting use of their programs. This research was supported by a National Science Foundation Graduate Research Fellowship [AKW]; a Medtronic Foundation Fellowship [AKW]; the Georgia Research Alliance [DPG]; NIH (NAC P41 RR-13218) through Brigham and Women's Hospital [ART]; and the National Institutes of Health through the NIH Roadmap for Medical Research (Grant U54 EB005149) [ART] as part of the National Alliance for Medical Image Computing (NAMIC). Information on the National Centers for Biomedical Computing can be obtained from http://nihroadmap.nih.gov/bioinformatics.
Contributor Information
Amanda K. Wake, Wallace H. Coulter Department of Biomedical Engineering, Georgia Institute of Technology and Emory University; Currently: Vanderbilt University Institute of Imaging Science, Vanderbilt University, 1161 21st Avenue South, Medical Center North, AA-1105, Nashville, TN 37232-2310, Tel: 205.568.7221, amanda.wake@vanderbilt.edu.
John N. Oshinski, Wallace H. Coulter Department of Biomedical Engineering, Georgia Institute of Technology and Emory University; Department of Radiology, Emory University, Atlanta, GA 30332, Tel: 404.727.5894, Fax: 404.712.5948, jnoshin@emory.edu.
Allen R. Tannenbaum, Wallace H. Coulter Department of Biomedical Engineering, Georgia Institute of Technology and Emory University School of Electrical and Computer Engineering, Georgia Institute of Technology, Room 4102, 777 Atlantic Drive, Atlanta, GA 30332-0250, Tel: 404.894.7582, Fax: 404.894.7583, tannenba@ece.gatech.edu.
Don P. Giddens, Wallace H. Coulter Department of Biomedical Engineering, Georgia Institute of Technology and Emory University, Administrative Building, Third Floor, 225 North Avenue, Atlanta, GA 30332-0360, Tel: 404.894.6825, Fax: 404.894.0168, don.giddens@coe.gatech.edu.
REFERENCES
- 1.Ku DN, Giddens DP, Zarins CK, Glagov S. Pulsatile Flow and Atherosclerosis in the Human Carotid Bifurcation: Positive Correlation Between Plaque Location and Low and Oscillating Shear Stress. Arteriosclerosis. 1985;5:293–302. doi: 10.1161/01.atv.5.3.293. [DOI] [PubMed] [Google Scholar]
- 2.Bharadvaj BK, Mabon RF, Giddens DP. Steady Flow in a Model of the Human Carotid Bifurcation. Part I—Flow Visualization. Journal of Biomechanics. 1982;15:349–362. doi: 10.1016/0021-9290(82)90057-4. [DOI] [PubMed] [Google Scholar]
- 3.Balasubramanian K. Ph.D. thesis. Atlanta, GA: Georgia Institute of Technology; 1979. An Experimental Investigation of Steady Flow at an Arterial Bifurcation. [Google Scholar]
- 4.Ku DN. Ph.D. thesis. Atlanta, GA: Georgia Institute of Technology; 1983. Hemodynamics and Atherogenesis at the Human Carotid Bifurcation. [Google Scholar]
- 5.Tang D, Yang C, Kobayashi S, Ku DN. Effect of a Lipid Pool on Stress/Strain Distributions in Stenotic Arteries: 3-D Fluid-Structure Interactions (FSI) Models. Journal of Biomechanical Engineering. 2004;126:363–370. doi: 10.1115/1.1762898. [DOI] [PubMed] [Google Scholar]
- 6.Steinman DA. Image-Based Computational Fluid Dynamics Modeling in Realistic Arterial Geometries. Annals of Biomedical Engineering. 2002;30:483–497. doi: 10.1114/1.1467679. [DOI] [PubMed] [Google Scholar]
- 7.Moore JA, Steinman DA, Holdsworth DW, Ethier CR. Accuracy of Computational Hemodynamics in Complex Arterial Geometries Reconstructed from Magnetic Resonance Imaging. Annals of Biomedical Engineering. 1999;27:32–41. doi: 10.1114/1.163. [DOI] [PubMed] [Google Scholar]
- 8.Moore JA, Steinman DA, Ethier CR. Computational Blood Flow Modeling: Errors Associated with Reconstructing Finite Element Models from Magnetic Resonance Images. Journal of Biomechanics. 1998;31:179–184. doi: 10.1016/s0021-9290(97)00125-5. [DOI] [PubMed] [Google Scholar]
- 9.Zhao SZ, Xu XY, Hughes AD, Thom SA, Stanton AV, Ariff B, Long Q. Blood Flow and Vessel Mechanics in a Physiologically Realistic Model of a Human Carotid Artery Bifurcation. Journal of Biomechanics. 2000;33:975–984. doi: 10.1016/s0021-9290(00)00043-9. [DOI] [PubMed] [Google Scholar]
- 10.Thomas JB, Milner JS, Rutt BK, Steinman DA. Reproducibility of Image-Based Computational Fluid Dynamics Models of the Human Carotid Bifurcation. Annals of Biomedical Engineering. 2003;31:132–141. doi: 10.1114/1.1540102. [DOI] [PubMed] [Google Scholar]
- 11.Milner JS, Moore JA, Rutt BK, Steinman DA. Hemodynamics of Human Carotid Artery Bifurcations: Computational Studies with Models Reconstructed from Magnetic Resonance Imaging of Normal Subjects. Journal of Vascular Surgery. 1998;27:143–156. doi: 10.1016/s0741-5214(98)70210-1. [DOI] [PubMed] [Google Scholar]
- 12.Glor FP, Ariff B, Hughes AD, Verdonck PR, Barratt DC, Augst AD, Thom SAM, Xu XY. Influence of Head Position on Carotid Hemodynamics in Young Adults. American Journal of Physiology: Heart and Circulation Physiology. 2004;287:H1670–H1681. doi: 10.1152/ajpheart.01186.2003. [DOI] [PubMed] [Google Scholar]
- 13.Moyle KR, Antiga L, Steinman DA. Inlet Conditions for Image-Based CFD Models of the Carotid Bifurcation: Is It Reasonable to Assume Fully Developed Flow? Journal of Biomechanical Engineering. 2006;128:371–379. doi: 10.1115/1.2187035. [DOI] [PubMed] [Google Scholar]
- 14.Kichenassamy S, Kumar A, Olver P, Tannenbaum A, Yezzi T., Jr Conformal Curvature Flows: From Phase Transitions to Active Vision. Archives of Rational Mechanical Analysis. 1996;134:275–301. [Google Scholar]
- 15.Caro CG, Dumoulin CL, Graham JMR, Parker KH, Souza SP. Secondary Flow in the Human Carotid Artery Imaged by MR Angiography. Journal of Biomechanical Engineering. 1992;114:147–149. doi: 10.1115/1.2895439. [DOI] [PubMed] [Google Scholar]
- 16.Costello JR. Ph.D. thesis. Atlanta, GA: Georgia Institute of Technology; 2004. The Effect of Material Properties and Hemodynamics on Healing of Vascular Grafts in Baboons. [Google Scholar]
- 17.Womersley JR. Method for the Calculation of Velocity, Rate of Flow and Viscous Drag in Arteries When the Pressure Gradient Is Known. Journal of Physiology. 1955;127:553–563. doi: 10.1113/jphysiol.1955.sp005276. [DOI] [PMC free article] [PubMed] [Google Scholar]
- 18.Hale JF, McDonald DA, Womersley JR. Velocity Profiles of Oscillating Arterial Flow, with Some Calculations of Viscous Drag and the Reynolds Number. Journal of Physiology. 1955;128:629–640. doi: 10.1113/jphysiol.1955.sp005330. [DOI] [PMC free article] [PubMed] [Google Scholar]
- 19.Perktold K, Rappitsch G. Computer Simulation of Local Blood Flow and Vessel Mechanics in a Compliant Carotid Artery Bifurcation Model. Journal of Biomechanics. 1995;28:845–856. doi: 10.1016/0021-9290(95)95273-8. [DOI] [PubMed] [Google Scholar]
- 20.Anayiotos AS, Jones SA, Giddens DP, Glagov S, Zarins CK. Shear Stress at a Compliant Model of the Human Carotid Bifurcation. Journal of Biomechanical Engineering. 1994;116:98–106. doi: 10.1115/1.2895710. [DOI] [PubMed] [Google Scholar]
- 21.Thomas JB, Antiga L, Che SL, Milner JS, Hanagan Steinman DA, Spence JD, Rutt BK, Steinman DA. Variation in the Carotid Bifurcation Geometry of Young Versus Older Adults: Implications for Geometric Risk of Atherosclerosis. Stroke. 2005;36:2450–2456. doi: 10.1161/01.STR.0000185679.62634.0a. [DOI] [PubMed] [Google Scholar]
- 22.Long A, Xu XY, Bourne M, Griffith TM. Numerical Study of Blood Flow in an Anatomically Realistic Aorto-Iliac Bifurcation Generated From MRI Data. Magnetic Resonance in Medicine. 2000;43:565–576. doi: 10.1002/(sici)1522-2594(200004)43:4<565::aid-mrm11>3.0.co;2-l. [DOI] [PubMed] [Google Scholar]


