Abstract
The intestinal Menkes copper Atpase (Atp7a) gene is strongly induced by iron deficiency in the rat intestine. We sought to develop an in vitro model to understand the mechanism of this induction by performing molecular studies in native rat intestine and in intestinal epithelial (IEC-6) cells. IEC-6 cells express Atp7a, and induction was noted with iron deprivation. 5′ Rapid amplification of cDNA ends and PCR experiments revealed three splice variants in rat intestine and IEC-6 cells; all variants were strongly induced during iron deprivation (five- to sevenfold). The splice variants presumably encode proteins that would either contain the extreme NH2 terminus of the protein (containing copper binding domain 1) or not. We thus hypothesized that more than one version of Atp7a protein exists. Antibodies against this NH2-terminal region of the protein were developed (named N-term) and used along with previously reported antibodies (against more COOH-terminal regions, termed 54–10) to perform immunoblotting and immunolocalization studies. Results with the 54–10 antiserum revealed an Atp7a protein variant of ∼190 kDa that localized to the trans-Golgi network of IEC-6 cells and trafficked to the plasma membrane with copper loading. Using the N-term antiserum, however, we noted protein of ∼97 and 64 kDa. The 97-kDa protein was cytosolic and nuclear, whereas the 64-kDa protein was nuclear specific. Immunolocalization analyses with the N-term antiserum showed strong staining of nuclei in IEC-6 and Caco-2 cells and in rat intestine. We conclude that novel Atp7a protein variants may exist in rat and human intestinal epithelial cells, with different intracellular locations and potentially distinct physiological functions.
Keywords: intestine, iron
the menkes copper atpase (Atp7a) is a P-type ATPase that functions as a copper transporter in many tissues. Important for the synthesis of cuproenzymes and in cellular copper efflux, Atp7a traffics between the trans-Golgi network and the plasma membrane according to intracellular copper levels (22). Atp7a is expressed in intestinal epithelial cells (IECs), where it is important for copper efflux after dietary absorption. Copper is absorbed into IECs by copper transporter 1 (Ctr1), as evidenced by the fact that intestine-specific gene inactivation in mice leads to severe systemic copper deficiency (21). Another apical transporter, divalent metal transporter 1 (Dmt1), may also be involved in intestinal copper transport (1) although this concept remains controversial (18). The Atp7a gene is mutated in Menkes disease, a copper-deficiency disorder characterized by defective vectorial copper transport in the small intestinal epithelium with notable copper accumulation in enterocytes (4, 19, 29).
Previous studies documented strong induction of Atp7a mRNA and protein expression in the duodenal epithelium of iron-deficient rats (6, 8, 23). Immunolocalization studies with a polyclonal Atp7a antiserum detected the protein on the apical and basolateral membranes of intestinal epithelial cells during iron deprivation (23), a finding that is consistent with increased intracellular copper levels. Increased copper levels in the intestinal epithelium and in the liver could thus be explained by enhanced dietary absorption during iron deficiency. Copper is important for two proteins involved in iron homeostasis, hephaestin (Hp) (30) and ceruloplasmin (20); both proteins are multicopper ferroxidases. Hp is expressed in IECs, where it functions to oxidize transported iron for binding to transferrin. Hp is necessary for normal intestinal iron efflux, as evidenced by the iron-deficient phenotype of the sex-linked anemia (sla) mouse, which has an inactivating mutation in the Hp gene (30). Ceruloplasmin is a circulating, copper-binding protein that is important in iron release from some tissues, including the intestine, particularly during times of hematopoietic stress (5). These two copper-dependent proteins, at least in part, help explain the well-known interactions between iron and copper, which have been recognized since the 1800s (11).
In the present communication, we describe our efforts to develop an in vitro model to determine the molecular mechanism of Atp7a induction during iron deficiency. We first provide evidence that rat IEC-6 cells express Atp7a along with the major intestinal iron transporter, Dmt1, and that both genes are induced in iron-deprived cells. Further analyses suggest that the induction of Atp7a is transcriptionally mediated, a finding that led us to map the 5′ end of the Atp7a transcript. In doing so, we discovered that the transcript was differentially spliced at the 5′ end, perhaps leading to the production of different versions of the protein. Development and characterization of a second Atp7a-specific antiserum confirms the presence of protein variants that have different intracellular locations and presumably different cellular functions.
MATERIALS AND METHODS
qRT-PCR analysis of Atp7a and Dmt1 expression in the rat intestine.
All animal studies were reviewed and approved by the University at Buffalo IACUC. Male Sprague-Dawley rats were obtained at 3 wk of age and were placed in wire mesh bottom cages, 2–3 animals per cage. Rats were fed AIN-93G diets (Dyets, Bethlehem, PA) containing either 198 ppm or 3 ppm iron, essentially as previously described (8). When rats were ∼12 wk of age, they were euthanized, and mucosal scrapes were taken from ∼20 cm of the small intestine distal to the pyloric sphincter; this segment was called “duodenum”. The remaining small intestine was cut in half; the proximal portion was called “jejunum”, and the distal half was called “ileum”. Similarly, the colon was cut in half, and the first half after the small intestine was called “proximal colon”, the second half called “distal colon”. RNA was purified from mucosal scrapings with Trizol reagent (Invitrogen, Carlsbad, CA) and quantified by UV spectrophotometry. RNA samples were either fresh or stored in ethanol at −80°C until use. One microgram of RNA was reverse transcribed with reagents from Bio-Rad (Hercules, CA) as described (9). For analysis of 18S rRNA, a constitutive control gene, the RT reaction was diluted 1:100, and 1 μl was utilized in a 20-μl reaction with 10 μl of iQ Supermix (Bio-Rad), 2 μl TaqMan primer/probe mix (Applied Biosystems; assay ID Hs99999901_s1), and nuclease-free water. For analysis of Atp7a (Applied Biosystems; assay ID Rn00583815_m1), Dmt1 (Applied Biosystems; assay ID Rn00565927_m1), and Ctr1 (Applied Biosystems; assay ID Rn00683634_m1), 2 μl of undiluted RT reaction was used. Reactions were run in 96-well plates on a Bio-Rad iCycler with the following cycling parameters: 50°C for 2 min, 95°C for 8.5 min, and 42 cycles with 95°C for 30 s and 60°C for 1 min. Each RT reaction was analyzed in duplicate for 18S rRNA and Atp7a, Dmt1, or Ctr1 in each experiment. Then the 18S average was subtracted from the experimental gene average to generate the cycle threshold (Ct) value. Data were analyzed by routine methods. Briefly, ΔΔCt values from each gut segment were calculated from Atp7a, Dmt1, or Ctr1 Ct and 18S rRNA Ct for iron-deficient groups vs. control groups. The ΔΔCt was the exponent of 2 for mean fold induction; its standard deviation was the exponent of 2 as an estimate of range. Statistical analyses were done by t-test. Experiments were repeated multiple times with RNA samples derived from different groups of control and iron-deficient rats (3–5 animals per control and experimental group).
Development of an in vitro model to study Atp7a gene regulation by iron deprivation.
We next sought to determine whether Atp7a was expressed in rat IEC-6 cells because these cells have been described to be a suitable in vitro model of mammalian iron transport (28). IEC-6 cells were cultured under standard conditions (according to ATCC guidelines; www.atcc.org) in a humidified incubator in the presence of 5% CO2 at 37°C. Cells were grown in plastic culture flasks and studied when they had reached ∼80% confluence or at 15–16 days postconfluence. Cells were treated with 100 μM deferoxamine mesylate (Df; an iron chelator) or 200 μM ferric ammonium citrate (FAC) for 16 h before being harvested. These treatments were intended to maximize the differences in expression levels between iron transport-related genes, as previously described (14). For some experiments, cells were pretreated with actinomycin D (ActD; 1 μg/ml in DMSO) or vehicle only for 1 h before adding Df or FAC in the continued presence of ActD. RNA was purified from cells with Trizol reagent, and RNA was quantified and processed for qRT-PCR as described above. The same TaqMan primer/probes sets for 18S, Atp7a, and Dmt1 described above were used along with the same basic protocol.
Mapping the 5′ end of the rat Atp7a transcript.
To map the 5′ end of the mRNA molecule, we utilized a kit from Ambion (FirstChoice RLM-RACE; Austin, TX) to perform RNA ligase-mediated rapid amplification of cDNA ends (RACE), essentially following the manufacturer's recommended protocol. We did, however, design our own oligonucleotide primers on the basis of the adapter sequence provided with the kit and the 5′ end of the rat Atp7a transcript. Primers used are described in Supplemental Table S1. The Atp7a-specific primers bound within exon 3 of the rat Atp7a transcript (GenBank accession # NM_052803). The final PCR products were visualized by agarose gel electrophoresis and subcloned using a T/A cloning vector (Invitrogen). Cloned PCR products were sequenced utilizing vector-specific primers. Sequences were compared with various databases to align the sequences with known cDNAs (BLAST; http://www.ncbi.nlm.nih.gov) and genomic sequences (Rat BLAT; http://genome-mirror.duhs.duke.edu/cgi-bin/hgBlat). The sequences of the first four 5′ exons have been deposited in the GenBank with accession nos. FJ817345 (exon 1), FJ817346 (exon 1A), FJ817347 (exon 2) and FJ817348 (exon 3).
qRT-PCR studies of Atp7a splice variants in rat intestine and IEC-6 cells.
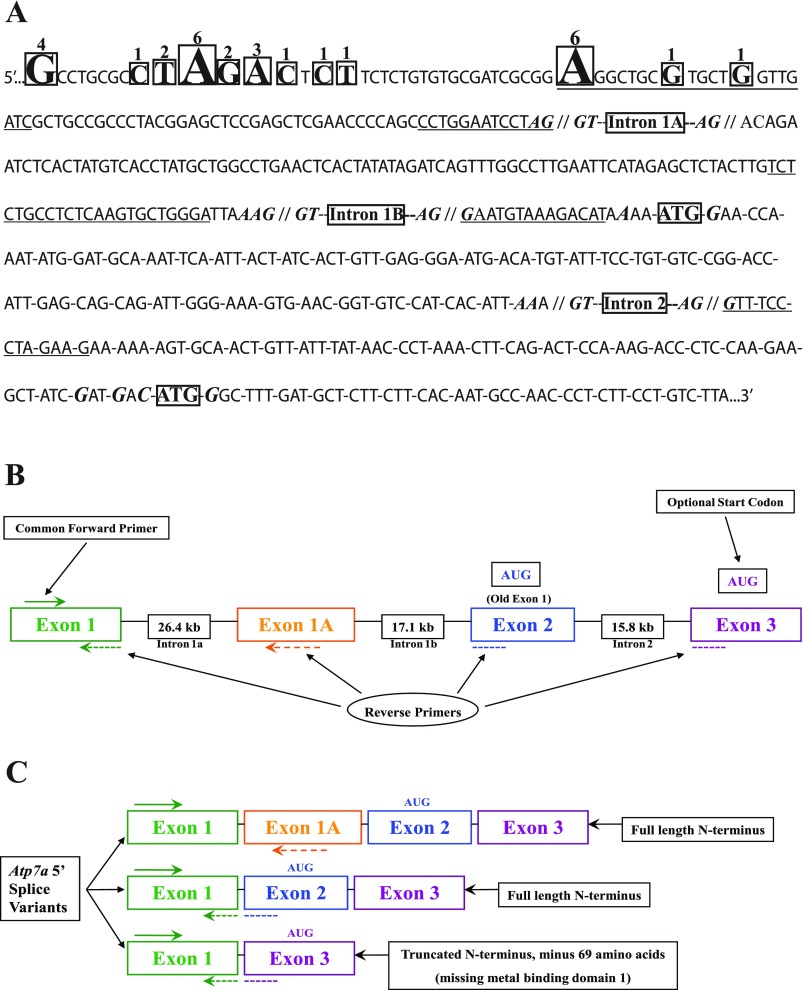
To verify the presence of the detected splice variants and to determine whether their levels were altered by iron deficiency, a real-time PCR strategy was devised (depicted graphically in Fig. 4). PCR primers were designed as follows: a forward primer was designed in rat Atp7a exon 1; a reverse primer was designed in rat Atp7a exon 1A; another reverse primer was designed that bound to the exon 1/exon 2 boundary; and a final reverse primer was designed that bound to the exon 1/exon 3 junction. All reverse primers were used in combination with the single forward primer in exon 1, and all primers were designed to have similar Tms. Another primer set was designed to amplify a product from exons 6 and 7 of the rat Atp7a transcript, which would presumably amplify all transcript variants (called Atp7a common primers). Primers that amplified 18S rRNA were utilized as constitutive controls, and all data from the experimental gene was normalized to 18S. The primer sequences are described in Supplemental Table S1. RNA was purified from control and iron-deficient rats (animal procedures are described above) and IEC-6 cells. RNA was converted to cDNA with the Bio-Rad iScript kit in a 20-μl reaction with 1 μg of RNA. Two microliters of the cDNA reaction was used with 10 μl of SYBR Green master mix (Bio-Rad) and 0.75 μl of each primer (3.33 μM each) in a 20-μl reaction. PCR cycling parameters were identical to those described above for the TaqMan real-time PCR studies, except a melt curve was performed after the 42 cycles of amplification. All PCR primers were designed to either target parts of two different exons or to span large introns; however, preliminary experiments were performed with and without DNAse treatment of the RNA (DNA-free kit; Ambion) to ensure that amplification was not occurring from genomic DNA. Standard curves were also performed initially with each primer set to demonstrate that the primers allowed accurate quantification of the templates. PCR products from all Atp7a primers amplified from rat intestinal mucosa and IEC-6 cells were subcloned and sequenced to ensure that the correct templates were indeed being amplified.
Fig. 4.
Sequence of the 5′ end of the rat Atp7a gene and schematic diagram of gene structure. A: gene sequence (including new exon 1, novel exon 1a, exon 2 and a portion of exon 3) starting from the 5′ end of the longest RACE clone obtained. Boxed nucleotides indicate the 5′ end most base of various clones and numbers over bases indicate the number of clones (out of 29 total) that began with that particular base. Underlined sequences are the bases that were targeted for PCR amplification. Bolded, italicized bases near the intron/exon boundaries indicate consensus splice site bases, whereas bolded, italicized bases near the ATG codons indicate consensus Kozak sequences. Introns are also indicated. B: gene structure and the relative location of PCR primers used to quantify the expression of the various transcript variants during iron deficiency. AUG, in-frame start codon. C: alternative transcripts and the potential protein variants that would be encoded by them.
We also designed primers to amplify the 5′ ends of the mouse and human Atp7a genes to determine whether alternative splice variants may also exist in these species. Our approach was to amplify from cDNAs derived from mouse and human intestine using primers that bound to exon 1 (forward primer) and exon 3 (reverse primer). Mouse intestinal RNA was purified from experimental animals, and human small intestinal RNA was purchased from Clontech (Palo Alto, CA). The primers used are described in Supplemental Table S1.
Further characterization of Atp7a antibodies and development of a new Atp7a antiserum.
We previously developed Atp7a antibodies by injecting two rabbits with two Atp7a-specific peptides (23). One peptide was from a predicted hydrophilic region of the protein immediately COOH terminal to the six copper-binding domains (AA no. 625–638, N-term KKDRSANHLDHKRE C-term; Accession no. NP_434690), and the other was from the COOH terminus (AA no. 1476–1492, N-term KHSLLVGDFREDDDTTL C-term). These peptides are highly conserved between rat, mouse, and human. Serum from one of two rabbits was used for initial experiments described previously (10) and for further studies reported in this communication. We called this antiserum “54–10”, for rabbit 54, 10-wk bleed. In the present studies, we have further utilized this antiserum for Western blotting experiments and immunocytochemical (ICC) and immunohistochemical (IHC) studies in rat intestine and IEC-6 cells.
We also sought to develop antibodies against the first 68 amino acids of the Atp7a protein because our RACE studies revealed the presence of an alternatively spliced version of the Atp7a transcript that would encode a protein missing the NH2-terminal 68 amino acids. We thus designed two peptides within this region (peptide 1: AA nos. 25–42, N-term TIEQQIGKVNGVHHIKVS C-term; peptide 2: AA nos. 54–68, N-term PKLQTPKTLQEAIDD C-term). These peptides are 100% conserved between rat, mouse, and human, and they do not show any significant homology to any other known proteins in these species. The peptides were coinjected into two rabbits, and the resulting serum from all immune bleeds from both rabbits was then affinity purified against the peptides (Open Biosystems, Huntsville, AL). The resulting affinity-purified material (called N-term antibodies) was utilized for studies presented in this article, including Western blotting, immunoprecipitation (IP), and IHC and ICC experiments.
ICC analyses.
IEC-6 and Caco-2 cells were grown under standard conditions on sterile cover slips placed in six-well culture dishes. When the cells were at the desired state of confluency (either just confluent or 16–19 days postconfluent), they were fixed in ice-cold methanol:acetone (1:1) for 10–15 min at −20°C and then rinsed with PBS. In some cases, the cells were stored for a few days in PBS at 4°C until antibody staining was performed. Subsequently, PBS was removed, and coverslips were covered with blocking reagent (IHC Blocking Reagent; Bethyl Laboratories, Montgomery, TX) for 30 min at room temperature, followed by a brief rinse in PBS. Coverslips were next reacted with primary antibody (54–10 or N-term) in PBS at 1:500 dilution for 1–2 h at room temperature, followed by a brief rinse in PBS (which occurred between all subsequent steps). In some experiments, we next reacted the fixed cells with Golgi 58K antiserum (also called Formiminotransferase Cyclodeaminase; Sigma, St. Louis, MO) at a 1:500 dilution for 30–60 min. Cells were next incubated with Sytox Green nucleic acid stain (Invitrogen; 6 μl/10 ml of PBS) for 5–10 min. Lastly, cells were incubated with fluorescent-tagged secondary antibodies (1:2,000) for 30 min, depending on the primary antibody(ies) used; for the Atp7a antiserum, we used Alexa Flour 647 goat anti-rabbit IgGs (Invitrogen), and for Golgi 58K we used Alexa Flour 568 goat anti-mouse IgGs. In double-labeling experiments, we reacted cells with both secondaries at the same time. Cover slips were then inverted onto a clean slide with a few drops of fluorescent mounting medium and allowed to dry. Cells were imaged in the Confocal and Flow Cytometry Facility in the School of Medicine and Biomedical Sciences at the University of Buffalo with a Zeiss LSM 510 Meta Confocal scan head mounted to an Axiovert 200 M inverted fluorescent microscope. Depending on the particular experiment, two or three laser lines and appropriate emission filters were used. Sytox Green was imaged with a 488-nm laser line, Golgi 58K with a 568-nm laser line, and Atp7a with a 647-nm laser line.
IHC analyses.
The entire procedure has been described in detail previously (10, 23). Briefly, tissue was fixed overnight in buffered formalin and then transferred to 70% ethanol. Sections were embedded in paraffin, and 10-μM sections were cut and affixed to microscope slides. Paraffin sections on slides were deparaffinized with xylene and a series of ethanol washes. Sections were then blocked for 30–45 min with IHC blocking solution (Bethyl Laboratories) followed by a PBS wash. The Atp7a polyclonal antiserum (54–10 or N-term) was then applied at a 1:500 dilution overnight in a humidified chamber, followed by a 10-min wash in PBS. A secondary antibody (Alexa Fluor 647 goat anti-rabbit IgG; Invitrogen) was then applied for 30 min at a 1:1,000 dilution, followed by reaction with Sytox Green. After another brief wash in PBS, coverslips were affixed to slides with a fluorescent mounting medium.
Western blotting and IP studies.
Samples were prepared for Western blotting as follows, with all steps being performed at 4°C, as described (7, 9). Cell pellets were homogenized in sample buffer 1 (0.05 M Tris·HCl, pH 7.4 at 4°C, 0.05 M NaCl, 0.001 M EDTA, + protease inhibitor cocktail) and centrifuged at 16,000 g for 15 min. The supernatant was recentrifuged at 110,000 g for 1 h. This supernatant was termed “cytosol.” The resulting pellet was resuspended in sample buffer containing 0.25% (vol/vol) Tween 20 (buffer 2), sonicated for 20 s in water-ice slush twice, in a Vibra cell (Sonics and Materials, Danbury, CT), at an output of ∼40% intensity with 1 min of chilling in between, and then centrifuged at 16,000 g for 30 min. This supernatant equates solubilized particulate membrane fraction. For total lysates, cells were directly homogenized in buffer 2, whereas all other steps remained the same. We also routinely utilized a Nuclear Extract Kit (Active Motif, Carlsbad, CA) that allowed the purification of both cytosolic and nuclear fractions. Samples were adjusted to 20% glycerol and stored at −20°C until use.
For IP studies, all steps were performed at 4°C, as previously described in detail (9). Samples were immunoprecipitated with a 1:500 dilution of rabbit polyclonal anti-rat Atp7a N-term antibodies in a final volume of 500 μl by gentle mixing overnight. A 50% slurry (30 μl) of protein A-Sepharose was added, and the sample was mixed for 1 more h. The ternary complex was centrifuged at 3,000 g for 3 min, and the unbound fraction was saved. Pellets were washed with 500 μl of sample preparation buffer three times. Samples were then run on denaturing gels, and immunoblotting was performed as described below.
Identical quantities of protein from different treatment conditions and/or the washed pellets from the IP reaction were solubilized in reducing sample buffer, heated to 70°C for 10 min, and subjected to reducing SDS-4–12% gradient PAGE according to the manufacturer's recommendations (Invitrogen). The gel-resolved samples were electroblotted onto PVDF membranes (Millipore, Bedford, MA) following the manufacturer's recommendations (Invitrogen).
The PVDF blot was blocked with blocking buffer [5% nonfat dry milk in TBST: 0.05 M Tris·HCl, pH 7.4 at 22°C, 0.15 M NaCl, 0.05% (vol/vol) Tween 20] for 90 min and then reacted with 1:5,000 (for 54–10) or 1:12,000 (for N-term) dilutions of anti-Atp7a antiserum in blocking buffer for 1.5 h. Subsequently, three washes of 5, 7, and 10 min were performed in TBST, followed by reacting with a 1:5,000 dilution of horseradish peroxidase-conjugated anti-rabbit (secondary) antibody in blocking buffer, followed by three more washes as stated above. For peptide-blocking experiments, the antiserum was incubated with an equal volume of both peptides (2 mg/ml for each) followed by incubation at room temperature for 1–2 h. The immune serum was also incubated at room temperature with an equal volume of PBS. The blot was exposed to the substrate (H2O2)-enhancer mixture SuperSignal Chemiluminescent Substrates for Western blotting (Pierce, Rockford, IL) and exposed to X-ray film (Phenix Research Products, Candler, NC) per the manufacturer's recommendations. The blot was subsequently stained with Ponceau S for protein quantification with a Bio-Rad LS750 scanning densitometer and Quantity One software.
Statistical analyses.
All statistical analyses were performed by Microsoft Excel using a type 2, two-tailed t-test. P values <0.05 were considered significant.
RESULTS
qRT-PCR analysis of Atp7a and Dmt1 expression throughout the length of the rat intestine.
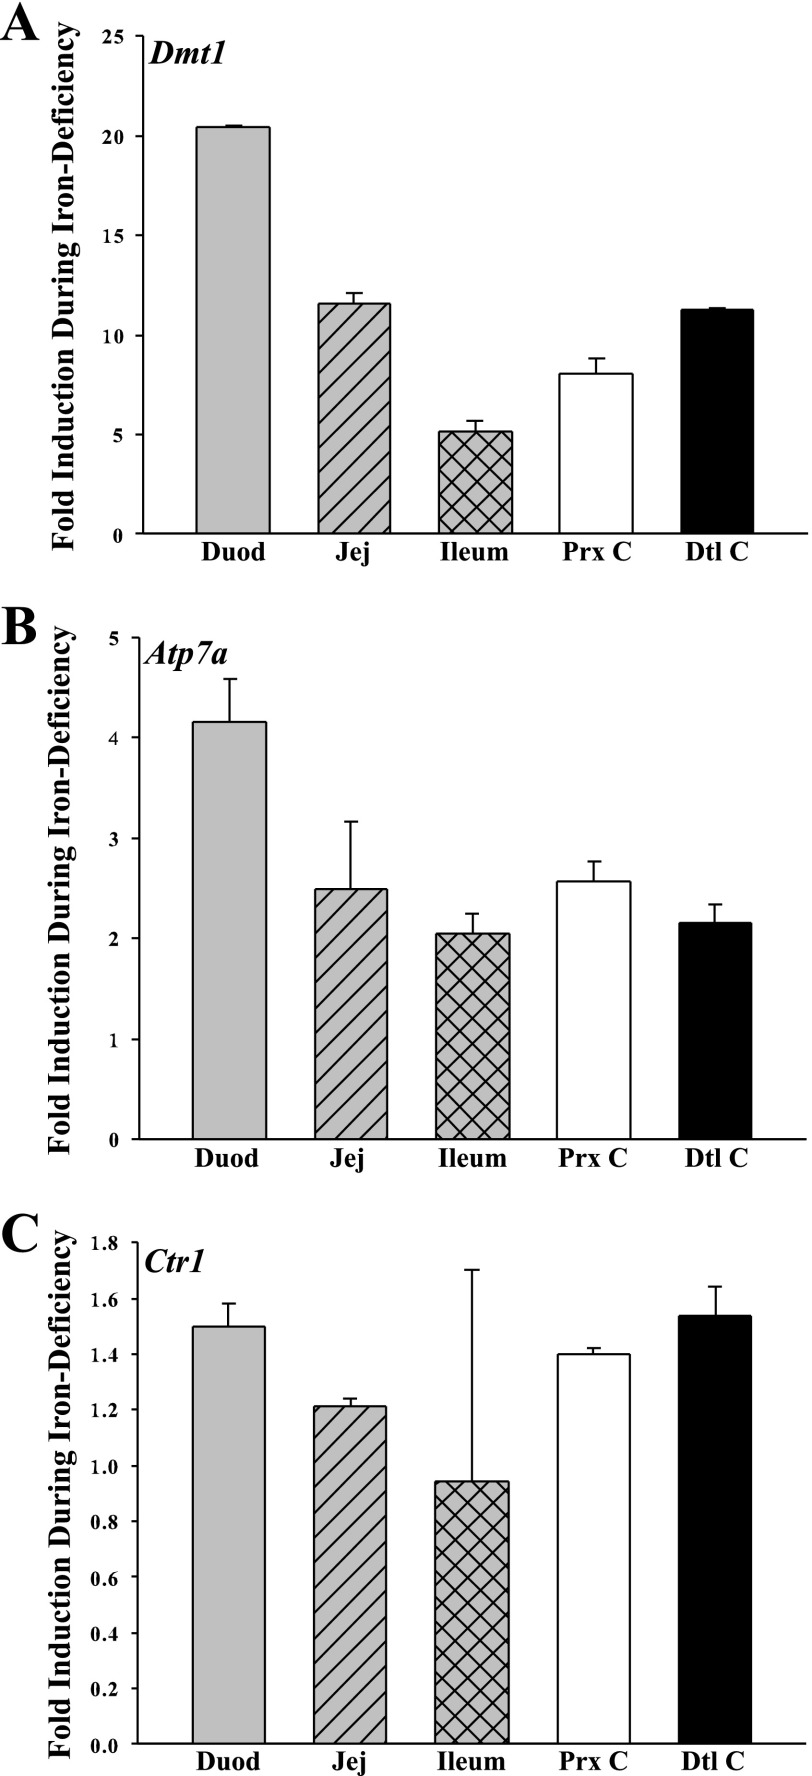
Preliminary studies (not shown) revealed that primer/probe sets did not amplify from genomic DNA and that the primers were quantitative over a wide range of cDNA dilutions, thus validating these reagents. qRT-PCR experiments revealed that the induction of Atp7a and Dmt1 expression more or less paralleled one another along the horizontal axis of the intestine (Fig. 1). Dmt1 expression was as follows (in fold change): 20.46 ± 0.08 in duodenum, 11.55 ± 0.57 in jejunum, 5.15 ± 0.56 in ileum, 8.08 ± 0.74 in proximal colon, and 11.28 ± 0.07 in distal colon (P < 0.05 for all vs. controls). Atp7a expression in different gut segments was (in fold change) 4.15 ± 0.43 in duodenum, 2.49 ± 0.68 in jejunum, 2.05 ± 0.20 in ileum, 2.56 ± 0.20 in proximal colon, and 2.16 ± 0.18 in distal colon (P < 0.05 for all vs. controls). Ctr1 expression, however, showed an induction during iron deficiency only in the duodenum as follows: 1.50 ± 0.08 in duodenum (P < 0.05 compared with controls), 1.21 ± 0.03 in jejunum, 0.95 ± 0.76 in ileum, 1.4 ± 0.02 in proximal colon, and 1.54 ± 0.1 in distal colon (all others not significant).
Fig. 1.
qRT-PCR analysis of divalent metal transporter 1 (Dmt1), Atp7a, and copper transporter 1 (Ctr1) expression in rat intestine. Dmt1 expression is shown in A, Atp7a in B, and Ctr1 in C. Duod, duodenum; Jej, jejunum; Prx C, proximal colon; Dtl C, distal colon. Data represent means ± SE of 3–5 rats per group; n = 3.
Development of an in vitro model to study Atp7a gene regulation by iron deprivation.
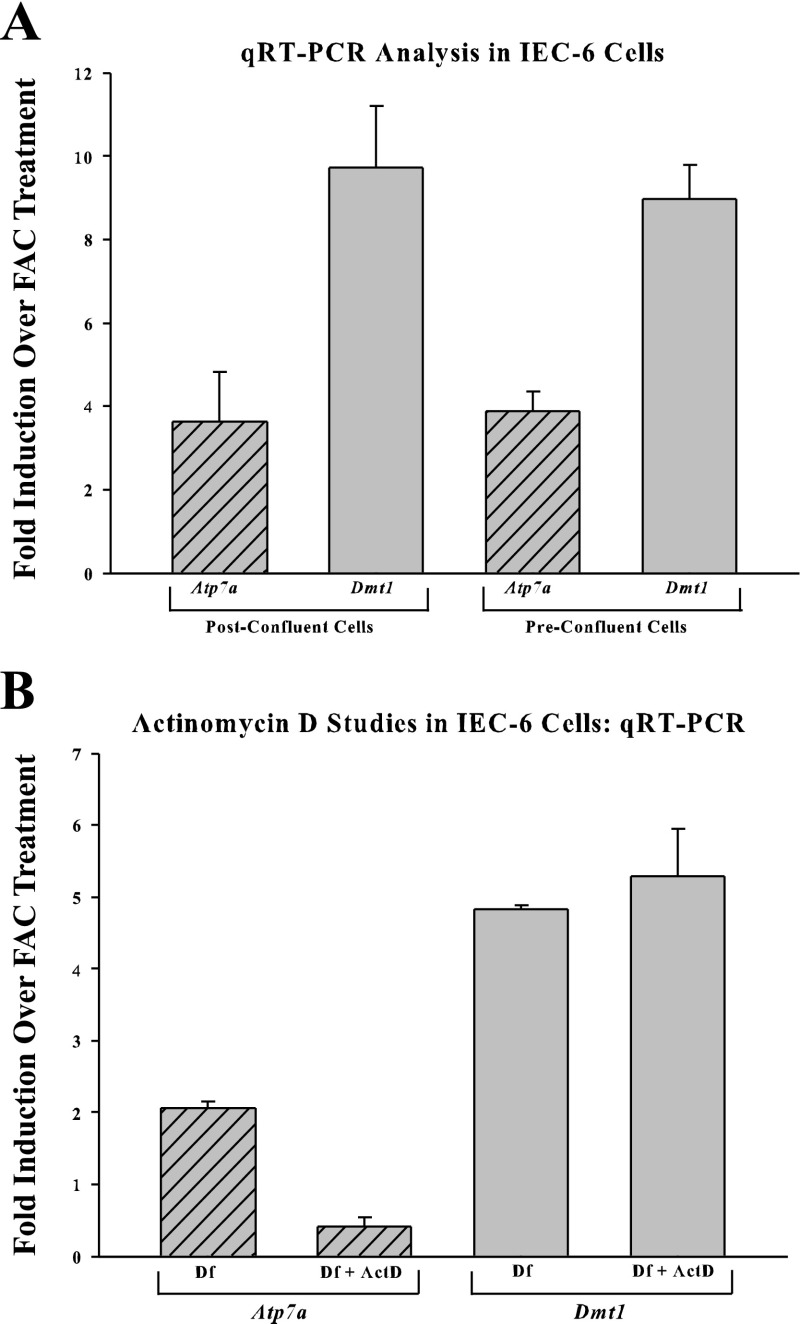
Atp7a and Dmt1 expression was easily detected in IEC-6 cells, and, on the basis of the relatively early cycle number when the amplification curve crossed the threshold (∼25), we conclude that expression levels were quite robust. Moreover, we documented an induction of both genes when cells were treated with Df for 16 h. In preconfluent cells (or just at confluence), Atp7a induction (in fold change) was 3.64 ± 1.19 and Dmt1 was 9.72 ± 1.47, whereas, in postconfluent cells, Atp7a induction was 3.9 ± 0.45 and Dmt1 was 8.96 ± 0.84 (Fig. 2A). In a separate set of experiments in preconfluent cells, Atp7a induction was 2.06 ± 0.06-fold, which was reduced to 0.42 ± 0.11-fold by inhibition of transcription with actinomycin D. Dmt1 induction by iron chelation was not influenced by ActD treatment (4.82 ± 0.06 Df vs. 5.29 ± 0.65 with Df + ActD).
Fig. 2.
qRT-PCR analysis of Atp7a and Dmt1 expression in rat intestinal epithelial cells (IEC-6). Atp7a and Dmt1 expression in iron-treated (ferric ammonium citrate, FAC) and iron-chelated (deferoxamine, Df) cells is shown in A (n = 5–7). Similar experiments were performed in cells pretreated with actinomycin D (ActD) (B; n = 3).
Mapping the 5′ end of the rat Atp7a transcript.
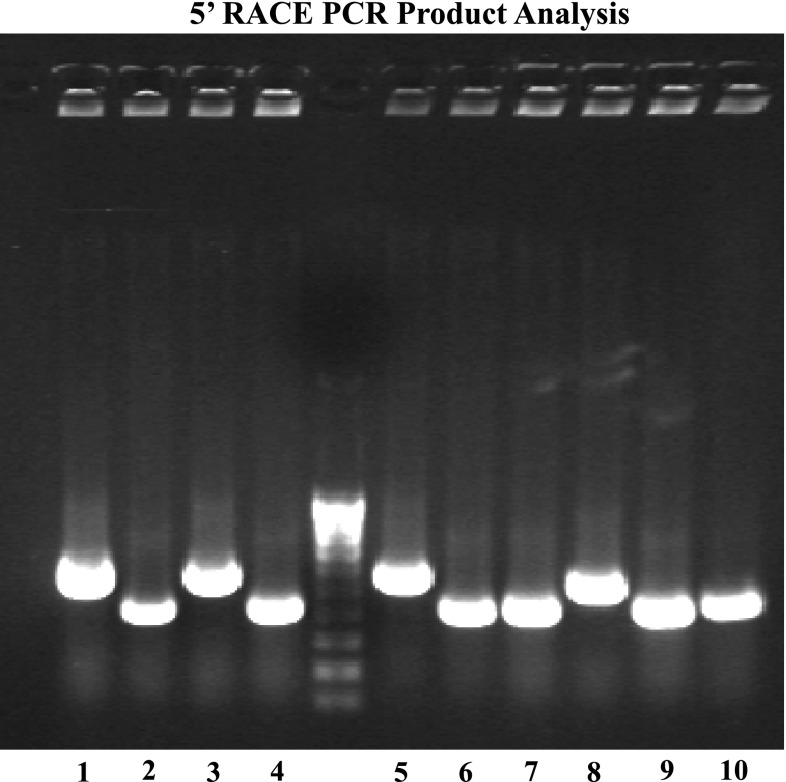
Surprisingly, 5′ RACE using adaptor-specific and Atp7a gene-specific primers resulted in three different sized amplicons (Fig. 3). Upon sequencing of 29 clones, we realized that three different Atp7a splice variants existed. All clones began with a sequence that was homologous to exon 1 of the mouse and human Atp7a genes although the 5′ end base was variable, with more than 10 different 5′ ends detected (Fig. 4A). Interestingly, this sequence was not identified in the NCBI Entrez Gene database (http://www.ncbi.nlm.nih.gov/sites/entrez), where the rat Atp7a gene was reported to have 22 exons (GeneID: 24941). Conversely, the human and mouse genes were reported to have 23 exons (GeneID: 538 for human; GeneID: 11977 for mouse). The new rat exon 1 sequence (beginning with the 5′ end of the longest RACE clone) mapped to chrX:94148780–94148885 (by a Rat BLAT search; http://genome-mirror.duhs.duke.edu/cgi-bin/hgBlat), which is 43,658 bp upstream of exon 1 reported in Entrez Gene (chrX:94192543–94192680).
Fig. 3.
Agarose gel analysis of 5′ rapid amplification of cDNA ends (RACE) clones. 5′ RACE clones are depicted, along with a 100-bp DNA ladder. It is apparent that 3 different sized DNA fragments are present (see, for example, lanes 5, 6 and 8). These amplicons were subcloned and sequenced (along with 19 others), revealing alternative splice versions of the Atp7a transcript.
5′ RACE analysis revealed three transcript variants; as mentioned, all clones began with new exon 1 (which is homologous to exon 1 in the mouse and human Atp7a genes). New exon 1 was spliced to a novel exon (which we call exon 1A), to exon 2 (which was the original exon 1 in Entrez Gene) or to exon 3 (which was the original exon 2; Fig. 4). It was interesting to note that the majority of clones we identified had the novel ex1/ex3 splice (17/29 or ∼60%), whereas 10/29 had ex1/ex2/ex3 variant and only two clones had the ex1/ex1a/ex2/ex3 splice variant. The novel ex1/ex3 transcript variant is missing the presumed start codon in exon 2 but has an in-frame start codon (AUG) 69 amino acids downstream. Exon 1A is between exon 1 and exon 2; it maps to chrX:94175284–94175394, which puts it 26,399 bp downstream of exon 1 and 17,149 bp upstream of exon 2. The total distance between the newly reported exon 1 and exon 2 is 43,658 bp, which would represent intron 1, before the discovery of novel exon 1A. This size for intron 1 compares favorably with the predicted sizes of intron 1 in the mouse (42,390 bp) and human (60,785 bp) Atp7a genes. Moreover, the exon 1A sequence in rat does not contain an in-frame AUG codon, so presumably it would not lead to alternative protein variants.
We were also able to identify a sequence homologous to novel exon 1A in the mouse Atp7a gene, which mapped to mouse chromosome X (chrX:103247522–103247724) and had over 90% sequence homology to the rat sequence. This exon 1A sequence in the mouse gene was ∼25 kb downstream of exon 1 and ∼17.4 kb upstream of exon 2. Because we do not know the precise boundaries of the putative exon 1A sequence in mouse, we cannot predict whether it contains an alternative translational start site. Conversely, we could not find any homology between the human genome and the rat exon 1A sequence, searching with the NCBI BLAST function or via Human BLAT searches.
The proposed new structure of the 5′ end of the rat Atp7a gene is depicted in Fig. 4. The 5′ ends of the different RACE clones were variable, as indicated by the boxed nucleotides. All predicted splice sites have near-perfect consensus sequences (26), and the predicted alternative translation initiation sites are both flanked by strong consensus Kozak sequences (17). Interestingly, both the human and mouse Atp7a genes have in-frame AUG codons exactly 69 amino acids from the predicted translational start codon in exon 2, all in exon 3.
qRT-PCR studies of Atp7a splice variants in rat intestine and IEC-6 cells.
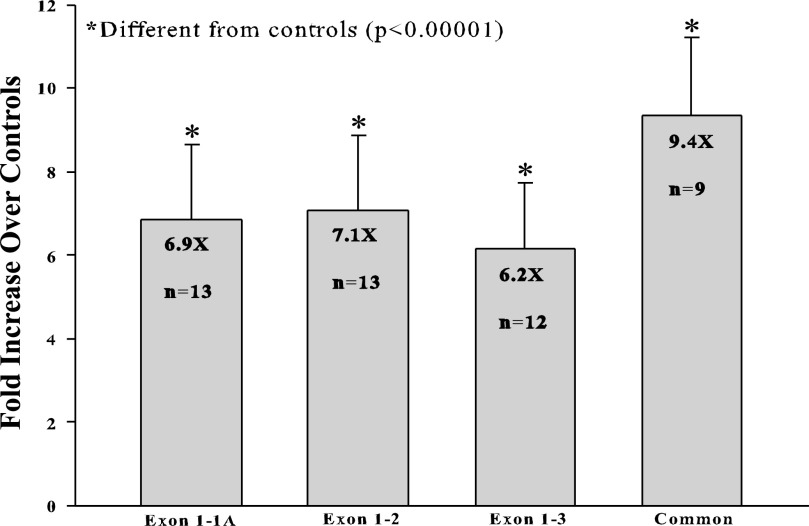
The primer binding regions and the overall strategy are depicted in Fig. 4. Reverse primers were designed to bridge exon boundaries, which ensured that they could not amplify genomic DNA nor could they amplify other transcript variants where those particular exons are not spliced together. Melt curves as well as agarose gels showed that only one product was being amplified with each primer set. Results indicated that all transcript variants could be easily amplified from both rat duodenal and IEC-6 cell cDNA and that the sequences of the amplicons were correct as determined by cloning and sequencing them. All transcript variants were strongly induced in rat intestine by iron deprivation (Fig. 5; ex1/ex1a primer set, 6.87 ± 1.79-fold; ex1/ex2 primer set, 7.09 ± 1.79-fold; ex1/ex3 primer set, 6.15 ± 1.6-fold; and Atp7a common primer set, 9.35 ± 1.87-fold; n = 9–13 from samples derived from different groups of rats). All fold inductions were statistically different from control values (P < 0.00001), but the fold inductions for the different primer sets were not different from one another.
Fig. 5.
qRT-PCR analysis of Atp7a splice variants in rat intestine. Several different primer sets designed to detect the different splice variants were used to quantify Atp7a mRNA expression in the proximal intestines of control and iron-deficient rats. Exon 1–1A, forward primer in exon 1 and reverse primer in exon 1A; Exon 1–2, forward primer in exon 1 and reverse primer that spans the junction between exons 1 and 2; Exon 1–3, forward primer in exon 1 and reverse primer that spans the junction between exons 1 and 3; Common, primers that bind to exons 6–7 (downstream of the region where alternative splicing occurs) and presumably amplify all Atp7a transcript variants. Fold inductions and n values are shown in each bar.
ICC analyses.
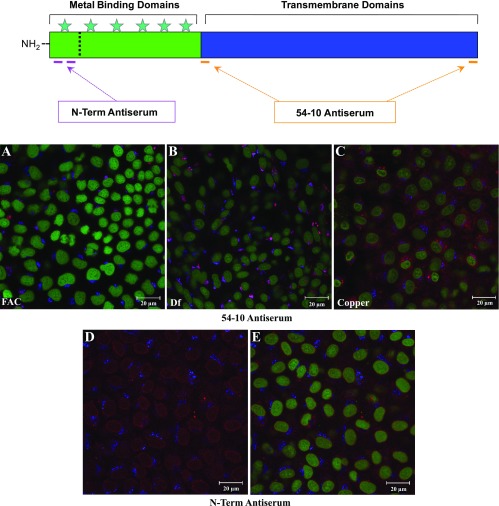
Two different Atp7a antisera were utilized; one was characterized previously (10), and the other was developed specifically for these studies. The relative locations of the peptides in the Atp7a protein used to generate the sera are shown schematically on the top of Fig. 6. Our first set of experiments were ICC analyses in postconfluent IEC-6 cells, whereby cells were reacted with one of the two Atp7a antisera and antibodies against a Golgi marker (58K) followed by staining with a DNA dye (Sytox Green). Cells were then imaged on a laser scanning confocal microscope with three distinct laser lines, each of which stimulates either a fluorescent molecule attached to a secondary antibody or the Sytox Green compound. In iron-treated cells (FAC; Fig. 6A), using the 54–10 antiserum, Atp7a protein (red color) can be seen in a perinuclear compartment that overlaps with the Golgi 58K signal (blue color). In iron-chelated cells (Df; Fig. 6B), much stronger Atp7a protein expression is apparent with strong colocalization with the 58K Golgi marker (indicated by the pinkish color). In cells that were treated with copper (300 μM for 6 h; Fig. 6C), a redistribution of Atp7a protein can be seen throughout the cytosol and on or near the plasma membrane with some protein still detected in the trans-Golgi. Unlike with the N-term antiserum (described below), the 54–10 antiserum never reacted with proteins in the nucleus.
Fig. 6.
Immunocytochemical analysis of postconfluent IEC-6 cells with Atp7a antisera. Top: basic scheme for antibody production; stars indicate copper-binding domains. A–C: typical images from cells treated with FAC, Df, or copper. Triple labeling was done with Atp7a (54–10 antiserum; 647-nm laser line; red color), Golgi 58K (568-nm laser line; blue color), and Sytox Green (488-nm laser line; green color). D and E: reaction of the cells with the N-term antiserum. Triple labeling was done again (as for the cells shown in A–C); only the blue and red channels are shown in D, whereas all 3 channels are shown in E.
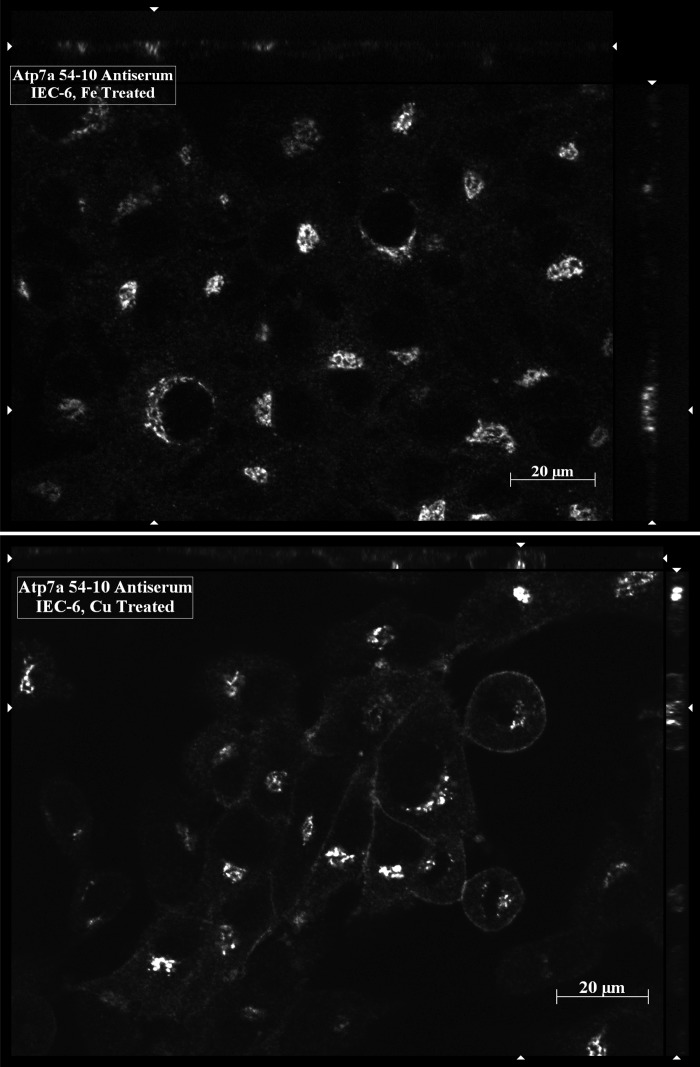
In another series of experiments, the 54–10 Atp7a antiserum was used to localize Atp7a protein in IEC-6 cells. In this case, the 54–10 serum was utilized in single-labeling experiments in iron- or copper-treated IEC-6 cells; iron was used at 200 μM and copper at 100 μM for 16 h in preconfluent cells. A 647-nm-tagged fluorescent secondary antibody was used, and imaging was done with a Zeiss Axioimager fluorescent microscope utilizing an appropriate emission filter. In iron-treated cells, strong staining was seen in a perinuclear region consistent with the trans-Golgi (Fig. 7, top), while the protein could be detected on the plasma membrane in addition to in the trans-Golgi of copper-treated cells.
Fig. 7.
Immunocytochemical analysis of IEC-6 Cells with the 54–10 Atp7a antiserum. The 54–10 antiserum was reacted with fixed cells after they had been treated overnight with iron or copper. Atp7a protein is seen as the bright white color in the images. Typical images are shown from one of several experiments. Stacks of images in the plane are seen on the top and right of each panel.
Quite unanticipated and different results were obtained using the new N-term Atp7a antiserum in postconfluent IEC-6 cells. Immunoreactive protein was predominantly detected around the periphery of the nucleus and within the nucleus (Fig. 6, D and E), with lesser staining seen throughout the cytosol. There was no colocalization of the Atp7a protein with the Golgi marker.
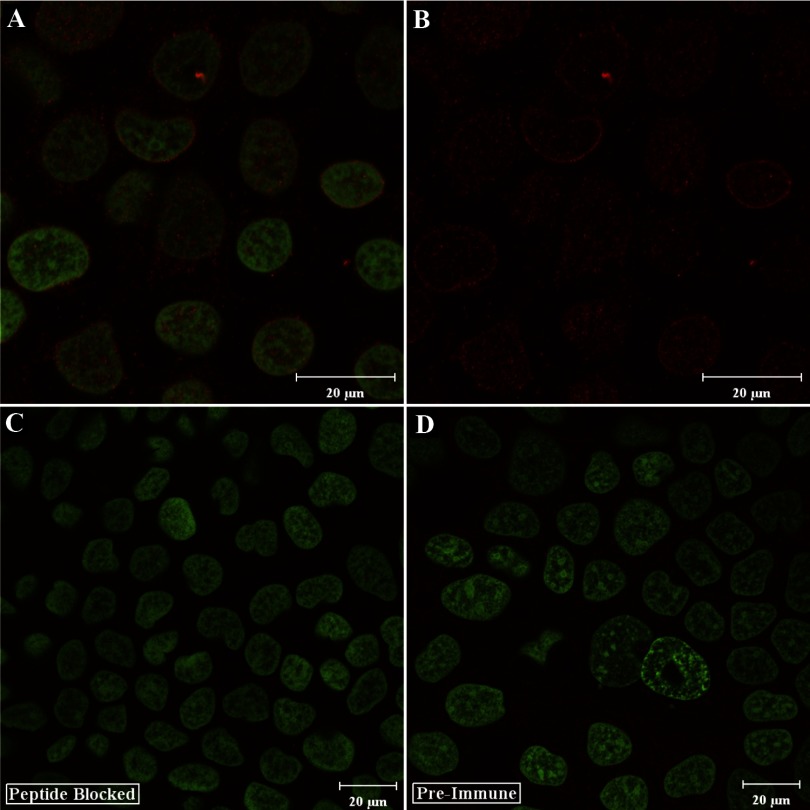
We next sought to determine whether we could also detect the Atp7a protein in the nucleus of a human cell line using the affinity purified N-term antibodies (because the peptides used to immunize the rabbits were identical in rat and human). We chose to use a human intestinal, epithelial cell line, Caco-2, a well-established model of the human intestinal epithelium. We also sought to further characterize the N-term antibodies and to assess their specificity for the Atp7a protein. Again, clear nuclear localization of the Atp7a protein was detected (Fig. 8, A and B), with lesser staining seen in the cytosol. No colocalization with the Golgi 58K marker was seen (data not shown). To address the specificity of the antibodies for the Atp7a protein, we used peptide-blocked antibodies (Fig. 8C) and preimmune serum (mixed from both rabbits). Preincubation of the antibodies with the immune peptides completely abolished the signal, and the preimmune serum did not produce any noticeable signal.
Fig. 8.
Immunocytochemical analysis of Atp7a protein expression in differentiated Caco-2 cells using the N-term antibodies. Caco-2 cells were grown to 20 days postconfluence and then reacted with the N-term antibodies followed by staining with Sytox Green. A: overlay of the 647 channel (Atp7a; red color) and the 488 channel (Sytox Green). B: only the Atp7a staining. Peptide-blocked antibodies or preimmune serum were used in some experiments, as seen in C and D (which show the overlay of the 647 and 488 channels). Typical images are shown from one of several experiments.
IHC analyses.
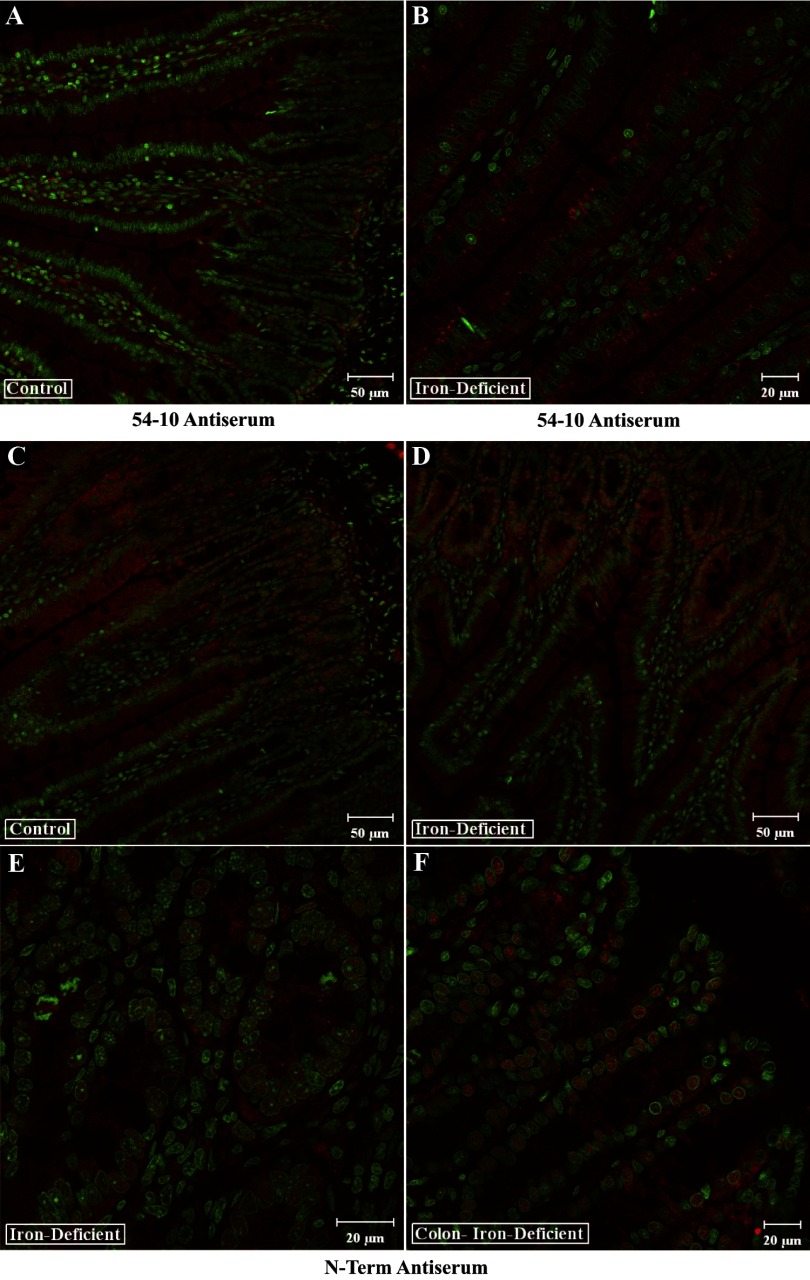
To further assess the usefulness and specificity of our Atp7a antibodies, we performed IHC analyses in intestinal tissue sections from control and experimental rats. Using the 54–10 antiserum, we did not detect significant amounts of the Atp7a protein in the crypt or villus epithelium of the rat intestine (Fig. 9A). We did, however, notice strong staining of immune cells within the lamina propria, which appear to be neutrophils. Conversely, in iron-deficient rats, we detected robust Atp7a expression in a perinuclear region consistent with the trans-Golgi network and also along the basal and lateral membranes of enterocytes (Fig. 9B). Some protein could also be detected on or near the apical membrane of enterocytes in iron-deficient rats, consistent with our previously published findings (23).
Fig. 9.
Immunohistochemical analysis of rat intestine with Atp7a antibodies. Transverse sections of intestinal tissue were reacted with Atp7a antibodies followed by staining with Sytox Green. Shown in all panels are overlays of the 647-nm laser line (detecting Atp7a; red color) and the 488-nm laser line (detecting Sytox Green). The 54–10 antiserum was used with sections from control and iron-deficient rats (A and B). The N-term antibodies were also utilized in parallel experiments with samples derived from small (C and D) and large (E and F) intestine. Typical images are shown that are representative of several experiments that were performed.
Studies with the N-term antiserum provided contrasting results where we could see very clear nuclear staining of cells in the crypts and in epithelial cells of the lower villus. This staining was apparent in control rats (Fig. 9C), and staining was more pronounced in iron-deficient rats (Fig. 9, D and E). No staining was seen in the mid-upper villus, nor was staining of cells within the lamina propria noted. We could also detect robust Atp7a expression in nuclei of crypt and epithelial cells in the colon of iron-deficient rats (Fig. 9F).
Western blotting and IP studies.
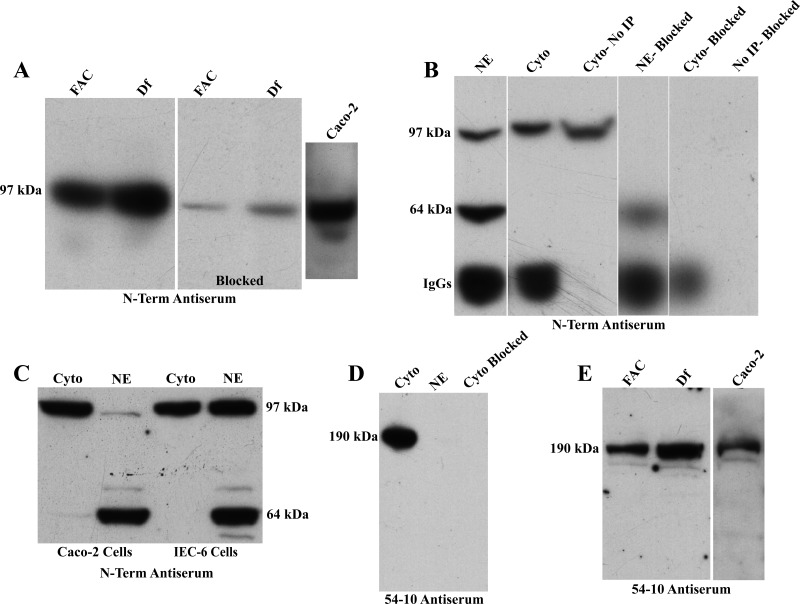
Because we easily detected Atp7a mRNA expression in IEC-6 and Caco-2 cells and expression increased with iron chelation, we felt that these cell lines reflected the induction of Atp7a expression in the intestine of iron-deficient rats. We thus sought to determine what size proteins our Atp7a antibodies recognized in these cells and whether we could detect them in various subcellular fractions. These experiments involved immunoblotting and IP of cytosolic and nuclear protein. In a previous study, using the 54–10 antiserum, we detected what was assumed to be full-length Atp7a in rat intestine, with an estimated molecular weight of over 180 kDa (10). Our first set of experiments for the present study utilized membrane proteins purified from IEC-6 and Caco-2 cells and the N-term antibodies (Fig. 10A). Surprisingly, we detected a single immunoreactive band of ∼97 kDa in both cell lines that could be almost completely blocked by preincubation of the antibodies with the immune peptides. Moreover, expression of the 97-kDa band was increased in cells treated with deferoxamine. We were also able to immunoprecipitate the 97-kDa band from a cytosolic protein preparation from IEC-6 cells, and again the signal could be blocked by the immune peptides (Fig. 10B). When we performed the IP with nuclear proteins from IEC-6 cells, in addition to the 97-kDa band, we also detected a specific band of ∼64 kDa that was nuclear specific. The signal from both bands in the nuclear preparation was significantly attenuated by preincubation of the antibodies with the immune peptides, again providing evidence of specificity. Further parallel experiments were done with cytosolic and nuclear proteins isolated from both cell lines (depicted in Fig. 10C). Results showed that both cell lines expressed the 97-kDa protein in the cytosolic and nuclear fractions, whereas the 64-kDa band appeared to be nuclear specific. Longer exposure of the blot clearly showed that the 97-kDa band was also expressed in the cytosolic fraction of Caco-2 cells. The fact that the 64-kDa band was consistently detected only in the nuclear fractions demonstrates that our cytosolic and nuclear preparations were relatively pure. Further evidence is provided by the fact that we only detected Atp7a protein in the cytosol with the 54–10 antiserum (described below). Moreover, in some experiments where the gels were not run as long, we detected a strong, specific immunoreactive protein band that ran below the 19-kDa protein ladder band. It is also important to note that we tested the purity of our cytosolic and nuclear preparations with a commercially available antibody to Tata-Box Binding (TBP) protein, a nuclear transcription factor; TBP was detected only in the nuclear fraction (data not shown).
Fig. 10.
Western blot analysis and immunoprecipitation (IP) of Atp7a protein in IEC-6 and Caco-2 Cells. Western blot analysis of membrane proteins is shown (N-term; A). IP analysis of IEC-6 cell proteins from cytosolic (Cyto) and nuclear extracts (NE) was performed (B). Western blot of cytosolic and nuclear fractions from Caco-2 and IEC-6 cells is shown in C (N-term). Western blotting studies with the 54–10 antiserum are depicted in D and E. Representative experiments are shown.
The 54–10 antiserum detected a single band of ∼190 kDa (Fig. 10, D and E) in IEC-6 and Caco-2 cells, which is consistent with our previous results from rat intestine (23) and the predicted molecular mass of the full length Atp7a protein. This band was never detected in the nuclear fraction, and it could be completely blocked by preincubation of the antiserum with the immune peptides. Moreover, we could detect a consistent increase in protein expression when cells were treated with the iron chelator, deferoxamine.
DISCUSSION
We first sought to assess the expression of known/potential copper transporters in the mammalian intestine during iron deficiency. It was previously established that Atp7a (6, 8, 23) and metallothionein 1a [8, 9, and unpublished observation (J. F. Collins and C. Kim); by qRT-PCR (>20-fold)] are strongly induced in the intestinal epithelium of iron-deficient rats. Because Atp7a is involved in copper efflux from cells (3), we sought to determine whether known/potential copper importers were induced in parallel to Atp7a in the intestinal epithelium. Top candidates are Dmt1, which can transport copper (1), and Ctr1. We found that Atp7a and Dmt1 were upregulated throughout the length of the gut during iron deficiency in a parallel fashion, perhaps suggesting a functional coupling. Although induction of iron transport occurs mainly in the duodenum during iron deficiency, there are in fact previous reports showing Dmt1 expression and iron transport in more distal gut segments (2, 12, 16, 27). It is not presently clear why these genes would be induced in gut segments that are not thought to be involved in intestinal iron or copper absorption, but it could be related to the enhanced requirement of IECs for these metal ions in more distal gut segments. Furthermore, Ctr1 expression was slightly induced in only the proximal gut during iron deficiency.
Our next objective was to develop an in vitro model in which to determine the specific mode of regulation of Atp7a gene expression during iron deficiency. We felt that the best in vitro model would express Dmt1 and Atp7a. We found high-level expression of both genes in pre- and postconfluent IEC-6 cells, and, moreover, we were able to see an induction of both genes by iron deprivation. The conclusion was thus made that IEC-6 cells are a suitable model for these studies. The next experiments were designed to determine whether the induction of Atp7a and Dmt1 was related to alterations in transcription initiation rates. Actinomycin D significantly attenuated the induction of Atp7a by iron deprivation, whereas there was no effect on the induction of Dmt1 expression. These observations suggested that Atp7a is transcriptionally regulated by iron deprivation, whereas Dmt1 may be posttranscriptionally regulated via the iron-responsive element in the 3′ end of the mRNA molecule (13).
As a prelude to cloning the rat Atp7a promoter, we first mapped the 5′ end of the transcript. We performed 5′ RACE studies and were surprised to find that there were three alternatively spliced variants of the rat Atp7a transcript; one contained a novel exon 1a, another was missing exon 1a, and the last one was missing exons 1a and 2. The exon 1/exon 3 splice variant that was missing exons 1a and 2 would encode a protein that is truncated at the NH2 terminus by 68 amino acids (because there is an in-frame AUG codon at position 69 in exon 3). This led us to hypothesize that there was more than one Atp7a protein variant. Furthermore, it was important to determine whether this was a rat-specific phenomenon or if it could be more generally applicable to other mammalian species. Sequence comparisons allowed us to identify a genomic region homologous to rat exon 1a in intron 1 of the mouse Atp7a gene, positioned similarly between exons 1 and 2. Moreover, the human and mouse Atp7a genes have a conserved, in-frame AUG codon exactly 69 amino acids downstream of the predicted translational start sites in exon 2. Finally, two or more amplicons were detected by RT-PCR analysis of mouse and human intestinal cDNA using primers specific for exons 1 and 3 (data not shown).
We sought to then determine whether splicing of the Atp7a gene is dependent on iron status, so we developed a qRT-PCR strategy to quantify expression levels of the different variants. Results showed strong induction of all transcript variants in the intestine of iron-deficient rats, with the level of induction being the same for all variants. This suggested that the iron-dependent regulatory event was related to gene transcription and that splicing was not a regulated step in the Atp7a gene expression pathway under these conditions.
We hypothesized that there were two forms of the Atp7a protein, one being full length and one missing the extreme NH2 terminus. To begin to examine this possibility, affinity-purified antibodies (called N-term) were utilized to perform ICC studies in IEC-6 and Caco-2 cells. Surprisingly, we found that these antibodies recognized a protein(s) in the nucleus of rat and human IECs. The antiserum was specific because preimmune serum from the rabbits did not detect any proteins in nucleus or cytosol, and the fluorescent signal was completely abolished by preincubation of the antibodies with the immune peptides. We next performed Western blots with the N-term antibodies and detected a 97-kDa protein that was present in cytosolic and nuclear fractions from both IEC-6 and Caco-2 cells; we also detected a 64-kDa protein that was found only in the nuclear fraction. We were further able to immunoprecipitate these same protein bands and to again completely block the signal by preincubation with the immune peptides.
These observations led us to perform additional studies with our original Atp7a antiserum (termed 54–10). Results obtained with rat intestinal samples confirmed our previous observations (23), in that only one protein band was detected on Western blots at ∼190 kDa. The 54–10 serum was further utilized for studies in IEC-6 cells. We found that a single, specific 190-kDa band was also detected; this band was only seen in membrane preparations or in the cytosolic fraction and never detected in nuclear fractions. Moreover, this protein band increased with iron chelation of the cells. Additional studies showed that the 54–10 antiserum detected a protein in IEC-6 cells that colocalized with a trans-Golgi marker; the protein trafficked to the plasma membrane with copper loading of the cells. All of these observations are consistent with what is known about the Atp7a protein, demonstrating the specificity of this reagent.
One important point to consider is whether the N-term antibodies are indeed recognizing Atp7a protein variants; several lines of experimental evidence are relevant in this regard. First, the immune peptides are specific for only Atp7a. Second, we detect increased protein expression when cells are deprived of iron, consistent with the induction of the Atp7a mRNA. Third, the specific signal by immunofluorescence and Western blotting is not detected with preimmune serum from the immunized animals, and peptide blocking significantly attenuates the signal. Lastly, in preliminary studies, we could pull down these protein bands on a copper-affinity resin, suggesting that the proteins bind copper (data not shown). These facts have led us to hypothesize that these immunoreactive proteins are Atp7a protein variants; ongoing studies have in fact been designed to definitively test this hypothesis.
The next obvious question then is which Atp7a transcripts are encoding these protein variants. Our documentation of alternative splicing of the 5′ end of the gene cannot fully answer this question because the transcripts encoding the 97- and 64-kDa proteins are likely to be considerably shorter than the full-length Atp7a transcript (which presumably encodes the 190-kDa Atp7a protein). This observation has, however, motivated us to explore this phenomenon more thoroughly. We predict that there are additional splice variations of the Atp7a gene that somehow contribute to the production of multiple proteins, with the 5′ end variations being one part of the alternative transcripts. We have in fact documented additional transcript variants by qRT-PCR studies (J. F. Collins and C. Kim, unpublished observation), but which of these transcripts may encode the new protein variants is presently not clear.
Alternative splice variants of the human Atp7a transcript have in fact been described previously (15, 24, 25). Harris et al. reported a 1.9-kb Atp7a cDNA in human cells that contained exons 1 and 2 spliced to exons 16–23, encoding a predicted 57–59-kDa protein. This protein variant would have copper-binding domain 1 and two of eight transmembrane domains; the authors suggested it could be a soluble copper-binding protein that serves a copper chaperone function (24). Unfortunately, its intracellular location was not reported. These authors also reported additional Atp7a transcript variants and suggested that the Atp7a gene is in reality a copper locus encoding multiple versions of the Atp7a protein with different intracellular localizations and functions (29). One such transcript encoded an 11-kDa Atp7a protein variant that was detected in the nucleus (30). This protein was presumably encoded by a novel splice variant that has an insertion sequence and a nuclear localization signal in intron 1 with an in-frame start codon, spliced to exon 2 and exon 23. This protein was suggested to be a copper chaperone for copper delivery into the nucleus.
After careful examination of these papers by Harris et al. (15, 24, 25), it is plausible that our present data may be congruent with these previous observations. All alternative splice variants reported previously contained exon 1, which is consistent with our observations. Furthermore, the predicted size of the protein presumably encoded by the exons 1–2/16–23 splice variant is similar to the molecular weight of a nuclear-specific protein band we have detected in our studies. Overall, although these previous studies by Harris et al. may have relevance to our present studies, more in depth analyses are necessary to determine whether the possible Atp7a protein variants reported in the present communication are the same or different from those reported or predicted previously.
GRANTS
This work was supported by NIH grants 1R21 DK068349 (J. Collins) and 1R01 DK074867 (J. Collins).
Supplementary Material
REFERENCES
- 1. Arredondo M, Munoz P, Mura CV, Nunez MT. DMT1, a physiologically relevant apical Cu1+ transporter of intestinal cells. Am J Physiol Cell Physiol 284: C1525–C1530, 2003. [DOI] [PubMed] [Google Scholar]
- 2. Blachier F, Vaugelade P, Robert V, Kibangou B, Canonne-Hergaux F, Delpal S, Bureau F, Blottiere H, Bougle D. Comparative capacities of the pig colon and duodenum for luminal iron absorption. Can J Physiol Pharmacol 85: 185–192, 2007. [DOI] [PubMed] [Google Scholar]
- 3. Camakaris J, Petris MJ, Bailey L, Shen P, Lockhart P, Glover TW, Barcroft C, Patton J, Mercer JF. Gene amplification of the Menkes (MNK; ATP7A) P-type ATPase gene of CHO cells is associated with copper resistance and enhanced copper efflux. Hum Mol Genet 4: 2117–2123, 1995. [DOI] [PubMed] [Google Scholar]
- 4. Chelly J, Tumer Z, Tonnesen T, Petterson A, Ishikawa-Brush Y, Tommerup N, Horn N, Monaco AP. Isolation of a candidate gene for Menkes disease that encodes a potential heavy metal binding protein. Nat Genet 3: 14–19, 1993. [DOI] [PubMed] [Google Scholar]
- 5. Cherukuri S, Potla R, Sarkar J, Nurko S, Harris ZL, Fox PL. Unexpected role of ceruloplasmin in intestinal iron absorption. Cell Metab 2: 309–319, 2005. [DOI] [PubMed] [Google Scholar]
- 6. Collins JF. Gene chip analyses reveal differential genetic responses to iron deficiency in rat duodenum and jejunum. Biol Res 39: 25–37, 2006. [PMC free article] [PubMed] [Google Scholar]
- 7. Collins JF, Bulus N, Ghishan FK. Sodium-phosphate transporter adaptation to dietary phosphate deprivation in normal and hypophosphatemic mice. Am J Physiol Gastrointest Liver Physiol 268: G917–G924, 1995. [DOI] [PubMed] [Google Scholar]
- 8. Collins JF, Franck CA, Kowdley KV, Ghishan FK. Identification of differentially expressed genes in response to dietary iron deprivation in rat duodenum. Am J Physiol Gastrointest Liver Physiol 288: G964–G971, 2005. [DOI] [PubMed] [Google Scholar]
- 9. Collins JF, Hu Z, Ranganathan PN, Feng D, Garrick LM, Garrick MD, Browne RW. Induction of arachidonate 12-lipoxygenase (Alox15) in intestine of iron-deficient rats correlates with the production of biologically active lipid mediators. Am J Physiol Gastrointest Liver Physiol 294: G948–G962, 2008. [DOI] [PubMed] [Google Scholar]
- 10. Collins JF, Xu H, Kiela PR, Zeng J, Ghishan FK. Functional and molecular characterization of NHE3 expression during ontogeny in rat jejunal epithelium. Am J Physiol Cell Physiol 273: C1937–C1946, 1997. [DOI] [PubMed] [Google Scholar]
- 11. Fox PL. The copper-iron chronicles: the story of an intimate relationship. Biometals 16: 9–40, 2003. [DOI] [PubMed] [Google Scholar]
- 12. Frazer DM, Wilkins SJ, Anderson GJ. Elevated iron absorption in the neonatal rat reflects high expression of iron transport genes in the distal alimentary tract. Am J Physiol Gastrointest Liver Physiol 293: G525–G531, 2007. [DOI] [PubMed] [Google Scholar]
- 13. Galy B, Ferring-Appel D, Kaden S, Grone HJ, Hentze MW. Iron regulatory proteins are essential for intestinal function and control key iron absorption molecules in the duodenum. Cell Metab 7: 79–85, 2008. [DOI] [PubMed] [Google Scholar]
- 14. Gunshin H, Allerson CR, Polycarpou-Schwarz M, Rofts A, Rogers JT, Kishi F, Hentze MW, Rouault TA, Andrews NC, Hediger MA. Iron-dependent regulation of the divalent metal ion transporter. FEBS Lett 509: 309–316, 2001. [DOI] [PubMed] [Google Scholar]
- 15. Harris ED, Reddy MC, Qian Y, Tiffany-Castiglioni E, Majumdar S, Nelson J. Multiple forms of the Menkes Cu-ATPase. Adv Exp Med Biol 448: 39–51, 1999. [DOI] [PubMed] [Google Scholar]
- 16. Johnston KL, Johnson DM, Marks J, Srai SK, Debnam ES, Sharp PA. Non-haem iron transport in the rat proximal colon. Eur J Clin Invest 36: 35–40, 2006. [DOI] [PubMed] [Google Scholar]
- 17. Kozak M. Compilation and analysis of sequences upstream from the translational start site in eukaryotic mRNAs. Nucleic Acids Res 12: 857–872, 1984. [DOI] [PMC free article] [PubMed] [Google Scholar]
- 18. Mackenzie B, Takanaga H, Hubert N, Rolfs A, Hediger MA. Functional properties of multiple isoforms of human divalent metal-ion transporter 1 (DMT1). Biochem J 403: 59–69, 2007. [DOI] [PMC free article] [PubMed] [Google Scholar]
- 19. Mercer JF, Livingston J, Hall B, Paynter JA, Begy C, Chandrasekharappa S, Lockhart P, Grimes A, Bhave M, Siemieniak D, Glover TW. Isolation of a partial candidate gene for Menkes disease by positional cloning. Nat Genet 3: 20–25, 1993. [DOI] [PubMed] [Google Scholar]
- 20. Mukhopadhyay CK, Attieh ZK, Fox PL. Role of ceruloplasmin in cellular iron uptake. Science 279: 714–717, 1998. [DOI] [PubMed] [Google Scholar]
- 21. Nose Y, Kim BE, Thiele DJ. Ctr1 drives intestinal copper absorption and is essential for growth, iron metabolism, and neonatal cardiac function. Cell Metab 4: 235–244, 2006. [DOI] [PubMed] [Google Scholar]
- 22. Petris MJ, Mercer JF, Culvenor JG, Lockhart P, Gleeson PA, Camakaris J. Ligand-regulated transport of the Menkes copper P-type ATPase efflux pump from the Golgi apparatus to the plasma membrane: a novel mechanism of regulated trafficking. EMBO J 15: 6084–6095, 1996. [PMC free article] [PubMed] [Google Scholar]
- 23. Ravia JJ, Stephen RM, Ghishan FK, Collins JF. Menkes Copper ATPase (Atp7a) is a novel metal-responsive gene in rat duodenum, and immunoreactive protein is present on brush-border and basolateral membrane domains. J Biol Chem 280: 36221–36227, 2005. [DOI] [PMC free article] [PubMed] [Google Scholar]
- 24. Reddy MC, Harris ED. Multiple transcripts coding for the menkes gene: evidence for alternative splicing of Menkes mRNA. Biochem J 334: 71–77, 1998. [DOI] [PMC free article] [PubMed] [Google Scholar]
- 25. Reddy MC, Majumdar S, Harris ED. Evidence for a Menkes-like protein with a nuclear targeting sequence. Biochem J 350: 855–863, 2000. [PMC free article] [PubMed] [Google Scholar]
- 26. Senapathy P, Shapiro MB, Harris NL. Splice junctions, branch point sites, and exons: sequence statistics, identification, and applications to genome project. Methods Enzymol 183: 252–278, 1990. [DOI] [PubMed] [Google Scholar]
- 27. Takeuchi K, Bjarnason I, Laftah AH, Latunde-Dada GO, Simpson RJ, McKie AT. Expression of iron absorption genes in mouse large intestine. Scand J Gastroenterol 40: 169–177, 2005. [DOI] [PubMed] [Google Scholar]
- 28. Thomas C, Oates PS. IEC-6 cells are an appropriate model of intestinal iron absorption in rats. J Nutr 132: 680–687, 2002. [DOI] [PubMed] [Google Scholar]
- 29. Vulpe C, Levinson B, Whitney S, Packman S, Gitschier J. Isolation of a candidate gene for Menkes disease and evidence that it encodes a copper-transporting ATPase. Nat Genet 3: 7–13, 1993. [DOI] [PubMed] [Google Scholar]
- 30. Vulpe CD, Kuo YM, Murphy TL, Cowley L, Askwith C, Libina N, Gitschier J, Anderson GJ. Hephaestin, a ceruloplasmin homologue implicated in intestinal iron transport, is defective in the sla mouse. Nat Genet 21: 195–199, 1999. [DOI] [PubMed] [Google Scholar]
Associated Data
This section collects any data citations, data availability statements, or supplementary materials included in this article.


