Abstract
We examined the fluorescent spectral properties of fluorescein-labeled DNA oligomers when directly bound to metallic silver particles via a terminal sulfhydryl group. We found a 12-fold increase in fluorescence intensity and 25-fold decrease in lifetime for a fluorescein residue positioned 23 nucleotides from the silver surface compared to labeled oligomers in free solution. Similar results were found for a 23-mer labeled with five fluorescein residues. The absence of long lifetime components in the intensity decays suggests that all labeled oligomers are bound to silver and affected similarly by the metallic surfaces. These results provide the basic knowledge needed to begin use of metal-enhanced fluorescence for the detection of target sequences in simple formats potentially without a washing separation step. The use of metal-enhanced fluorescence provides a generic approach to obtaining a hybridization-dependent increase in fluorescence with most, if not all, commonly used fluorophores.
INTRODUCTION
Methods to detect target DNA sequences are widely used in biotechnology and genomics.1-4 In most such assays the target sequence is detected by binding to labeled oligomers, which are specific for a sequence in the target DNA. Typically, the labeled oligomers are equally fluorescent when in solution or when bound to the solid substrate. As a result, measurements are typically end-point assays following washing steps.
We now describe a general approach to obtain a binding-dependent change in intensity for almost any fluorophore. Our approach is based on the ability of metallic silver particles to increase the intensity and photostability of a wide variety of fluorophores.5-9 This effect is due to the interaction of excited state fluorophores with mobile electrons on the surface of silver particles resulting in an increase in the rate of radiative decay.10,11 This results in an increase in the quantum yield of the fluorophore accompanied by an unusual decrease in lifetime. Our approach provided a several-fold increase in intensity, which resulted in increased sensitivity. The interaction of fluorophores with metallic silver particles is a through-space physical, and not chemical, interaction. As a result, our approach can most likely be used generally with all fluorophores and thus will be widely useful to measure any binding interaction.
There are a number of methods of fluorophore deposition on silver island films (SIFs). We have used already thin layers of solution between slides coated with SIFs,5 spin-coated polymer solutions doped with fluorophore,12 or protein monolayers containing fluorophores deposited uniformly on SIFs.7,8,13 In all these preparations some fraction of fluorophores remained unaffected by silver particles. Atomic force microscopy (AFM) images showed that the silver particles cover less than 30% of the silvered area.5 The fluorophores located on quartz/glass between silver particles can be too far from the silver particles to be affected. In effect, observed enhancements are underestimated and lifetimes always contained a long component corresponding to the lifetime on the unsilvered slide. In this experiment we attempted to bind fluorescein-labeled thiol-derivatized DNA oligomers exclusively to silver particles. Now, all fluorophores are located in close proximity to the metal. We believe that this method will result in more accurate enhancement values and will provide a larger dynamic range for the assays.
MATERIALS AND METHODS
Sample preparation
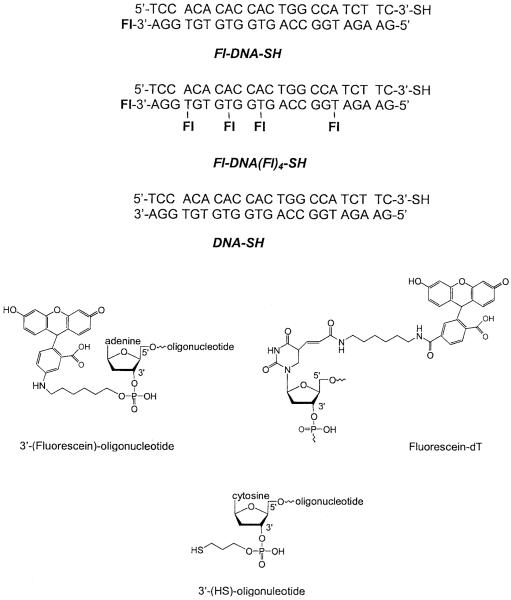
All oligonucleotides (Scheme I) were obtained from the Biopolymer Core Facility at the University of Maryland, School of Medicine. Nanopure H2O (>18.0 MΩ), purified using the Millipore Milli-Q gradient system, was used for all experiments. All other compounds were purchased from Sigma-Aldrich (St. Louis, MO) and used without additional purification.
SCHEME 1.
Chemical structure of the oligonucleotides.
SIFs were prepared on quartz slides (12.5 mm × 45 mm; Starna Cell, Inc., Atascadero, CA). The quartz slides were first soaked in a 10:1 (v/v) mixture of H2SO4 (95-98%) and H2O2 (30%) overnight before the deposition. After being washed with ultrapure water, the quartz surface was coated with amino groups by dipping the slides in 1% aqueous solution of 3-aminopropyltriethoxysilane (APS) for 30 min at room temperature. The slides were washed extensively with water and air-dried prior to silver deposition. Silver island film deposition was accomplished as described previously.5 Briefly, 10 drops of fresh 5% NaOH solution was added to a stirring silver nitrate solution (0.25 g in 35 ml of water). A total of 1 ml of ammonium hydroxide was added dropwise to redissolve the dark-brown precipitate. The solution was cooled to 5°C in an ice bath and a fresh solution of d-glucose (0.36 g in 10 ml of water) was added, followed by placing four pairs of APS-coated quartz slides into the solution. The mixture was stirred for 2 min in ice bath and then allowed to warm to 30°C in the next 5 min. As the mixture turned from yellow-greenish to yellow-brown the color of the slides became greenish. The slides were removed from the beaker, rinsed with water, and bath sonicated for 1 min at room temperature. Only one side of each slide was coated with silver islands. Unless indicated otherwise, the free amino groups remaining on the quartz surface were blocked with succinic anhydride by immersion in a freshly prepared solution of 0.111 g succinic anhydride in 7 ml of 1-methyl-2-pyrrolidone and 0.77 ml 0.2 M sodium borate buffer, pH 8. After a 15-min incubation at room temperature slides were washed in three changes of water. For some experiments, in order to examine the spectral properties of DNA bound to a quartz surface as well as to the silver surface, the amino groups were not blocked with succinic anhydride.
Immobilization of DNA samples on silver islands was accomplished by placing each slide in 3 ml of a 5nM solution of thiol-derivatized double-stranded DNA in a 1-cm2 cuvette for 48 h at 5°C. Solutions of ds-DNA samples (Fl-DNA-SH, Fl-DNA(Fl)4-SH, and DNA-SH) were prepared by mixing complementary oligonucleotides in 5 mM Hepes (pH 7.5), 0.1 M KCl and 0.25 mM EDTA buffer to a final concentration of 5 nM and cooling very slowly after incubation at 70°C for 2 min. The concentration of single-stranded DNA was determined using ε(495 nm) = 76,000 M-1cm-1 for fluorescein-labeled oligonucleotides (pH 9), ε(260 nm) = 225,000 M-1cm-1 for thiol-derivatized oligonucleotide, and ε(260 nm) = 262,000 M-1cm-1 for unlabeled oligonucleotide. The amount of ds-DNA deposited on silver island film was determined by emission measurements of fluorescein-labeled DNA (λex= 470 nm) in a 1-cm2 cuvette before and after immobilization.
Before fluorescence measurements of labeled DNA immobilized on silver islands (Scheme II), each slide was washed three times with buffer (5 mM Hepes, pH 7.5, 0.1 M KCl, and 0.25 mM EDTA) and covered with the grooved part of a 0.5-mm demountable cuvette filled with the same buffer to protect the surface during the measurements. Unlabeled thiol-derivatized DNA samples (DNA-SH) on silver islands were used as the background controls. For preparation of samples in which Fl-DNA-SH was immobilized on entire area, not only on the silver islands, we skipped blocking of free amino groups and we used 50 nM solution of Fl-DNA-SH for immobilization.
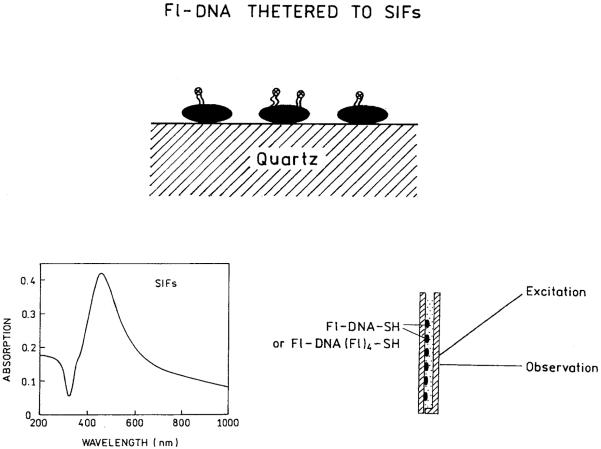
SCHEME 2.
Thiolated DNA bound to silver particles (top). Absorption spectrum of a SIF (left) and our experimental geometry (right).
Fluorescence measurements
Emission spectra from DNA-silver islands layers were collected in front-face geometry on a SLM 8000 spectrofluorometer with 470 nm excitation from a xenon lamp. For photostability measurements we used 514 nm excitation from an argon ion laser.
Lifetimes were measured on a 10-GHz frequency-domain fluorometer14 using a mode-locked argon ion laser 514 nm, 76 MHz repetition rate, 120 ps pulse width, as the excitation source. The emission was selected with combination of a 520 nm long-pass liquid chromate filter (CrO 2-4/Cr2O 2-7, 0.3 M, pH 8) and an interference filter centered at 540 nm.
For frequency-domain (FD) measurements the excitation was vertically polarized and the emission observed through a polarizer oriented at 54.7° from the vertical position. The FD intensity decays were analyzed in terms of the multiexponential model
| (1) |
where τi are the lifetimes with amplitudes αi and [H9018] αi = 1.0. Fitting to the multiexponential model was performed as described previously.15 The contribution of each component to the steady state intensity is given by
| (2) |
The mean decay time is given by
| (3) |
The amplitude-weighted lifetime is given by
| (4) |
The value of 〈τ〉 is proportional to the area under an intensity decay. If the measurements are performed using the same instrumental conditions, and the αi values are not normalized, the values of 〈τ〉 are proportional to the quantum yields.
In measurement involving metal particles one can expect dramatic changes in lifetimes and an appearance of extremely short components. Therefore, we chose to use a 10-GHz frequency-domain fluorometer, which is known to resolve picosecond lifetimes with high resolution.16,17
Effects of SIFs on fluorescence
In close proximity to a metallic surface, up to about 50 Å, fluorophore emission is strongly quenched. The emission of fluorophores near SIF but outside the quenching region depends on two major factors, enhanced local field and an increase of radiative decay rate of the fluorophore. The first factor provides stronger excitation rates. The second factor changes quantum yield and lifetime of the fluorophore. The observed fluorescence enhancement is given by
| (5) |
where GQY = Qm/Q0 is the increase in quantum yield of fluorophore near SIF. Scheme III shows the energy diagrams for molecules in the absence and presence of SIF. In the absence of SIF, the quantum yield and lifetime are given by
| (6) |
| (7) |
where Γ is the radiative rate and knr is the nonradiative decay rate. In the presence of SIF, the quantum yield and lifetime are given by
| (8) |
| (9) |
where Γm and km are radiative and nonradiative rates induced by metal.
SCHEME 3.
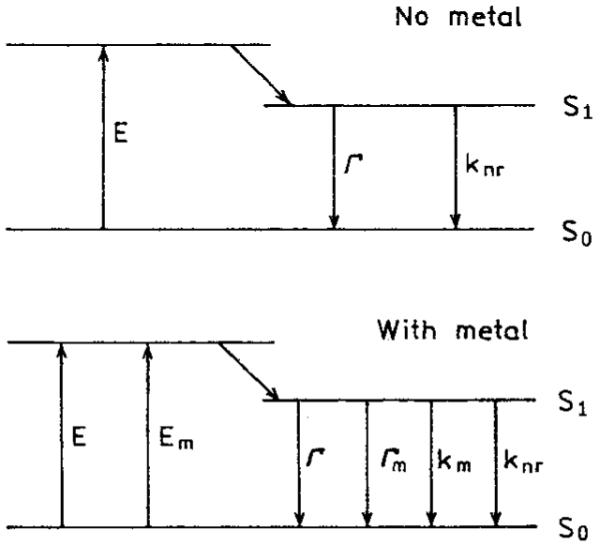
Jablonski diagram for free fluorophores (top) and on SIFs (bottom).
Increases in the radiative rate near SIF results in increased quantum yields and decreased lifetimes. For more details see ref. 6.
RESULTS AND DISCUSSION
In order to compare the intensity of Fl-DNA-SH in solution and bound to silver particles, it was necessary to determine the amount bound to the slides. This is difficult to accomplish because of the low absorption of a submonolayer of labeled oligomers and the absorption of the SIF, which spans the entire UV and visible spectrum. We determined the amount of bound DNA by a differential measurement. A SIF was incubated with a Fl-DNA-SH solution for 48 h. The fluorescence intensity of the solution was measured before and after contact with the SIF. Repeated experiments show an approximate 7% decrease (Figure 1). From this decrease we calculated a surface density of 0.36 pmol/cm2. From AFM images of our SIFs5,7 we estimated that silver particles cover 20-25% of the silvered slide. This suggests that the density of Fl-DNA-SH on silver particles is about 1.5 pmol/cm2. The average distance between Fl-DNA-SH calculated for such a surface density is about 100 Å. We believe that in our case the homotransfer between fluoresceins on Fl-DNA-SH is minimal and therefore there is no self-quenching.
FIGURE 1.
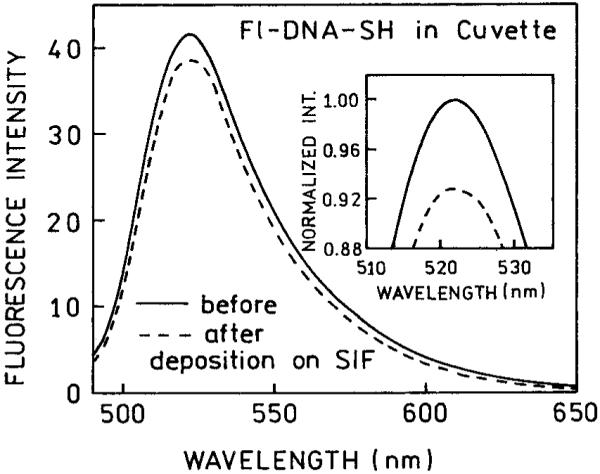
Fluorescence emissions spectra of Fl-DNA-SH before (-) and after 48-h exposure (- - -) to a silver island film.
Knowledge of the amount of Fl-DNA-SH bound to the SIF allowed us to estimate the effect of the silver particles on the fluorescence intensity. We compared the intensities of Fl-DNA-SH on a SIF with an equivalent amount of Fl-DNA-SH (7 nM) in a 0.5-mm cuvette. This comparison (Figure 2) shows that the emission of Fl-DNA-SH is about 12-fold brighter on the SIF compared to solution. Essentially no emission was seen from the area of the slide without silver particles.
FIGURE 2.
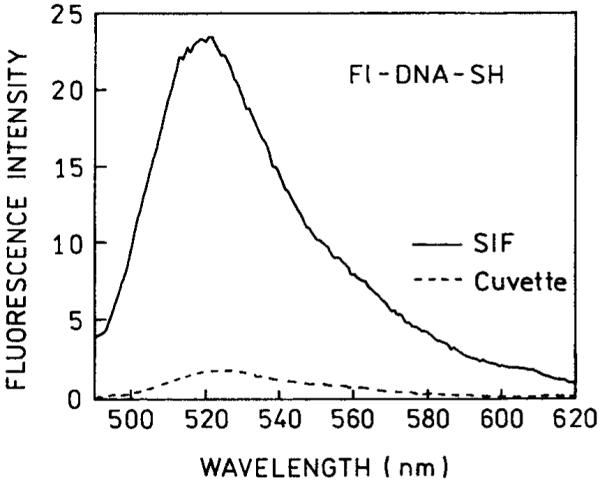
Fluorescence emission spectra of Fl-DNA-SH bound to a SIF (-) and compared to a roughly equivalent amount of Fl-DNA-SH in solution (- - -).
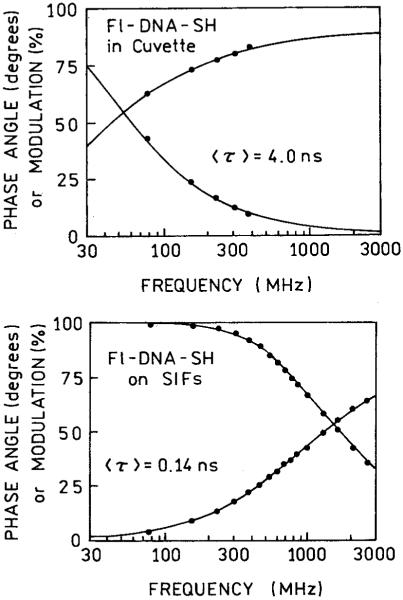
It is well known that the quantum yields and intensities of fluorophores can increase in some environments. Hence, it was important to consider whether the increased intensity seen in Figure 2 was an environmental effect of being bound to this substrate or an effect of the silver particles. Typically, the intensities and lifetimes of a fluorophore change in the same direction, whereas metal-enhanced fluorescence is known to result in decreased lifetimes.6 Figure 3 shows the frequency-domain intensity decays of Fl-DNA-SH when free in solution (top) or when bound to a SIF (bottom). The lifetime decreases from 4.0 ns in solution to 0.14 ns when bound to a SIF. This decrease demonstrates that the increased intensity seen on SIFs is due, at least in part, to an increase in the radiative decay rate of the fluorescein molecules. Given the magnitude of the intensity increase it is likely that there are contributions from both an increased quantum yield and an increased rate of excitation.
FIGURE 3.
Frequency-domain intensity decays of Fl-DNA-SH in solution (top) and bound to a SIF (bottom).
The goal of these measurements was to determine the spectral properties of the labeled DNA when directly bound to silver, without contributions from molecules bound to the substrate distant from the silver or molecules in solution. For this reason the excess amino groups on the slides were blocked with succinic anhydride. The nearly single exponential decay of fluorescence on the SIF suggests (Figure 3) that all of the molecules are in a similar environment. If Fl-DNA-SH were also bound directly to the quartz we expect to observe some intensity due to the quartz-bound oligomers and as a consequence longer decay time components near 4 ns in the intensity decay. This effect is shown in Figures 4 and 5, which present data from SIFs where the amino groups were not blocked. In this case we observed significant intensity from the unsilvered slides which were incubated with Fl-DNA-SH (Figure 4), accounting for nearly 25% of the signal. We believe much of this intensity is due to Fl-DNA-SH bound electrostatically to the APS-coated quartz surface. The intensity decay of Fl-DNA-SH on these unblocked slides was multiexponential (Figure 5 and Table I). For Fl-DNA-SH on quartz we found decay components ranging from 0.17 to 4.6 ns (Table I). On the SIF with unblocked amino groups we also observed a 4.2-ns component. The intensity decay on the unblocked SIF is comparable to that found for a mixture of silver-bound and unbound labeled DNA (Figure 5, bottom, and Table I). The absence of longer decay time components on the blocked SIF (Figure 3) indicates that the emission from this slide is due only to silver-bound oligomers.
FIGURE 4.
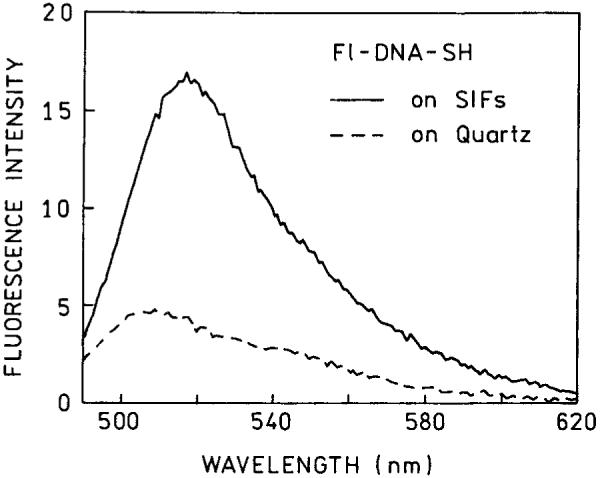
Fluorescence emission spectra of Fl-DNA-SH on quartz and a SIF(s) when the amino groups were not blocked with succinic anhydride.
FIGURE 5.
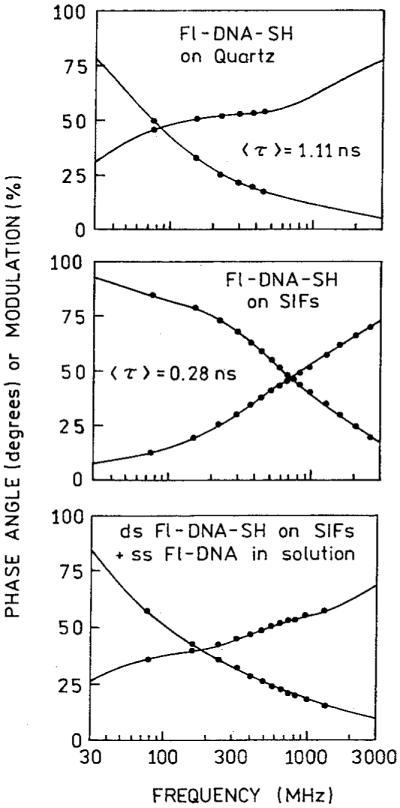
Frequency-domain intensity decays of Fl-DNA-SH on quartz (top), a SIF (middle) with unblocked amino groups, and a mixture of ds Fl-DNA-SH on SIFs and ss Fl-DNA in solution (bottom). In this mixture the steady-state intensities of the bound and unbound fluoresceinlabeled oligomers were roughly equal.
Table I.
Multiexponential Analysis of FI-DNA-SH and FI-DNA(FI)4-SH Intensity Decays
| Sample | 〈τ〉 (ns) | 〈τ‾〉 (ns) | αi | fi | τi (ns) | χ2R |
|---|---|---|---|---|---|---|
| FI-DNA-SH in cuvette | 4.00 | 4.51 | 0.188 (0.149-0.246)a 0.812 (0.754-0.850) |
0.048 (0.030-0.076) 0.952 (0.923-0.970) |
1.02 (0.77-1.25) 4.69 (4.44-4.93) |
1.3 |
| FI-DNA-SH on SIFs, NH2 blocked | 0.14 | 0.17 | 0.478 (0.421-0.545) 0.522 (0.455-0.579) |
0.253 (0.197-0.322) 0.747 (0.678-0.803) |
0.08 (0.07-0.09) 0.21 (0.20-0.22) |
2.6 |
| FI-DNA-SH on quartz, NH2 not blocked | 1.11 | 3.64 | 0.671 (0.660-0.685) 0.149 (0.131-0.166) 0.180 (0.168-0.194) |
0.102 (0.093-0.114) 0.150 (0.127-0.175) 0.748 (0.712-0.780) |
0.17 (0.15-0.19) 1.12 (0.89-1.40) 4.61 (4.39-4.87) |
1.0 |
| FI-DNA-SH on SIF, NH2 not blocked | 0.28 | 1.05 | 0.642 (0.621-0.663) 0.346 (0.327-0.365) 0.012 (0.010-0.014) |
0.283 (0.267-0.302) 0.531 (0.518-0.547) 0.186 (0.174-0.193) |
0.12 (0.11-0.13) 0.43 (0.41-0.44) 4.23 (3.76-4.73) |
1.1 |
| Mixtures of ds FI-DNA-SH on SIFs and ss FI-DNA in solution | 0.55 | 2.80 | 0.634 (0.591-0.667) 0.271 (0.255-0.288) 0.095 (0.090-0.101) |
0.088 (0.071-0.102) 0.229 (0.213-0.247) 0.683 (0.660-0.702) |
0.08 (0.07-0.09) 0.47 (0.43-0.51) 3.94 (3.77-4.12) |
2.3 |
| FI-DNA(FI)4-SH in cuvette | 1.61 | 2.96 | 0.291 (0.273-0.311) 0.314 (0.304-0.338) 0.395 (0.370-0.415) |
0.022 (0.020-0.026) 0.142 (0.123-0.161) 0.836 (0.813-0.857) |
0.12 (0.11-0.13) 0.73 (0.63-0.82) 3.41 (3.28-3.60) |
1.0 |
| FI-DNA(FI)4-SH on SIF, NH2 blocked | 0.04 | 0.07 | 0.840 (0.819-0.864) 0.160 (0.136-0.181) |
0.500 (0.429-0.575) 0.500 (0.425-0.571) |
0.02 (0.01-0.03) 0.11 (0.10-0.12) |
3.5 |
The confidence intervals in parentheses were obtained from the least-squares analysis.
In order to obtain increased sensitivity DNA oligomers are frequently labeled with multiple fluorophores. In the case of fluorescein, this usually results in self-quenching. We examined an oligomer that contained five fluorescein residues, Fl-DNA(Fl)4-SH (Scheme I). In this case the emission intensity on SIF increased 15-fold relative to the same amount of oligomer free in solution (Figure 6). The lifetime decrease on the SIF indicates an interaction with the surface plasmon. On this oligomer with five fluoresceins, about two of the fluorescein are expected to be near the silver surface (<50 Å) and possibly quenched. This suggests that labeled oligomers showing larger enhancements may be obtained when the multiple fluorescein residues are positioned more distant from the silver surface.
FIGURE 6.
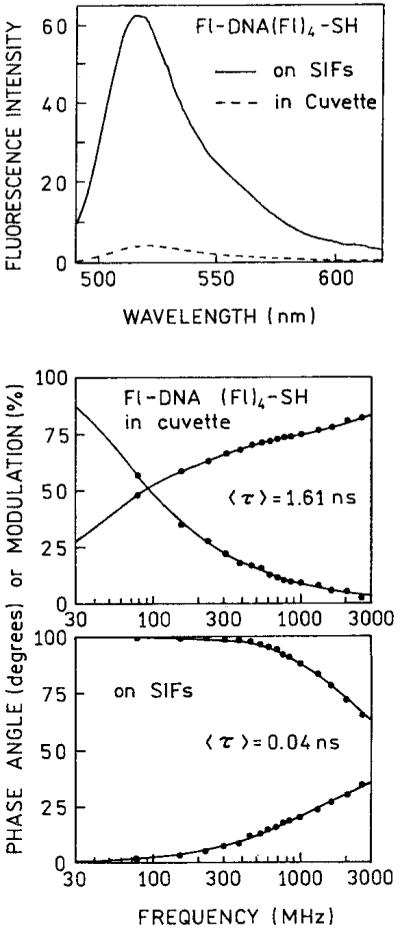
Emission spectra and frequency-domain intensity decays of Fl-DNA(Fl)4-SH in cuvette and on SIF with blocked amino groups.
Is the observed increase in brightness of fluorophores tethered to the SIFs useful? We believe that more than an order of magnitude increase in fluorescence signal provides an opportunity for increased sensitivity in a variety of assays. Each fluorophore located on a complementary DNA oligomer will contribute with much stronger emission upon binding to the silver particles.
For oligomers with a single fluorescein residue the intensity increases 12-fold compared to the emission of the same amount of fluorescein molecules in solution. This intensity increase may be due to a combination of both an increased quantum yield of Fl-DNA-SH on the SIF surface and the possible increased rate of excitation due to an enhanced local field near the metal particles.5 The quantum yield of Fl-DNA-SH in Hepes buffer at pH 7.5, calculated using rhodamine 6G in ethanol (QY 0.94) as a reference, is about 0.44 (about half that of free fluorescein). The increased quantum yield can be responsible for about 2.2-fold enhancement of Fl-DNA-SH emission on SIFs. Another factor of about 5.5-fold enhancement is due to enhanced local field near the metal.
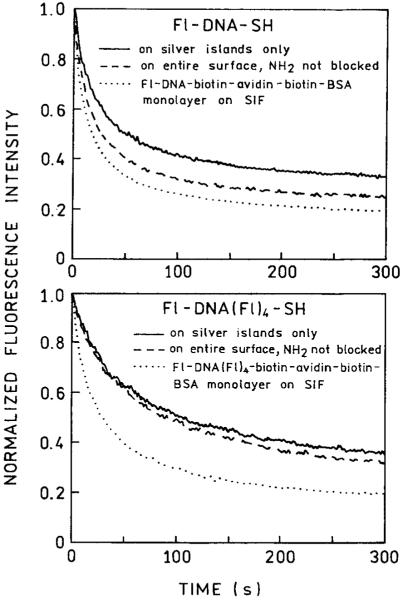
Finally, we examined the photostability of fluorescein when bound to SIFs with blocked and unblocked amino groups between islands (Figure 7). The photobleaching rates were roughly equal with somewhat higher stability on the blocked slides. We were hoping that the labeled oligomers directly bound to silver would display much higher photostability. The oligomers directly bound to the silver particles were somewhat more photostable than biotin-labeled oligomers bound to the entire surface using protein monolayers,8 prepared according to ref. 13. Since the rate of photobleaching is the same or slower on the silver particles, and the intensity is more than 10-fold higher, these results indicate that a 10-fold larger time-integrated signal can be obtained from the labeled oligomers on the silver particles. Further work is required to determine which factors affect photostability on silver particles.
FIGURE 7.
Photostability of fluorescein-labeled oligomers bound to silver particles, the entire surface of silver island films (unblocked amino groups), or bound via a protein monolayer.
CONCLUSION
The preceding data support an important general conclusion. Movement of a labeled oligomer from solution to a metallic silver particles can result in a 10-fold or larger increase in fluorescence intensity. The interaction of fluorophores with these particles is a through-space electromagnetic interaction and will thus occur with most fluorophores. We conclude that a wide variety of biomolecule binding assays can be developed using the phenomenon of silver-particle-enhanced fluorescence. In fact, recently we demonstrated such a hybridization assay using silver-enhanced fluorescence.18
Acknowledgments
This work was supported by the NIH National Human Genome Research Institute, HG-002655, with partial support from National Center for Research Resources, RR-08119.
REFERENCES
- Schena M, Heller RA, Theriault TP, Konrad K, Lachenmeier E, Davis RW. TIB Tech. 1998;16:301–306. doi: 10.1016/s0167-7799(98)01219-0. [DOI] [PubMed] [Google Scholar]
- Brown PO, Botstein D. Nat Genet Suppl. 1999;21:33–37. doi: 10.1038/4462. [DOI] [PubMed] [Google Scholar]
- Meldrum D. Genome Res. 2000;10:1288–1303. doi: 10.1101/gr.157400. [DOI] [PubMed] [Google Scholar]
- Deyholos MK, Galbraith DW. Cytometry. 2001;43:229–238. [PubMed] [Google Scholar]
- Lakowicz JR, Shen Y, D’Auria S, Malicka J, Gryczynski Z, Gryczynski I. Anal Biochem. 2002;301:261–277. doi: 10.1006/abio.2001.5503. [DOI] [PMC free article] [PubMed] [Google Scholar]
- Lakowicz JR. Anal Biochem. 2001;298:1–24. doi: 10.1006/abio.2001.5377. [DOI] [PMC free article] [PubMed] [Google Scholar]
- Malicka J, Gryczynski I, Fang J, Lakowicz JR. Anal Biochem. 2003;317:136–146. doi: 10.1016/S0003-2697(03)00005-8. [DOI] [PMC free article] [PubMed] [Google Scholar]
- Malicka J, Gryczynski I, Lakowicz JR. Anal Chem. 2003;75:4408–4414. doi: 10.1021/ac020739m. [DOI] [PMC free article] [PubMed] [Google Scholar]
- Lakowicz JR, Malicka J, Gryczynski I. Photochem Photobiol. 2003;77:604–607. doi: 10.1562/0031-8655(2003)077<0604:iioydo>2.0.co;2. [DOI] [PMC free article] [PubMed] [Google Scholar]
- Kummerlen J, Leitner A, Brunner H, Aussenegg FR, Wokaun A. Mol Phys. 1993;80(5):1031–1046. [Google Scholar]
- Gersten J, Nitzan A. J Chem Phys. 1981;75(3):1139–1152. [Google Scholar]
- Gryczynski I, Malicka J, Holder E, DiCesare N, Lakowicz JR. Chem Phys Lett. 2003;372:409–414. doi: 10.1016/S0009-2614(03)00420-2. [DOI] [PMC free article] [PubMed] [Google Scholar]
- Malicka J, Gryczynski I, Gryczynski Z, Lakowicz JR. Anal Biochem. 2003;315:57–66. doi: 10.1016/S0003-2697(02)00702-9. [DOI] [PMC free article] [PubMed] [Google Scholar]
- Laczko G, Gryczynski I, Gryczynski Z, Wiczk W, Malak H, Lakowicz JR. Rev Sci Instrum. 1990;61:2331–2337. [Google Scholar]
- Lakowicz JR, Laczko G, Cherek H, Gratton E, Limkeman M. Biophys J. 1984;46:463–477. doi: 10.1016/S0006-3495(84)84043-6. [DOI] [PMC free article] [PubMed] [Google Scholar]
- Lakowicz JR, Gryczynski I. Frequency-do-main fluorescence spectroscopy. In: Lakowicz JR, editor. Topics in Fluorescence Spectroscopy, Vol. 1: Techiques. Plenum Press; New York: 1991. pp. 293–335. [Google Scholar]
- Lakowicz JR, Gryczynski I, Laczko G, Gloyna D. J Fluoresc. 1991;1:87–93. doi: 10.1007/BF00865204. [DOI] [PubMed] [Google Scholar]
- Malicka J, Gryczynski I, Lakowicz JR. Biochem Biophys Res Commun. 2003;306:213–218. doi: 10.1016/S0006-291X(03)00935-5. [DOI] [PMC free article] [PubMed] [Google Scholar]


