Abstract
We studied fluorescence enhancements of fluorescein tethered to silver colloids of different size. Thiolated 23-mer oligonucleotide (ss DNA-SH) was bound selectively to silver colloids deposited on 3-aminopropyltriethoxysilane (APS)-treated quartz slides. Fluoresceinlabeled complementary oligonucleotide (ss Fl-DNA) was added in an amount significantly lower than the amount of unlabeled DNA tethered to the colloids. The hybridization kinetics, observed as an increase in fluorescence emission, on small (30-40 nm) and large (> 120 nm) colloids were similar. However, the final fluorescence intensity of the sample with large colloids was about 50% higher than that observed for the sample with small colloids. The reference sample without ss DNA-SH was used to estimate the fluorescence enhancements of fluorescein tethered to the small colloids (E = 2.7) and to the large colloids (E = 4.1) due to its steady fluorescence signal. The proposed method, based on controlled hybridization with minimal amount of fluorophore labeled ss DNA, can be used to reliably estimate the fluorescence enhancements on any silver nanostructures.
Keywords: enhanced fluorescence, silver colloids, DNA hybridization
INTRODUCTION
Today fluorescence spectroscopy and microscopy require minimal sample volumes, often in the range of femtoliters, and/or extremely low concentration of fluorophores. The fluorescence signals observed from such samples are low and may not be detectable with low quantum yield fluorophores. There is a great interest in the development of new, better fluorophores, particularly with increased photostability. In the last decade remarkable progress has been made in the area of new biological fluorescent probes such as cyanine dyes,1 Alexa Fluors, and the entire spectrum of indicators proposed by Molecular Probes Inc.2 and other companies.
Another approach to obtain increased sensitivity is to create conditions in which fluorophores will bebrighter. Already in the early 1970s, Drexhage3,4 found that fluorophores placed near reflecting metallic surfaces show oscillations of the emissive lifetime with distance from the metal surface. These findings resulted in a number of theoretical5-11 and experimental12-18 studies on the interaction of an excited molecule with metallic surfaces and metallic particles.
In a series of recent publications we studied the emission enhancements of fluorophores placed on, or near, silver island films (SIFs),19-27 silver colloids,28-30 and other silver nanostructures.31,32 In all of the experiments the increase in the brightness on the silvered part of the sample was accompanied by a reduction in the lifetime. This can be explained by either a change in radiative rate of the fluorophore or rapid reemission of the photon by the metal particle which obtained the excitation energy from the fluorophore.33 The increase of the fluorophore brightness near the silvered surface has been used to study the kinetics of DNA hybridization34 and protein assays.35 To reliably detect such kinetics, the surface has to be carefully prepared, assuring a selective binding of emitting species to the metal particles. Recently, we reported on such selective binding of thiolated oligonucleotides to silver particles.36 The increased emission here is referenced to the time zero signal, which is equal to the signal from the bulk solution.
The use of metal-enhanced fluorescence requires an understanding of the fluorophore-metal interaction and the magnitude of enhancement. However, it is not always easy to estimate fluorescence enhancement of fluorophores deposited on metallic surfaces. Usually, the ratio of emission intensities on metalized/unmetalized parts of the sample is the most effective measure of the enhancement effect.
This enhancement can be due to increased rates of excitation, increased rates of emission, or different amounts of fluorophores on the silvered and nonsilvered surfaces. Most of the reports assume the same amount of fluorophores on metalized and unmetalized parts of the sample. However, absorption measurements are difficult and not reliable on a metalized part of the sample and radioactive labeling and detection are not always practical. The control of the amount of fluorophores deposited on the metallic surface is important to determine whether the increased brightness originated from the metal enhanced fluorescence or from a higher dye concentration. In this manuscript, we describe a general method for the comparison of emission enhancements on any metallic nanostructures based on selective hybridization with minimal amount of stained ss DNA. We compare the enhancements obtained for different sized colloids deposited on quartz substrates.
MATERIALS AND METHODS
Sample Preparation
All oligonucleotides (Scheme 1) were obtained from the Biopolymer Core Facility at the University of Maryland, School of Medicine. Nanopure H2O (>18.2 MΩ), purified using the Millipore Milli-Q Gradient System, was used for all experiments. All other compounds were purchased from Sigma-Aldrich (St. Louis, MO) and used without additional purification.
SCHEME 1.
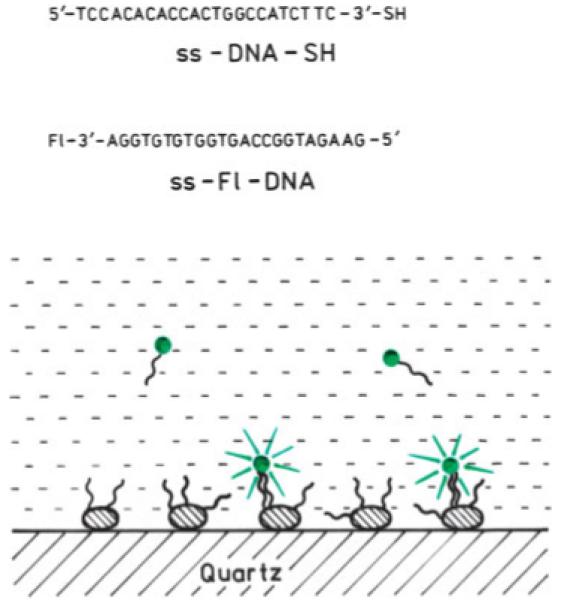
Thiolated oligonucleotide, ss DNA-SH, was bound selectively to silver colloids deposited on APS-treated quartz substrate. Fluorescein-labeled complementary oligonucleotide, ss Fl-DNA, was injected into the solution. The concentration of Fl-labeled DNA was significantly lower than unlabeled DNA tethered on colloids. For the control we used a sample without thiolated ss DNA.
Silver colloids were prepared by reduction of silver nitrate with sodium citrate under controlled temperature/time conditions.
Small colloids
To a stirred solution of AgNO3 (36 mg in 200 mL H2O) at 70°C, 4 mL trisodium citrate (34 mM) was added dropwise. The reaction mixture was warmed to 87-90°C, and stirring was continued for 15 min (until the color of the reaction mixture turned to yellow). The resulting mixture was then cooled in an ice-water bath for 15 min. The colloid solution was purified by centrifugation at 8,000 rpm for 8 min and the precipitate (residue) was dissolved in 1 mM trisodium citrate (8 mL).
Large colloids
A stirred solution of AgNO3 (36 mg in 200 mL H2O) at 91°C was treated dropwise with 0.5 mL trisodium citrate (34 mM). The solution was stirred for 25-30 min and warmed to 96°C. 3.5 mL trisodium citrate (34 mM) then was added dropwise to the reaction mixture in five portions (every 15-20 min). Stirring was continued for 40 min until the milky yellow color remained. The resulting mixture was then cooled in an ice-water bath for 10-15 min. The colloid was purified by centrifugation at 3,500 rpm for 6 min and 100 μL of precipitate was dissolved in 1 mM trisodium citrate (8 mL).
Colloid Binding to Slides
Silver colloid films were prepared on quartz slides (12.5 mm × 45 mm; Starna Cell, Inc., Atascadero, CA). The quartz slides were first soaked in a 10:1 (v/v) mixture of H2SO4 (95-98%) and H2O2 (30%) overnight before the deposition. After being washed with ultrapure water, the quartz surface was coated with amino groups by dipping the slides in 1% aqueous solution of 3-aminopropyltriethoxysilane (APS) for 30 min at room temperature. The pair of two APS-coated quartz slides were immersed in a small colloid solution and left in darkness at 4°C for 8 h. The next two pairs of APS-coated slides were immersed in a large colloid solution and left in darkness at 4°C for 3 h. Only one side of each slide was coated with silver colloid. After washing with water, all free amino groups remaining on the quartz surface (not occupied by silver particles) were blocked with succinic anhydride by placing them into the freshly prepared solution of 0.111 g succinic anhydride in 7 mL of 1-methyl-2-pyrrolidinone and 0.77 mL of 0.2 M sodium borate buffer (pH 8). After 15 min of incubation at room temperature, slides were washed with water three times.
Silver colloid surfaces were characterized by absorption spectra and atomic force microscope (AFM) images collected using a Hewlett Packard model 8453 spectrophotometer and an Atomic Force Microscope (TMX 2100 Explorer SPM, Veeco), respectively. The AFM was equipped with an AFM dry scanner, 100 × 100 μm. Surfaces were imaged in air, in taping mode of operation, using SFM noncontact mode cantilever (Veeco). Samples were washed with water and dried with nitrogen prior to imaging. The AFM scanner was calibrated using a standard calibration grid, as well as gold nanoparticles 100 nm in diameter from Ted Pella. Images were analyzed using SPMLab software.
DNA Deposition
The silver colloid-coated quartz slides described above were used as one side of a 0.2-mm demountable cuvette (12.5 mm × 45 mm; Starna Cells, Inc., Atascadero, CA). Monolayers of thiol-derivatized oligonucleotides deposited on silver colloids were prepared by placing each slide in 3 mL of a 50 nM solution of ss DNA-SH in 5 mM HEPES (pH 7.5), 0.1 M KCl, and 0.25 mM EDTA buffer for 48 h at 5°C, followed by washing three times using the same buffer. Each slide was then reassembled with the grooved part of the 0.2-mm cuvette and 1 nM solution of ss Fl-DNA in 5 mM HEPES (pH 7.5), 0.1 M KCl, and 0.25 mM EDTA buffer was injected for the hybridization kinetic measurement. The concentration of thiol-derivatized oligonucleotide and the fluorescein-labeled oligonucleotide in solution was determined using ε (260 nm) = 225,000 M-1cm-1 for ss DNA-SH and ε (495 nm) = 76,000 M-1cm-1 for ss Fl-DNA (pH 9).
Fluorescence Measurements
Hybridization kinetics and emission spectra from DNA-silver colloid films were collected using front face geometry on a SLM 8000 spectrofluorometer with 514 nm excitation from a mode-locked argon ion laser with a 76-MHz repetition rate. Lifetimes were measured on a 10-GHz frequency-domain fluorometer37 using the same source of light. The emission was selected with a combination of a 520-nm long-pass liquid chromate filter (CrO42-/Cr2O72-, 0.3 M, pH 8) and an interference filter centered at 535 nm. For the frequency-domain measurements the excitation was vertically polarized and the emission was observed through a polarizer oriented at 54.7° from the vertical position. The FD intensity decays were analyzed in terms of the multiexponential model, as described previously.38
RESULTS AND DISCUSSION
Surface Preparation
We prepared two different colloid surfaces, as described under Materials and Methods, one with small silver particles of about 30-40 nm in diameter and another with large silver particles about 120 nm in diameter. The AFM images of both colloidal surfaces are shown in Figure 1. These images are easily distinguishable. The absorption spectra shown in Figure 1 also are different. The spectrum measured for the large colloids is broader and has a long-wavelength tail characteristic of large-sized colloids.33 In total, we prepared four similar quartz substrates for each of the two colloids to use as a reference sample and later to check the reproducibility of the results. Within the series, the colloid films differed by less than 10% in maximum absorption and had a similar spectral shape. The selected two slides with small and large colloids (those described in Figure 1) were covered densely with ss DNA-SH as described under Materials and Methods.
FIGURE 1.
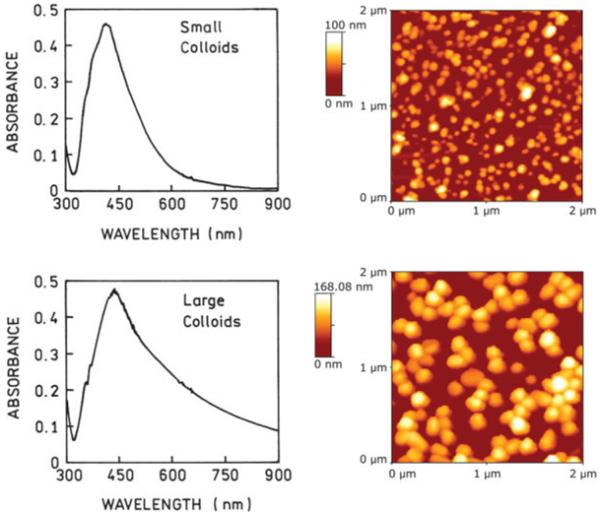
(Left) Absorption spectra of deposited small colloids (top) and large colloids (bottom). (Right) Atomic force microscope images of small (top) and large (bottom) colloids.
Enhancement Measurements
Generally, the idea of the enhancement measurement has been described in Scheme 1. The studied colloid surfaces have been densely covered with ss DNA-SH, which bind selectively to the silver, since APS-coated quartz surfaces have been neutralized by coupling with succinic anhydride after colloid depositions. Each metalized quartz plate served as one side of a 0.2-mm-thick demountable cuvette. This cuvette was filled with hybridization solution containing ss Fl-DNA complementary to the ss DNA-SH on the surface. The number of ss Fl-DNA molecules in solution was much smaller (about hundredfold) than the number of ss DNA-SH molecules on the surface. We expected maximum ss DNA-SH coverage on the colloid surface to be in the range of a few pmoles/cm2.34 Since silver colloids occupied about 50% of the surface and we used 1 nM ss Fl-DNA solution in a 0.2-mm cuvette for hybridization, the maximum ds Fl-DNA-SH coverage should be about 0.04 pmol/cm2. In such conditions, after hybridization takes place, most of the ss DNA-SH will remain unhybridized. However, this will not affect our measurements because observed fluorescence originates only from the fluorescein-labeled molecules. We believe that the same amount of fluorescein molecules will be present near the silver particles, small or large, after the completion of hybridizations with a negligible amount of ss Fl-DNA in solution. If the ss Fl-DNA concentration were equal or larger than ss DNA-SH on the surface, the comparison of enhancement effects would be impossible.
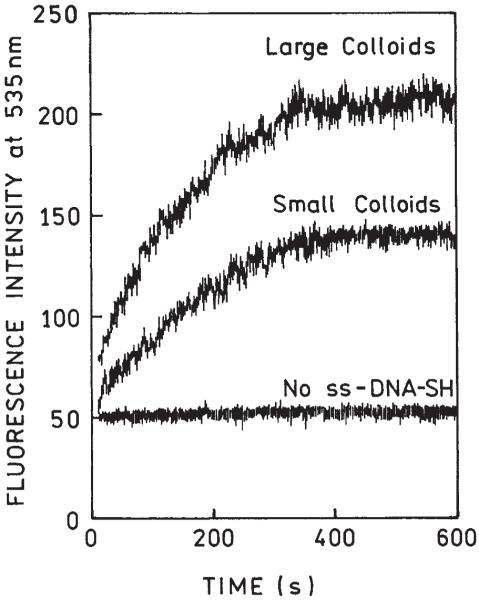
Figure 2 shows the hybridization kinetics observed for surfaces covered with small and large colloids. For a few minutes, fluorescence signals increased and, after about 5 min, the signals remained steady. After 10 min, the hybridizations were completed. The final fluorescence signal observed on large colloids is about 50% stronger than on small colloids. The control experiments were performed with slides not covered with ss DNA-SH. The control signals on large and small colloids were almost identical; in fact the time-dependent control signal shown in Figure 2 is an average value derived from the data for both colloids. The control signal is steady for the entire 10 min, indicating lack of spontaneous binding of ss Fl-DNA to the silver particles in this time scale. The level of the reference signal has been used to estimate the enhancements. Compared to the bulk solution signal (or a zero time signal), the final fluorescence intensities were 2.7- and 4.1-fold higher for small and large colloids, respectively. We repeated the entire experiment on another set of slides and obtained enhancements 2.6 and 4.2 for small and large colloids, respectively, which we consider satisfactory reproducibility.
FIGURE 2.
DNA hybridization kinetics for small and large colloids and for the control sample.
The enhancements estimated here should be considered to be apparent values because they were obtained using a bulk solution of ss Fl-DNA as a reference. If we would have referenced the fluorescence signals to the hybridized ds Fl-DNA, the enhancements would be higher by about 10%, since the fluorescence signal from the hybridized system is weaker.34
Figure 3 shows the emission spectra measured for the samples with small and large colloids after completed hybridization, as well as the spectra for a control solution. The presence of silver particles did not distort the fluorescein spectrum.
FIGURE 3.
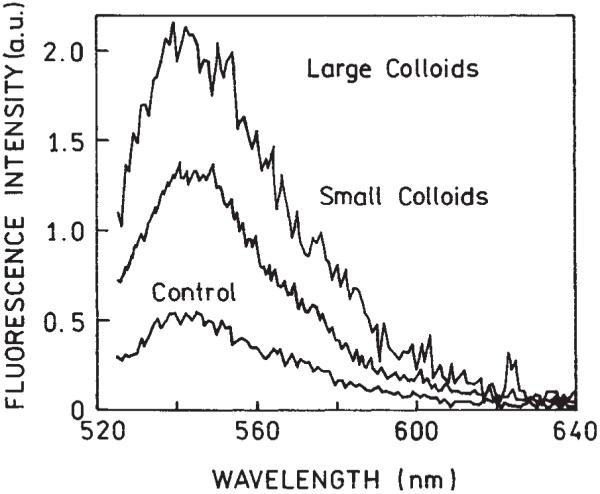
Fluorescence spectra of the samples containing small and large colloids after completed hybridization. Also shown is the emission of the control sample without colloid-bound complementary oligo.
Next, after hybridization we demounted and washed the cuvette and slide containing large colloids. We then assembled the cuvette and repeated the hybridization measurement, as shown in Figure 4. The second hybridization proceeded similarly to the first one. The same procedure was applied to the control sample. The ability to observe the second hybridization proves that the amount of ss DNA-SH on the surface is higher than that of ss Fl-DNA in injected volume.
FIGURE 4.
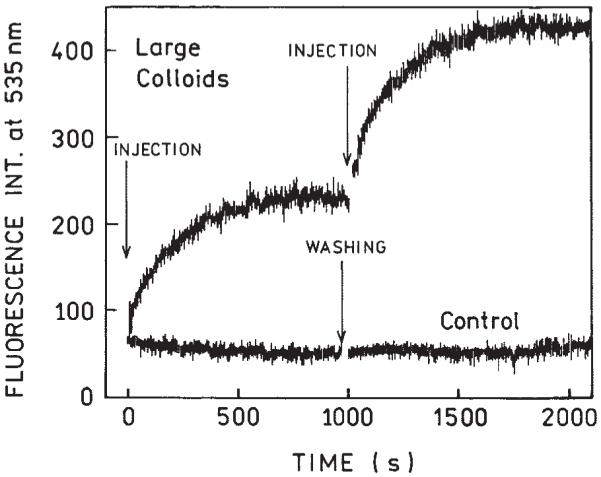
Repeated DNA hybridization. After the first hybridization was completed, the cuvette was demounted and the slide containing colloids was washed with the buffer. Next, the cuvette was assembled and the entire experiment was repeated. The same procedure was applied to the control sample.
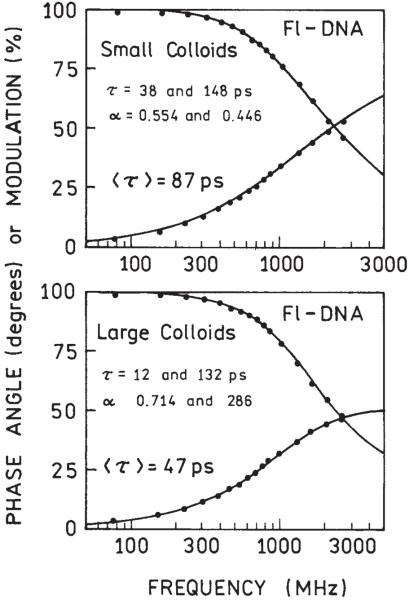
We also compared the lifetimes of the samples after hybridizations. Figure 5 shows the frequencydomain intensity decays measured for small (Figure 5, top) and large (Figure 5, bottom) colloids. Both life-times are significantly shorter than the lifetime of ss Fl-DNA in solution, which is about 4 ns.36 Similarly, short lifetimes for fluorescein deposited on SIFs have been observed previously.26,36 The shorter lifetime observed for large colloids with simultaneously higher brightness indicates a stronger enhancement effect and that the enhancement is due mostly to an increase in the radiative decay rate rather than an increased rate of excitation.
FIGURE 5.
Frequency-domain lifetimes of samples after completed hybridization for small (top) and large (bottom) colloids.
CONCLUSION
We proposed a method to tether a controlled amount of fluorophores to the silver particles deposited on surfaces. This allows a direct comparison of brightness of the stained surfaces. The method is generic and can be applied to any type of deposited silver nanostructures.
We compared the fluorescence emission on quartz slides covered with small (30-40 nm) and large (∼ 120 nm) colloids. Both surfaces show enhanced emission compared to the fluorescence from the bulk solution. Large colloids enhance fluorescein fluorescence 50% stronger than small colloids, and the fluorescein lifetime is shorter when bound to the large colloids compared to the small colloids. This observation is in qualitative agreement with theoretical predictions that larger colloids will cause larger enhancement in fluorescence than smaller colloids.33
The use of silver colloids, rather than silver island films,20 can be an advantage in the application of metal-enhanced fluorescence. Colloids can be prepared with any desired size, and the preparations are relatively homogenous with spherical-shaped particles. Colloids are expected to maintain their shapes when bound to glass surfaces. The extinctions of the colloids are known39 so that absorption can be used to determine the density of the colloids on the surfaces. We believe that surface-bound silver colloids can be used as a reproducible surface for metal-enhanced fluorescence.
Acknowledgments
The work was supported by the National Institutes of Health, the National Center for Research Resources, RR-08119, and the Human Genome Institute, HG-002655.
REFERENCES
- 1.Amersham Biosciences. 2004. pp. 448–449. [Google Scholar]
- 2.Haugland RP. Handbook of Fluorescent Probes and Research Products. ed 9 Molecular Probes; Eugene: 2002. [Google Scholar]
- 3.Drexhage KH. Influence of a dielectric interface on fluorescence decay time. J. Lumin. 1970;12:693–701. [Google Scholar]
- 4.Drexhage KH. In: Progress in Optics XII. Wolf E, editor. North Holland; Amsterdam: 1974. [Google Scholar]
- 5.Tews KHJ. Lumin. 1974;9:223–239. [Google Scholar]
- 6.Chance RR, Prock A, Silbey R. J Chem Phys. 1974;60:2744–2748. [Google Scholar]
- 7.Persson BNJ. J Phys C, Solid State Phys. 1978;11:4251–4260. [Google Scholar]
- 8.Gersten J, Nitzan A. J Chem Phys. 1981;75:1139–1152. [Google Scholar]
- 9.Ruppin R. J Chem Phys. 1982;76:1681–1684. [Google Scholar]
- 10.Barnes WL. J Modern Optics. 1998;45:661–699. [Google Scholar]
- 11.Das PC, Puri A. Phys Rev B. 2002;65:155416/1–155416/8. [Google Scholar]
- 12.Adams A, Rendell RW, Garnett RW, Hansma PK, Metiu H. Optics Commun. 1980;34:417–420. [Google Scholar]
- 13.Weitz DA, Garoff S, Hanson CD, Gramila TJ. Optics Lett. 1982;7:89–91. doi: 10.1364/ol.7.000089. [DOI] [PubMed] [Google Scholar]
- 14.Leitner A, Lippitsch ME, Draxler S, Riegler M, Aussenegg FR. Appl Phys B. 1985;36:105–109. [Google Scholar]
- 15.Aussenegg FR, Leitner A, Lippitsch ME, Reinisch H, Riegler M. Surf Sci. 1987;139:935–945. [Google Scholar]
- 16.Sokolov K, Chumanov G, Cotton TM. Anal Chem. 1998;70:3898–3905. doi: 10.1021/ac9712310. [DOI] [PubMed] [Google Scholar]
- 17.Tarcha PJ, De Saja-Gonzalez J, Rodriguez-Llorente S, Aroca R. Appl Spectrosc. 1999;53:43–48. [Google Scholar]
- 18.De Saja-Gonzalez J, Aroca R, Nagao Y, De Saja JA. Spectrochim Acta A. 1997;53:173–181. [Google Scholar]
- 19.Lakowicz JR. Anal Biochem. 2001;298:1–24. doi: 10.1006/abio.2001.5377. [DOI] [PMC free article] [PubMed] [Google Scholar]
- 20.Lakowicz JR, Shen Y, D’Auria S, Malicka J, Fang J, Gryczynski Z, Gryczynski I. Anal Biochem. 2002;301:261–277. doi: 10.1006/abio.2001.5503. [DOI] [PMC free article] [PubMed] [Google Scholar]
- 21.Gryczynski I, Malicka J, Holder E, DiCesare N, Lakowicz JR. Chem Phys Lett. 2002;372:409–414. doi: 10.1016/S0009-2614(03)00420-2. [DOI] [PMC free article] [PubMed] [Google Scholar]
- 22.Lakowicz JR, Maliwal BP, Malicka J, Gryczynski Z, Gryczynski I. J Fluoresc. 2002;12:431–437. doi: 10.1023/A:1021318127519. [DOI] [PMC free article] [PubMed] [Google Scholar]
- 23.Gryczynski I, Malicka J, Shen Y, Gryczynski Z, Lakowicz JR. J Phys Chem B. 2002;106:2191–2195. doi: 10.1021/jp013013n. [DOI] [PMC free article] [PubMed] [Google Scholar]
- 24.Malicka J, Gryczynski I, Gryczynski Z, Lakowicz JR. Anal Biochem. 2003;315:57–66. doi: 10.1016/S0003-2697(02)00702-9. [DOI] [PMC free article] [PubMed] [Google Scholar]
- 25.Lakowicz JR, Malicka J, D’Auria S, Gryczynski I. Anal Biochem. 2003;320:13–20. doi: 10.1016/S0003-2697(03)00351-8. [DOI] [PMC free article] [PubMed] [Google Scholar]
- 26.Malicka J, Gryczynski I, Lakowicz JR. Anal Chem. 2003;75:4408–4414. doi: 10.1021/ac020739m. [DOI] [PMC free article] [PubMed] [Google Scholar]
- 27.Malicka J, Gryczynski I, Maliwal BP, Fang J, Lakowicz JR. Biopolymers. 2003;72:96–104. doi: 10.1002/bip.10301. [DOI] [PubMed] [Google Scholar]
- 28.Maliwal BP, Malicka J, Gryczynski I, Gryczynski Z, Lakowicz JR. Biopolymers. 2003;70:585–594. doi: 10.1002/bip.10501. [DOI] [PMC free article] [PubMed] [Google Scholar]
- 29.Geddes CD, Cao H, Gryczynski I, Gryczynski Z, Fang J, Lakowicz JR. J Phys Chem A. 2003;107:3443–3449. doi: 10.1021/jp022040q. [DOI] [PMC free article] [PubMed] [Google Scholar]
- 30.Lukomska J, Malicka J, Gryczynski I, Lakowicz JR. J Fluoresc. 2004;14:417–423. doi: 10.1023/b:jofl.0000031823.04926.75. [DOI] [PMC free article] [PubMed] [Google Scholar]
- 31.Parfenov A, Gryczynski I, Malicka J, Geddes CD, Lakowicz JR. J Phys Chem B. 2003;107:8829–8833. doi: 10.1021/jp022660r. [DOI] [PMC free article] [PubMed] [Google Scholar]
- 32.Geddes CD, Parfenov A, Lakowicz JR. Appl Spectrosc. 2003;57:526–531. doi: 10.1366/000370203321666542. [DOI] [PMC free article] [PubMed] [Google Scholar]
- 33.Lakowicz JR. Anal Biochem. in press. [Google Scholar]
- 34.Malicka J, Gryczynski I, Lakowicz JR. Biochem Biophys Res Commun. 2003;306:213–218. doi: 10.1016/S0006-291X(03)00935-5. [DOI] [PMC free article] [PubMed] [Google Scholar]
- 35.Matveeva E, Gryczynski Z, Malicka J, Gryczynski I, Lakowicz JR. In: Vo-Dinh T, Gryczynski Z, Lakowicz JR, editors. Plasmonics in Biology and Medicine; Proc SPIE; 2004.pp. 45–52. [Google Scholar]
- 36.Malicka J, Gryczynski I, Lakowicz JR. Biopolymers. 2004;74:263–271. doi: 10.1002/bip.20071. [DOI] [PMC free article] [PubMed] [Google Scholar]
- 37.Laczko G, Gryczynski I, Gryczynski Z, Wiczk W, Malak H, Lakowicz JR. Rev Sci Instrum. 1990;61:2331–2337. [Google Scholar]
- 38.Lakowicz JR, Gratton E, Laczko G, Cherek H, Limkeman M. Biophys J. 1984;46:463–477. doi: 10.1016/S0006-3495(84)84043-6. [DOI] [PMC free article] [PubMed] [Google Scholar]
- 39.Yguerabide J, Yguerabide EE. Anal Biochem. 1998;262:137–165. doi: 10.1006/abio.1998.2759. [DOI] [PubMed] [Google Scholar]


