Abstract
Fluorescence anisotropy (FA), non-equilibrium capillary electrophoresis of equilibrium mixtures (NECEEM) and high-speed capillary electrophoresis (CE) were evaluated for measuring dissociation kinetics of peptide-protein binding systems. Fyn-SH3-SH2, a protein construct consisting of the Src homology 2 (SH2) and SH3 domain of the protein Fyn, and a fluorescein-labeled phosphopeptide were used as a model system. All three methods gave comparable half-life of ~53 s for Fyn-SH3-SH2:peptide complex. Achieving satisfactory results by NECEEM required columns over 30 cm long. When using Fyn-SH2-SH3 tagged with glutathione S-transferase (GST) as the binding protein, both FA and NECEEM assays gave evidence of two complexes forming with the peptide, yet neither method allowed accurate measurement of dissociation rates for both complexes because of a lack of resolution. High-speed CE, with a 7 s separation time, enabled separation of both complexes and allowed determination of dissociation rate of both complexes independently. The two complexes had half-lives of 22.0 ± 2.7 and 58.8 ± 6.1 s respectively. Concentration studies revealed that the GST-Fyn-SH3-SH2 protein formed a dimer so that complexes had binding ratios of 2:1 (protein-to-peptide ratio) and 2:2. Our results demonstrate that while all methods are suitable for 1:1 binding systems, high-speed CE is unique in allowing multiple complexes to be resolved simultaneously. This property allows determination of binding kinetics of complicated systems and makes the technique useful for discovering novel affinity interactions.
Keywords: flow-gate, kinetic capillary electrophoresis, NECEEM, protein dimer, SH2 domain
1 Introduction
Quantitative measurements of equilibrium and kinetic constants of non-covalent protein interactions are essential in understanding cellular signaling. Many protein-protein interactions, such as those involving SH2 domains, have rapid binding kinetics with complex half-life on the order of seconds, making measurement of kinetic constants challenging. Traditional biological methods including gel electrophoresis, filter binding assay and far Western blot lack the ability to study binding interactions with rapid kinetics due to their inherent long analysis time. Surface plasmon resonance (SPR) has been used extensively for studies of binding kinetics and can be used for measuring rapid on-off rates.[1–3] Although SPR is a powerful method, it requires immobilization of one of the binding partners, which may cause conformational change of biomolecules. It also does not necessarily allow for discovery of unexpected binding stoichiometry. Furthermore, lack of multi-analyte capability limits its application in studying complex samples such as cell lysates. Fluorescence anisotropy (FA) has also been employed for binding studies [4, 5]; however, like SPR, FA also lacks the ability to distinguish multiple analytes.
Capillary electrophoresis (CE), has emerged as a powerful method for quantification of binding interactions.[6–10] Although typically used for determining binding constants or relative affinity, CE can also be used to determine kinetics. One approach is affinity CE (ACE) wherein ligand is added to the electrophoresis buffer and changes in migration time of the receptor are used to extract binding data. It is also possible to determine kinetics constants from peak shapes in ACE; although this method has not been used extensively, presumably because a simulation is required and rate constants can only be measured indirectly.[11, 12] Another approach, termed non-equilibrium CE of equilibrium mixtures (NECEEM) [13], separates a ligand-receptor mixture by CE such that the separation time is long enough to allow some dissociation of the complex. The resulting distorted peak shape is used to extract dissociation rates. A similar approach to peak shape analysis combined with on-column mixing has been used to determine association rates.[14, 15] Serial sampling and CE analysis of reacting mixtures has also been used to determine kinetics. This approach requires that the separation time be short relative to the half-life of the reaction. With commercial CE instrumentation, where separations typically take minutes, this approach is limited to fairly slow reactions. The emergence of high-speed CE with flow-gated injection, which allows separation to be carried out within a few seconds, [16], [17], [18], [19] has opened the door to more relevant biochemical time scales.[20]
Although NECEEM and high-speed CE have emerged as potential methods for monitoring kinetics of interactions, they have not been directly compared to standard methods for validation. In this work, we compare these methods for determining half-lives of complexes to FA using a model system consisting of the SH2 and SH3 domain of Fyn (Fyn-SH2-SH3) as receptor and a fluorescently-labeled phosphopeptide that binds the SH2 domain (Fluor-Fyn peptide) as ligand. Fyn is a Src family tyrosine kinase involved in T-cell signaling, mitogenic signaling and cell adhesion.[21] Fyn has also been reported to be involved in Alzheimer’s disease.[22] Therefore, binding to its SH2 domain is involved in several important cell signaling events and it represents a potential drug target. We find that all methods give similar dissociation rates under appropriate conditions. High-speed CE has a unique ability to distinguish multiple complexes and to detect unexpected interactions.
2 Experimental Methods
2.1 Chemicals
Unless stated otherwise, all chemicals used were purchased from Sigma-Aldrich Co. (St. Louis, MO). Tris-glycine buffer (10×) was purchased from Bio-Rad laboratories (Hercules, CA). All solutions were prepared with deionized water from an E-Pure water purification system (Barnstead International Co., Dubuque, IA). 5-carboxyfluorescein succinimidyl ester (5-FAM, SE) and rhodamine 110 were purchased from Molecular Probes (Eugene, OR). Glutathione sepharose 4B was purchased from GE healthcare (Piscataway, NJ). BCA protein assay kit was purchased from Pierce Biotechnology (Rockford, IL). Fluor-Fyn peptide (fluorescein-EEEEPQpYEEIPIYL) was synthesized and labeled at the N-terminus by the Protein Core of the Michigan Diabetes Research and Training Center. Fyn-SH3-SH2 (525-670) was expressed and purified as a fusion protein with glutathione S-transferase (GST) as previously described.[23] The GST tag was incorporated for purification by glutathione-agarose beads.
2.2 GST cleavage
Cell lysate containing GST-Fyn-SH3-SH2 was incubated with glutathione sepharose 4B beads for 1 hour at 4 °C on an end-over-end rotator. The beads were spun down and washed 3 times with HBS-E/Triton buffer (20 mM Hepes, 0.15 M NaCl, 2 mM EDTA and 1% Triton X-100, pH 7.5) supplemented with benzamidine and phenylmethylsulphonylfluoride followed by two washing steps with PBST buffer (16 mM Na2HPO4, 4 mM NaH2PO4, 150 mM NaCl and 1% Triton, pH 7.3). The beads containing fusion protein were incubated with thrombin in thrombin buffer (50 mM Tris, 0.15 M NaCl and 2.5 mM CaCl2, pH 8.0) at enzyme-to-substrate ratio of 1:3000 for two hours at room temperature. The beads were removed by spinning at 500 rpm for 5 min and the supernatant containing the Fyn-SH3-SH2 was stored at −80 °C for future experiments. The concentration of the purified protein was determined by a BCA protein assay.
2.3 FA Experiments
FA measurements were performed on a BMG Labtech PHERAstar Microplate Reader (BMG Labtech Inc., Offenburg, Germany). Fluorescence was excited at 485 ± 8 nm and emission collected through a 535 ± 15 nm bandpass filter. Dissociation rates were determined using a competition experiment. Initially, 95 μl of a mixture containing of 500 nM protein (Fyn-SH3-SH2 with or without GST) and 200 nM Fluor-Fyn peptide were added to the sample well of a 96-well microplate. 5 μl of 1 mM unlabeled Fyn peptide was carefully added to the side wall of the well to form a hanging drop due to surface tension. The dissociation reaction was started by mixing the drop with the sample using the shaking function of the plate reader. FA was continuously monitored every two seconds immediately after the mixing. To determine the complex half-life and dissociation rate, the FA signal was plotted versus time and the resulting curve fitted to an exponential decay function using Origin 7.0 (OriginLab Corp., Northampton, MA).
2.4 NECEEM Assays
NECEEM assays were performed using a P/ACE MDQ capillary electrophoresis unit (Beckman Coulter Inc., Fullerton, CA) with a separation cartridge temperature of 25°C and samplesstored at 4°C. An Ar+ laser providing 5 mW of 488 nm light was used for LIF detection. Emission was detected after passing through a 488 nm notch filter and a 520 ± 10 nm bandpass filter. Data acquisition (16 Hz) and control were performed using P/ACE 32 Karat Software Version 5.0 (Beckman). Unmodified fused silica capillaries (Polymicro Technologies, Phoenix, AZ) with inner diameter of 50 μm and outer diameter of 360 μm were used as the separation capillary. Length to the detector (Ld) was varied from 10 to 40 cm and applied electric field (E) was varied from 100 to 600 V/cm for the evaluation of NECEEM. The electrophoresis buffer was 25 mM Tris, 192 mM glycine withpH 8.5. Samples were injected for 3, 4 or 5 seconds at 0.5 psi for Ld of 20, 30 or 40 cm, respectively and 3 seconds at 0.4 psi for Ld of 10 cm. At the beginning of each day, capillary was rinsed sequentially with 0.1 M NaOH, H2O, and electrophoresis buffer for 5 min each. The capillary was rinsed with 0.1 M NaOH and electrophoresis buffer for 1 min each prior to each injection.
For NECEEM measurements, sample containing 1 μM Fyn-SH3-SH2 or 2 μM GST-Fyn-SH3-SH2 and 100 nM Fluor-Fyn peptide was incubated on ice for 5 min before being assayed. Both protein and peptide were diluted in Tris-glycine buffer (pH 8.5) from 100 μM stock solutions. The peak areas and migration times were measured using software written in-house.[24] To be able to account for differences in fluorescence upon binding in calculations, the fluorescence intensity of 20 nM Fluor-Fyn peptide and 20 nM Fluor-Fyn peptide with 2 μM of protein (binding is saturated under this condition) were measured on the plate reader.
2.5 High-speed CE Assays
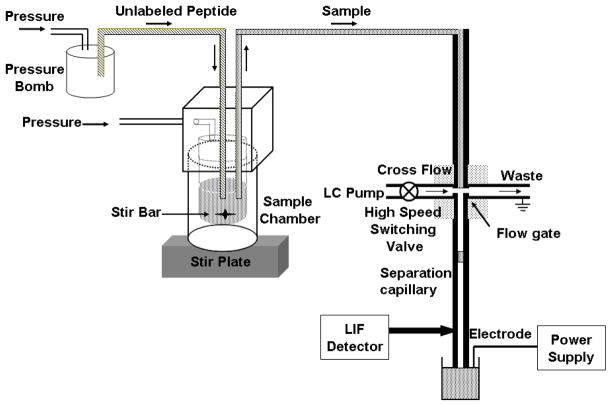
A drawing of the flow-gated high-speed CE-LIF instrument is shown in Figure 1. An unmodified fused silica capillary (10 μm i.d., 360 μm o.d., total length = 7.5 cm, inlet to detector length = 3.8 cm) was used as the separation capillary. All samples were introduced onto the capillary by electrokinetic injection via a flow-gate interface at 2 kV for 0.5 s and separated at 15 kV.[25, 26] Tris-glycine buffer was continuously delivered to the flow gate at a rate of 1.5 ml/min by a Series I HPLC pump (LabAlliance, Fisher Scientific, Pittsburgh, PA).
Figure 1.
Schematic drawing of the high speed CE instrument.
For the competition experiment, 1 mM of unlabeled Fyn peptide was delivered to a pressurized sample chamber containing 200 μl of 500 nM Fyn-SH3-SH2 (with or without GST), 200 nM Fluor-Fyn peptide and 10 nM rhodamine 110 (internal standard, IS) at flow rate of 5 μl/s for 2 s by pressure. A 5 × 2 mm microbar in the sample vial together with the stir plate underneath allowed the unlabeled peptide to be rapidly mixed with the protein and labeled peptide. After addition of unlabeled peptide, sample was delivered to the flow gate at a rate of 0.8 μl/s by pressure. The total delay time between addition of unlabeled peptide and collection of the first electropherogram was 7 s, including sample delivery time, high voltage ramping time and injection time. Electropherograms were collected every 7 s for 250 s and normalized complex peak height (complex peak height divided by peak height of internal standard) was plotted versus time to extract koff by fitting the curve to a one-component exponential decay function.
3 Results and Discussion
3.1 FA Assays
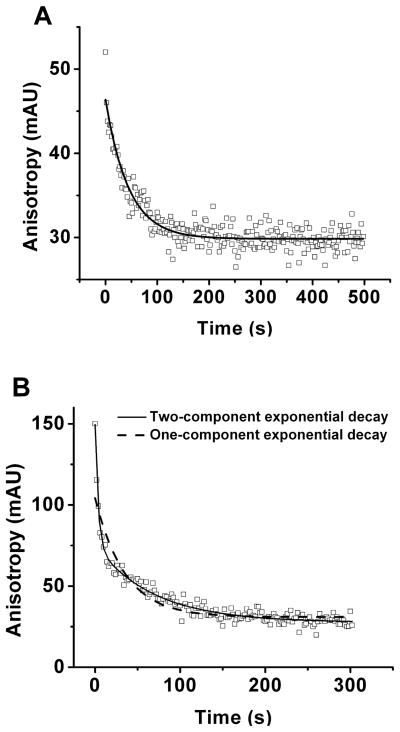
Initial experiments were aimed at determining the half-life of the complex of Fyn-SH2-SH3 with Fluor-Fyn peptide using FA as a standard method. Fluorescence anisotropy increases with the size of molecule according to the Perrin Equation;[27] hence the FA for Fluor-Fyn peptide increases when it binds Fyn-SH2-SH3 due to the significant size difference. Anisotropy for different fluorescent species, such as bound and free Fluor-Fyn peptide, are additive so that in a mixture the total anisotropy is the weighted average of individual species. Therefore, monitoring changes in the FA of a mixture of complex and free peptide allows determination of changes in the amount bound. For kinetics measurements, we spiked an equilibrated mixture of Fluor-Fyn peptide and Fyn-SH2-SH3 with an excess of unlabeled Fyn peptide and monitored the decrease in FA as Fluor-Fyn peptide dissociated from the complex (see Figure 2A). Fitting this curve to a one component exponential yields a t1/2 of 53.5 ± 8.1 s (n = 3) with an average R2 of 0.91.
Figure 2.
FA measurements for Fluor-Fyn peptide dissociation from Fyn-SH3-SH2 (A) and GST-Fyn-SH3-SH2 (B). Sample contained 20 nM Fluor-Fyn peptide, 500 nM Fyn-SH3-SH2 or GST-Fyn-SH3-SH2 and 50 μM unlabeled Fyn peptide in Tris-glycine buffer pH 8.5. Mixing procedures are described in the Experimental Section under FA Experiments.
We repeated this experiment using GST-Fyn-SH2-SH3 as receptor instead of Fyn-SH2-SH3. This protein construct yielded a similar decay (Figure 2B) with t1/2 = 21.2 ± 1.3 s. Although similar, these data had a relatively poor fit (R2 = 0.86) by the single exponential decay and were better fit with a two component decay (R2 = 0.97) with t1/2 of 3.3 ± 0.2 s and 59.5 ± 6.4 s (n = 3). These results suggested the potential for multiple complexes being formed in this solution, a conclusion that was supported by later electrophoresis measurements.
3.2 NECEEM Assays
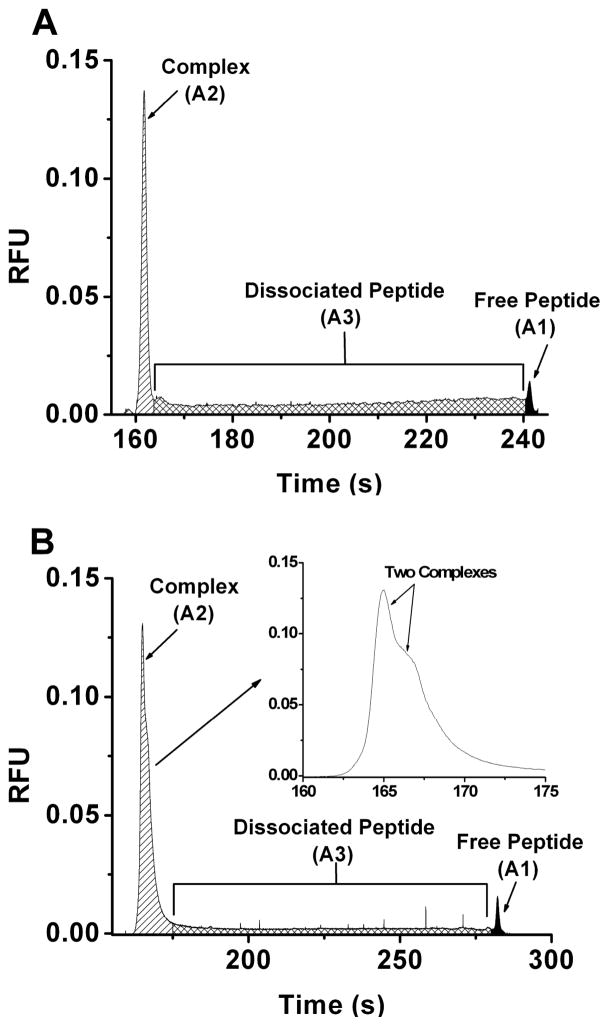
We next determined complex half-life by the NECEEM method. In this method, ligand that has dissociated from the complex during the separation is detected as a bridge between the complex peak and free ligand peak (see Figure 3A for an example). As originally described elsewhere [13, 28, 29] the complex dissociation rate (koff) can be determined by
Figure 3.
NECEEM electropherograms used in determination of koff for Fyn-SH3-SH2 (A) and GST-Fyn-SH3-SH2 (B). Sample contained 1 μM Fyn-SH3-SH2 (A) or 2 μM GST-Fyn-SH3-SH2 (B) and 100 nM Fluor-Fyn peptide and 10 nM rhodamine 110. Areas marked correspond to bound peptide (A2), peptide that dissociated during the separation (A3) and the peptide that was free in the sample solution (A1). The inserted panel in B shows enlarged complex peak. Separation conditions and calculations of koff are described in the Experimental Section under NECEEM Assays.
| Eq. 1 |
where A2 is the peak area of complex (corresponding to ligand that was bound and stayed bound during the experiment), A3 is the area under the bridge (corresponding to ligand that dissociated during the separation) and tc is the migration time of the complex (corresponding to the time allowed for dissociation). This equation does not account for differences in fluorescence response factor when the ligand is bound or free (not uncommon and observed in this case). To account for these differences, we modified Equation 1 to
| Eq. 2 |
where tp is the migration time of free peptide, R is the relative fluorescence response factor of the free peptide and the complex. R was measured from the ratio of the fluorescence intensity of the free peptide and the complex as described in the Experimental Section. The complex half-life was calculated using t1/2 = ln2/koff.
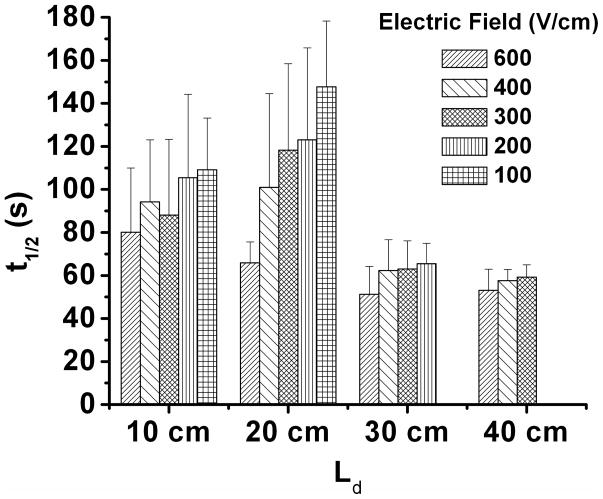
Figure 3A illustrates that when using a 30 cm-long capillary with Ld of 20 cm and applying 400 V/cm electric field, the separation time was 6 minutes and dissociation of Fyn-SH3-SH2: Fyn-peptide complex was observed. The complex half-life calculated using Eq. 2 was 101.0 ± 43.6 s (n = 5), which was significantly higher than that obtained by the anisotropy measurement. Furthermore, the variance was unexpectedly large. We considered the possibility that experimental variables such as electric field, separation time, and column length could influence the result so we repeated the experiment with Ld varied from 10 to 40 cm and electric field from 100 to 600 V/cm as summarized in Figure 4. (Because of complete dissociation of the complex, t1/2 was not measured at an electric field of 100 V/cm for Ld of 30 cm and at both 100 and 200 V/cm for Ld of 40 cm.) These experiments revealed that at shorter separation distances (10 and 20 cm) the calculated t1/2 tends to decrease with electric field and is less reproducible. These troublesome effects were eliminated when Ld of 30 or 40 cm was used. Furthermore, at these lengths, the t1/2 was ~60 s in good agreement with the 53.5 s measured by FA.
Figure 4.
Complex half-life (t1/2) measured by NECEEM at different electric field using capillary with different length to detector (Ld). Sample contained 1 μM Fyn-SH3-SH2 and 100 nM Fluor-Fyn peptide. Experiments were performed under electric field of 600, 400, 300, 200 and 100 V/cm using capillary with Ld of 10, 20, 30 and 40 cm. Separation conditions and calculations of koff are described in the Experimental Section under NECEEM Assays.
The reason for the discrepancy and poor reproducibility at shorter columns was not thoroughly investigated. One possibility would be Joule heating; however, heating would be expected to decrease half-life with increasing field. Furthermore, Ohm’s plots demonstrated no evidence of heating under any of the conditions used. Another possibility is that adsorption of the complex to the capillary distorted the complex peak shape; however, it is difficult to explain why this problem would lessen with longer capillaries. As discussed above, the modified equation used discounts the possibility of error due to differences in fluorescence when bound. Injection artifacts, which tend to distort electropherograms at short times more than longer ones, may play a role. Regardless of the source of the problem, the good agreement with FA results suggests that the NECEEM method yields accurate results; however, when using NECEEM it is worthwhile to test the method at different column lengths and electric fields to ensure accurate and precise results.
We next tested the NECEEM method on the GST-Fyn-SH3-SH2:Fluor-Fyn peptide complex. A representative electrophoretic trace from these experiments (Figure 3B) indicates the presence of two complexes as close observation of the complex zone reveals two incompletely resolved peaks rather than a single peak, thus confirming the conclusion from the FA experiment. It may be possible to modify the NECEEM calculation to obtain koffs in this situation; however, such a calculation would be complicated by incomplete resolution of the complexes and inability to distinguish peptide released from one complex versus the other. These results demonstrate that NECEEM is best suited for 1:1 binding systems.
3.3 High-speed CE Assay
Another way of measuring off-rate is to spike unlabeled peptide into an equilibrated mixture of complex and monitor the reaction mixture by continuous sampling and serial injection onto an electrophoresis capillary. Complex half-life can then be derived from the gradual decay in complex peak height over time. This method is similar to the FA method except the complex is monitored as a separated peak rather than by FA. To achieve rapid sampling after the unlabeled peptide was added, the system shown in Figure 1 was used. In this device, peptide is rapidly mixed with the reaction mixture while continually pumping sample into the flow-gate for serial injection onto the CE. Electropherograms were acquired at 7 s intervals with this system and the initial electropherogram was collected 7 s after initiation of reaction. This delay is due to the dead volume of the system and could be reduced with smaller capillaries.
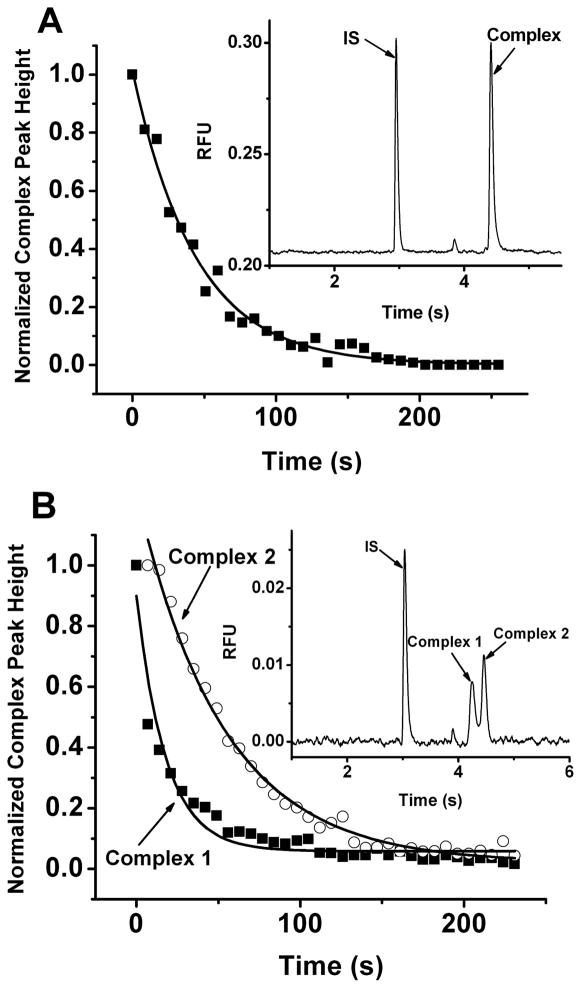
As shown in Figure 5A, the complex peak height versus time can be fit with a one-component exponential decay function to yield a t1/2 of 48.4 ± 11.1 s (n = 3) for the Fyn-SH2-SH3:Fluor-Fyn peptide complex in good agreement that determined by FA (53.5 s) and NECEEM (60 s). The RSD of the method is similar to the FA method, likely representing a problem with manual sample addition and mixing rather than the measurement methods per se, and worse than that obtained by NECEEM with 30 or 40 cm capillaries. These results show that on the 1:1 binding system, all methods give comparable results.
Figure 5.
Competition experiments using high-speed CE for the determination of t1/2 for Fyn-SH3-SH2 (A) and GST-Fyn-SH3-SH2 (B). Sample contained 500 nM Fyn-SH3-SH2 (A) or GST-Fyn-SH3-SH2 (B) and 200 nM Fluor-Fyn peptide with 50 μM unlabeled Fyn peptide added at t = 0 s. Injections were made every 7 s for 250 s. Separation conditions were described in the Experimental Section under High-speed CE Assays. Complex peak height was plotted versus time and fit to a one-phase exponential decay function. For GST-Fyn-SH3-SH2 (B), complex 1 (▪) and complex 2 (○) were plotted and fit separately. Representative electropherograms for each sample before dissociation are shown.
The FA and NECEEM assays suggested that when using GST-Fyn-SH2-SH3 as the protein multiple complexes were formed; therefore, we evaluated this system using rapid CE. As shown in Figure 5B, two distinct complexes were detected unlike the single complex detected with Fyn-SH2-SH3. Because the complexes were well resolved, it was possible to monitor their decay independently allowing determination that the first complex has t1/2 of 22.0 ± 2.7 s (n = 3) and the second complex has t1/2 of 58.8 ± 6.1 s (n = 3). The t1/2 of complex 2 is consistent with the 59.5 s determined by FA experiment. However, the CE assay yields a longer t1/2 for the other complex than the 3 s determined by fitting the FA decay data to a two component exponential decay. The CE measurement is likely to be more reliable because the complex was completely resolved and detected independently. A concern with the CE method is that dissociation of complex during the separation creates inaccuracies in the measurement; however, this is unlikely because of the short separation time compared to the measured complex half-lives. For example, for a t1/2 of 22 s, and a separation time of 3.8 s (migration time of the complex), only 2% of the complex is expected to dissociate over the course of separation. Although both FA and NECEEM gave evidence of two complexes for the GST-Fyn-SH3-SH2 binding system, only high-speed CE assay allowed the off-rate of each individual complex to be determined independently.
3.4 Mechanism of GST-Fyn-SH3-SH2 binding
The finding that two complexes exist for GST-Fyn-SH3-SH2 protein was unexpected because only the SH2 domain is expected to bind the peptide and the other domains in the construct are not expected to affect binding. To better understand this effect, we used the CE method to further study the complex.
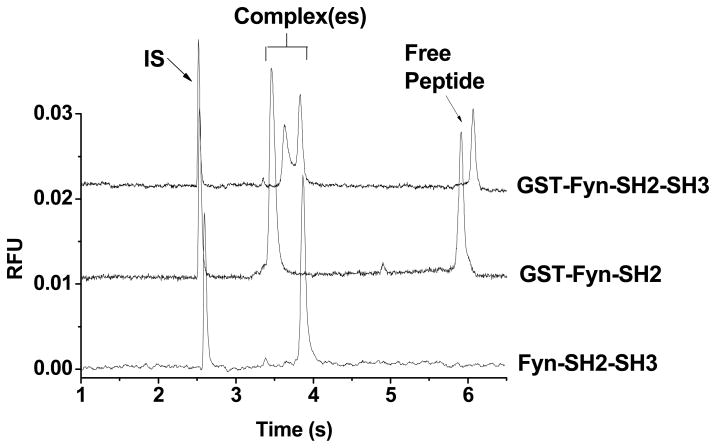
Two other Fyn constructs (GST-Fyn-SH2 and Fyn-SH2-SH3) were tested against the same peptide probe. Figure 6 shows that when either the SH3 domain or the GST moiety is absent, only one complex is detected, indicating that both GST tag and SH3 domain are required to form the two complexes. Different concentrations of GST-Fyn-SH2 (0.1 – 2 μM) or Fyn-SH2-SH3 (0.1 – 2 μM) and the peptide (50 – 700 nM) were tested and similar results were obtained, indicating that dual complexes were not detected at any protein or peptide concentration (data not shown).
Figure 6.
Comparison of three constructs of Fyn binding to Fluor-Fyn peptide. Sample contained 500 nM Fyn-SH2-SH3 (trace 1) or GST-Fyn-SH2 (trace 2) or GST-Fyn-SH2-SH3 (trace 3), 200 nM Fluor-Fyn peptide and 10 nM rhodamine 110. Separation conditions were the same as in Figure 4.
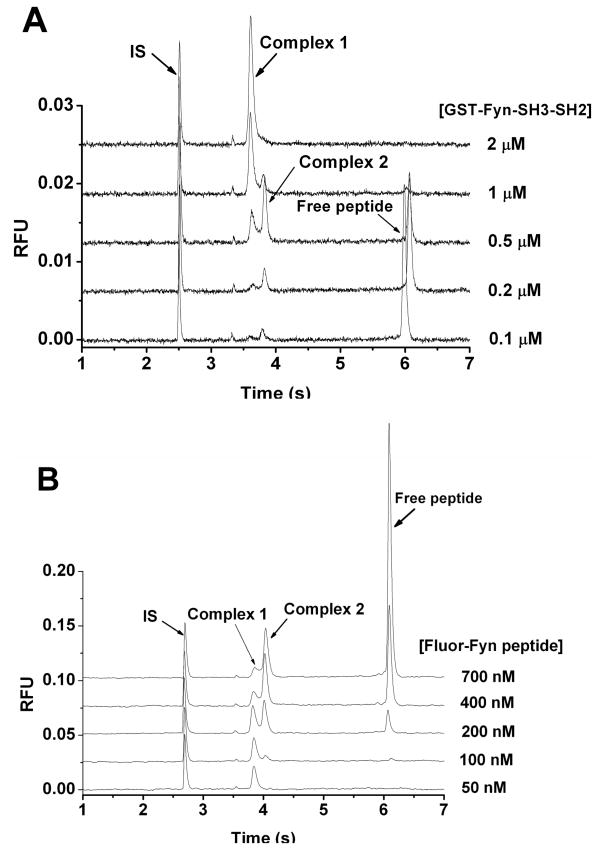
We next examined the concentration dependency of complex formation. GST-Fyn-SH3-SH2 concentration was varied from 0.1 μM to 2 μM while the concentration of Fluor-Fyn peptide was kept constant at 200 nM. Figure 7A shows that complex 2 increases when protein concentration is increased from 0.1 μM to 0.5 μM. However, it starts to decrease as complex 1 emerges and grows with increasing protein concentration. At protein concentration of 2 μM, representing a 10-fold excess over peptide, complex 2 is completely converted to complex 1. When peptide concentration is increased from 50 nM to 700 nM and protein concentration kept constant at 500 nM, complex 1 first increases then decreases and complex 2 keeps increasing (see Figure 7B). Thus, the ratio of the two complex peaks (complex 1-to-complex 2 ratio) decreases with increasing peptide concentration.
Figure 7.
GST-Fyn-SH3-SH2 binding assay using high-speed CE. (A) Sample contained 0.1–2 μM GST-Fyn-SH3-SH2, 200 nM Fluor-Fyn peptide and 10 nM rhodamine 110. (B) Sample contained 0.5 μM GST-Fyn-SH3-SH2, 50–700 nM Fluor-Fyn peptide and 10 nM rhodamine 110. Separation conditions were the same as in Figure 4.
This concentration dependency suggests the possibility of two binding sites on the protein, even though the peptide is only supposed to bind the SH2 domain of the GST-Fyn-SH3-SH2. Taking into account that both GST and SH3 domain are required in order to form two complexes in a concentration dependent manner, we hypothesize that the GST and SH3 domain work cooperatively to form a protein dimer that contains two SH2 domains and therefore is capable of associating with two peptide molecules. Dimerization of Fyn-SH2-SH3 has been reported previously.[30] Direct binding between purified SH2 and SH3 domain of Fyn was found and the binding was enhanced by the occupancy of either SH2 or SH3 domain with phosphotyrosyl or proline-rich peptide respectively.[30] In our hands, dimerization only occurs when GST is present. A second possibility is dimerization of GST, which has also been reported;[31, 32] however, we did not observe this effect with other GST fusion proteins previously tested [23] nor was it observed in this case without SH3 domain.
Based on this model, GST-Fyn-SH2-SH3 forms a dimer due to the intermolecular interaction between SH2 and SH3 domain as well as the two GST moieties. The resulting dimer contains two phosphotyrosyl peptide binding sites thus is capable of associating two peptide ligands. Complex 1 and complex 2 correspond to 2:1 complex and 2:2 complex (protein: peptide), respectively. Thus, as increasing peptide is added we see initially complex 1 (2 protein to 1 peptide) and then completely complex 2 (2 protein to 2 peptide). Likewise, as increasing protein is added, we observe a change from the 2:2 to the 2:1 complex. The binding of the second peptide molecule to the dimer molecule may stabilize the complex, which explains why the 2:1 complex has a faster dissociation rate than the 2:2 complex.
3.5 Comparison of FA, NECEEM and High-speed CE
In this study of peptide: protein binding, we observed that the FA method offers good temporal resolution for monitoring a dissociation reaction and a simple experimental method using commercially available instrumentation. The method was reliable for monitoring the 1:1 binding system; however, FA is unable to clearly discern the presence of multiple forms of complexes, which limits its application in the study of more complicated binding systems or sample in complex matrices. Although the observation that the dissociation curve for GST-Fyn-SH3-SH2 is fit better with a two-component exponential decay function indicates the possibility of two complexes, the lack of separation capability prevents straightforward measurement of half-lives for the two complexes and the possibility that the existence of one complex might affect the kinetics of the other is not excluded. Moreover, if the number of complexes in the system is increased to above two, the t1/2 measurement by fitting the data into multi-component exponential function becomes less reliable, especially when some complexes have similar t1/2.
NECEEM assays allow equilibrium and kinetic constants to be determined in a single experiment from area of free, bound and dissociated species. This method uses commercial instrumentation and had the simplest data analysis. Furthermore, it was the most reproducible method, which we attribute to using electrophoresis to initiate the dissociation rather than spiking and mixing in unlabeled peptide. However, the requirement of dissociation during separation presently limits its application to 1:1 binding systems. For a system containing more than one complex, it will be difficult to extract binding constants from a single measurement because dissociation of both complexes contributes to the area under the bridge between complex and free ligand and the contribution of each is indistinguishable. Another issue, addressed in this paper, is that assay reproducibility and reliability is dependent on the length of the separation capillary. In addition, other factors, such as protein adsorption could also affect the accuracy of NECEEM measurements and need to be avoided as much as possible.
High-speed CE is unique among the methods tested in that it was suitable for both 1:1 and more complicated binding systems by virtue of resolving the different complexes allowing them to be detected independently. This allowed half-life and concentration dependency of formation for multiple complexes to be readily detected helping to discern the mechanism of binding of Fyn-GST-SH2-SH3 with Fluoro-Fyn peptide. Moreover, since only complex peak height or area needs to be measured for koff calculation, fluorescence intensity change upon binding is not an issue and distorted peaks shapes due to adsorption of protein onto capillary inner surface can be ignored. The method does not have as good temporal resolution as the other methods; however, this may be improved with a more sophisticated fluidic system that minimizes the dead volume between sample and electrophoresis channel. The main limitation of this method is that the instrumentation is not commercially available.
4. Concluding Remarks
In this work we have validated the use of NECEEM and high-speed CE for dissociation kinetics by comparison to FA. All methods provide comparable results for 1:1 binding experiments so long as appropriate conditions are used. High-speed CE is particularly useful for more complex binding systems because it allows resolution and independent monitoring of complexes.
Acknowledgments
This work was supported by NSF grant CHE 0809013 (R.T.K.) and NIH grant R01 CA85368 (A.W.L.). The Protein Core of the Michigan Diabetes Research and Training Center is supported by NIH 5P60 DK20572 from the National Institute of Diabetes and Digestive and Kidney Diseases.
Abbreviations
- NECEEM
non-equilibrium capillary electrophoresis of equilibrium mixtures
- FA
fluorescence anisotropy
- GST
glutathione-S-transferase
- SH2
src homology 2
- SH3
src homology 3
- SPR
surface plasmon resonance
- Ld
Length from injection point to detection point
References
- 1.Katsamba PS, Park S, Laird-Offringa IA. Methods. 2002;26:95–104. doi: 10.1016/S1046-2023(02)00012-9. [DOI] [PubMed] [Google Scholar]
- 2.de Mol NJ, Dekker FJ, Broutin I, Fischer MJ, Liskamp RM. J Med Chem. 2005;48:753–763. doi: 10.1021/jm049359e. [DOI] [PubMed] [Google Scholar]
- 3.Zanier K, Charbonnier S, Baltzinger M, Nomine Y, Altschuh D, Trave G. J Mol Biol. 2005;349:401–412. doi: 10.1016/j.jmb.2005.03.071. [DOI] [PubMed] [Google Scholar]
- 4.Lynch BA, Loiacono KA, Tiong CL, Adams SE, MacNeil IA. Anal Biochem. 1997;247:77–82. doi: 10.1006/abio.1997.2042. [DOI] [PubMed] [Google Scholar]
- 5.Schust J, Berg T. Anal Biochem. 2004;330:114–118. doi: 10.1016/j.ab.2004.03.024. [DOI] [PubMed] [Google Scholar]
- 6.Heegaard NHH, Nilsson S, Guzman NA. J Chromatogr B. 1998;715:29–54. doi: 10.1016/s0378-4347(98)00258-8. [DOI] [PubMed] [Google Scholar]
- 7.Heegaard NH, Kennedy RT. Electrophoresis. 1999;20:3122–3133. doi: 10.1002/(SICI)1522-2683(19991001)20:15/16<3122::AID-ELPS3122>3.0.CO;2-M. [DOI] [PubMed] [Google Scholar]
- 8.Rundlett KL, Armstrong DW. Electrophoresis. 2001;22:1419–1427. doi: 10.1002/1522-2683(200105)22:7<1419::AID-ELPS1419>3.0.CO;2-V. [DOI] [PubMed] [Google Scholar]
- 9.Gong MJ, Wehmeyer KR, Limbach PA, Heineman WR. Electrophoresis. 2007;28:837–842. doi: 10.1002/elps.200600398. [DOI] [PMC free article] [PubMed] [Google Scholar]
- 10.Fu H, Guthrie JW, Le XC. Electrophoresis. 2006;27:433–441. doi: 10.1002/elps.200500460. [DOI] [PubMed] [Google Scholar]
- 11.Avila LZ, Chu YH, Blossey EC, Whitesides GM. J Med Chem. 1993;36:126–133. doi: 10.1021/jm00053a016. [DOI] [PubMed] [Google Scholar]
- 12.Chu YH, Avila LZ, Gao JM, Whitesides GM. Acc Chem Res. 1995;28:461–468. [Google Scholar]
- 13.Berezovski M, Krylov SN. J Am Chem Soc. 2002;124:13674–13675. doi: 10.1021/ja028212e. [DOI] [PubMed] [Google Scholar]
- 14.Krylov SN. Electrophoresis. 2007;28:69–88. doi: 10.1002/elps.200600577. [DOI] [PubMed] [Google Scholar]
- 15.Okhonin V, Petrov AP, Berezovski M, Krylov SN. Anal Chem. 2006;78:4803–4810. doi: 10.1021/ac060108i. [DOI] [PubMed] [Google Scholar]
- 16.Moore AW, Jr, Jorgenson JW. Anal Chem. 1993;65:3550–3560. doi: 10.1021/ac00072a004. [DOI] [PubMed] [Google Scholar]
- 17.Larmann JP, Jr, Lemmo AV, Moore AW, Jr, Jorgenson JW. Electrophoresis. 1993;14:439–447. doi: 10.1002/elps.1150140169. [DOI] [PubMed] [Google Scholar]
- 18.Moore AW, Jorgenson JW. Anal Chem. 1995;67:3448–3455. doi: 10.1021/ac00115a013. [DOI] [PubMed] [Google Scholar]
- 19.Bushey MM, Jorgenson JW. Anal Chem. 1990;62:161–167. doi: 10.1021/ac00201a015. [DOI] [PubMed] [Google Scholar]
- 20.Jameson EE, Cunliffe JM, Neubig RR, Sunahara RK, Kennedy RT. Anal Chem. 2003;75:4297–4304. doi: 10.1021/ac0342976. [DOI] [PubMed] [Google Scholar]
- 21.Resh MD. Int J Biochem Cell Biol. 1998;30:1159–1162. doi: 10.1016/s1357-2725(98)00089-2. [DOI] [PubMed] [Google Scholar]
- 22.Shirazi SK, Wood JG. Neuroreport. 1993;4:435–437. doi: 10.1097/00001756-199304000-00024. [DOI] [PubMed] [Google Scholar]
- 23.Yang PL, Whelan RJ, Jameson EE, Kurzer JH, Argetsinger LS, Carter-Su C, Kabir A, Malik A, Kennedy RT. Anal Chem. 2005;77:2482–2489. doi: 10.1021/ac048307u. [DOI] [PubMed] [Google Scholar]
- 24.Shackman JG, Watson CJ, Kennedy RT. J Chromatogr A. 2004;1040:273–282. doi: 10.1016/j.chroma.2004.04.004. [DOI] [PubMed] [Google Scholar]
- 25.Bowser MT, Kennedy RT. Electrophoresis. 2001;22:3668–3676. doi: 10.1002/1522-2683(200109)22:17<3668::AID-ELPS3668>3.0.CO;2-M. [DOI] [PubMed] [Google Scholar]
- 26.Hooker TF, Jorgenson JW. Anal Chem. 1997;69:4134–4142. [Google Scholar]
- 27.Lakowicz JR. Principles of Fluorescence Spectroscopy. Kluwer Academic/Plenum; New York: 1999. [Google Scholar]
- 28.Berezovski M, Nutiu R, Li YF, Krylov SN. Anal Chem. 2003;75:1382–1386. doi: 10.1021/ac026214b. [DOI] [PubMed] [Google Scholar]
- 29.Okhonin V, Krylova SM, Krylov SN. Anal Chem. 2004;76:1507–1512. doi: 10.1021/ac035259p. [DOI] [PubMed] [Google Scholar]
- 30.Panchamoorthy G, Fukazawa T, Stolz L, Payne G, Reedquist K, Shoelson S, Songyang Z, Cantley L, Walsh C, Band H. Mol Cell Biol. 1994;14:6372–6385. doi: 10.1128/mcb.14.9.6372. [DOI] [PMC free article] [PubMed] [Google Scholar]
- 31.Parker MW, Lo Bello M, Federici G. J Mol Biol. 1990;213:221–222. doi: 10.1016/s0022-2836(05)80183-4. [DOI] [PubMed] [Google Scholar]
- 32.Ji X, Zhang P, Armstrong RN, Gilliland GL. Biochemistry. 1992;31:10169–10184. doi: 10.1021/bi00157a004. [DOI] [PubMed] [Google Scholar]


