

Abstract
The insulin-linked polymorphic region (ILPR) of the human insulin gene promoter region forms G-quadruplex structures in vitro. Previous studies show that insulin and insulin-like growth factor-2 (IGF-2) exhibit high affinity binding in vitro to 2-repeat sequences of ILPR variants a and h, but negligible binding to variant i. Two-repeat sequences of variants a and h form intramolecular G-quadruplex structures that are not evidenced for variant i. Here we report on the use of protein digestion combined with affinity capture and MALDI-MS detection to pinpoint ILPR binding sites in insulin and IGF-2. Peptides captured by ILPR variants a and h were sequenced by MALDI-MS/MS, LC-MS and in silico digestion. On-bead digestion of insulin-ILPR variant a complexes supported the conclusions. The results indicate that the sequence VCG(N)RGF is generally present in the captured peptides and is likely involved in the affinity binding interactions of the proteins with the ILPR G-quadruplexes. The significance of arginine in the interactions was studied by comparing the affinities of synthesized peptides VCGERGF and VCGEAGF with ILPR variant a. Peptides from other regions of the proteins that are connected through disulfide linkages were also detected in some capture experiments. Identification of binding sites could facilitate design of DNA binding ligands for capture and detection of insulin and IGF-2. The interactions may have biological significance as well.
Introduction
The insulin-linked polymorphic region (ILPR) is located in the promoter region of the human insulin gene, which is adjacent to the IGF-2 gene. The ILPR contains tandem repeats of closely related, G-rich sequences that are 14–15 bases in length [1–19]. A dozen or so ILPR variant sequences have been identified, the most common of which is variant a (5′-ACAG4TGTG4-3′). Oligonucleotides containing two or more repeats of some variants including variants a and h have been shown to form intramolecular G-quadruplex structures in vitro [4–8]. The ILPR has been the subject of numerous studies linking it to regulation of the insulin and IGF-2 genes and type 1 diabetes susceptibility [9–19].
We previously reported that insulin exhibits high affinity binding in vitro through its β-chain to the intramolecular G-quadruplex formed by a 2-repeat variant a oligonucleotide [20]. We subsequently observed that IGF-2 also exhibits high affinity binding to this oligonucleotide and investigated the affinity binding interactions of insulin and IGF-2 with oligonucleotides comprising 2-repeat sequences of ILPR variants a, h and i (ILPRa, ILPRh and ILPRi, respectively) using affinity Matrix Assisted Laser Ionization Desorption Mass Spectrometry (affinity MALDI-MS) and Surface Plasmon Resonance (SPR) [7].
In the present work, we used two different methods to determine the location of the binding site in insulin and IGF-2 for the G-quadruplexes formed by ILPRa and ILPRh. Both methods employed affinity capture of peptides produced by enzymatic digestion of insulin and IGF-2 or of synthetic peptides. In one method, the ILPR oligonucleotides were covalently immobilized on fused silica MALDI probe surfaces as previously described [21,22] and captured peptides were analyzed directly on the surface using MALDI-TOF-MS. In the second method, biotinylated ILPR oligonucleotides were incubated with the protein digests or synthetic peptides, followed by capture of the oligonucleotides and any associated peptides on streptavidin-coated beads. Additionally, insulin and IGF-2 complexes with ILPRa were captured on the beads followed by on-bead digestion and MALDI-MS analysis of the peptides remaining in the captured complexes. In both bead experiments, the captured peptides were eluted from the beads and sequenced using both MALDI-TOF/TOF-MS/MS and in silico digestion of insulin and IGF-2. The importance of arginine in the binding interaction was probed by using synthetic peptides in which the arginine was replaced by the alanine.
Experimental
Materials
PBS buffer (phosphate buffer-saline, 10 mM potassium phosphate buffer, 150 mM potassium chloride, pH 7.32), solvents, alpha-cyano-4-hydroxycinnamic acid (CHCA), 6-aza-2-thiothymine (ATT), ammonium hydrogen carbonate and dithiolthreitol (DTT) were from Sigma (St. Louis, MO). Recombinant human proteins including insulin, IGF-2 and chymase were from Sigma. Peptides VCGERGF and VCGEAGF (referred to hereinafter as Peptide R and Peptide A, respectively) were synthesized by 21st Century Biochemicals (Marlboro, MA). Oligonucleotides that were either thiol-modified or biotinylated at the 5′-end were synthesized by Eurogentec (San Diego, CA). The oligonucleotides included ILPRa (5′-(ACAGGGGTGTGGGG)2-3′), ILPRh (5′-(ACAGGGGTGTGGGC)2-3′) and ILPRi (5′-(ACAGGGTCCTGGGG)2-3′). Streptavidinated magnetic beads (M-280 Dyna beads) were from Invitrogen (Oslo, Norway).
Chymase digestion of insulin and IGF-2
Insulin and IGF-2 solutions (10 μM in PBS buffer for affinity MALDI MS, LC-MS and 5 μM in PBS buffer for the affinity bead capture) were incubated with chymase (0.37 μM) at 37 °C for 30 min. The chymase cleavage sites in insulin and IGF-2 are shown in Figure 1. The preferential cleavage order is: Phe (F)-|-Xaa > Tyr (Y)-|-Xaa > Trp (W)-|-Xaa > Leu (L)-|-Xaa (where X is any amino acid) [23].
Figure 1.
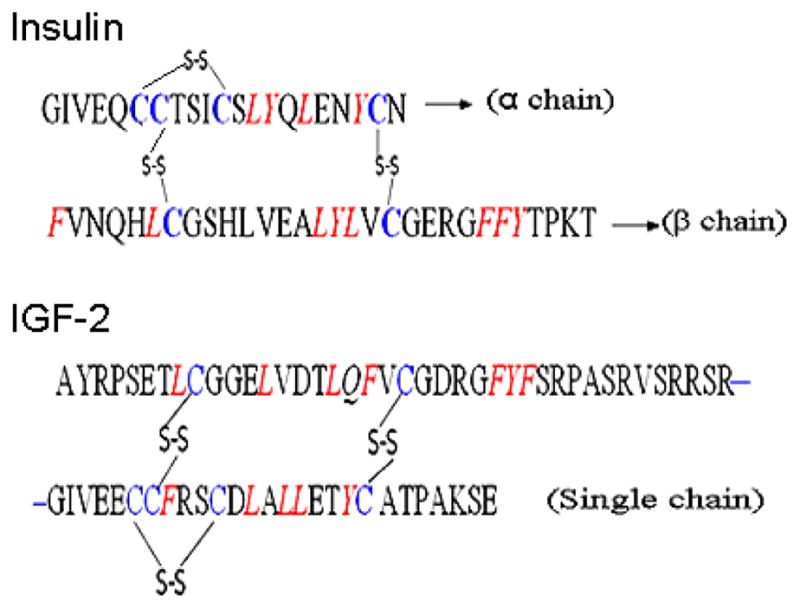
Peptide sequences of insulin and IGF-2. Chymase cleavage sites are indicated in red and cleavage occurs on the C-terminus side of the site. Cysteines crosslinked with disulfide bonds are in blue.
Peptide capture and analysis on ILPR oligonucleotide-modified MALDI probes
The 5′-thiol modified DNA oligonucleotides were covalently attached to fused silica MALDI probe chips (20 mm × 20 mm × 0.75 mm, Valley Design, Westford, MA) through a covalent linker as previously described [7,20–22]. Immediately prior to surface attachment, oligonucleotides were heated to 95 °C for 5 min to melt any intermolecular and intramolecular structures and then cooled to room temperature in the presence of K+ ion [7].
For peptide capture, unless otherwise noted, 1 μL of peptide sample was incubated on each oligonucleotide-coated spot at room temperature for 30 min. Chips were then rinsed with deionized water for 30 s to remove any weakly bound or unbound peptides and dried under nitrogen gas. This incubation-rinse cycle was repeated two more times, each with a new 1 μL aliquot of sample, to concentrate captured peptide at the surface. MALDI matrix (a mixture of equal parts saturated CHCA solution containing 0.3% trifluoroacetic acid and water) was then applied to the spot and allowed to crystallize. The chip was then mounted on a custom aluminum MALDI target and each spot was analyzed by MALDI-TOF-MS using a Bruker AutoFlex II instrument (Billerica, MA). After use the spots were rinsed with 50% acetonitrile in water to remove the MALDI matrix, peptides and any concomitants. PBS buffer was applied to the surface to reconstitute it prior to reuse. Surfaces were periodically tested for sample carryover, contamination and degradation of the oligonucleotide-modified surface by MALDI-MS in the absence of applied sample. In no case was any carryover, contamination or degradation indicated.
Peptide capture on streptavidinated beads and MS analysis of captured peptides
For the affinity bead experiments, the peptides first were incubated with the 5′-biotinylated DNA oligonucleotides in solution. The solutions were then incubated with the streptavidinated beads to capture the biotinylated oligonucleotides and their associated peptides. As described above for the affinity MALDI-MS experiments, prior to use the oligonucleotides were heated and then cooled in the presence of K+ to promote intramolecular G-quadruplex formation.
After digestion of insulin or IGF-2 by chymase, biotinylated ILPRa or ILPRh was incubated with the protein digest solution (concentration ratio 1:1 DNA:intact protein) at room temperature for 30 min in a shaker. The solution was then transferred to a solution of the streptavidinated beads (10 mg/mL) and incubated at room temperature for 30 min in a shaker [24]. The solution contained 200 pmol of biotinylated ILPR variant per mg bead. The beads were then rinsed with PBS buffer to remove weakly associated and unbound peptides and sample concomitants. Captured peptides were then eluted from the oligonucleotides by incubating with 5% formic acid solution for 10 min at room temperature in a shaker. The supernatant in formic acid was mixed with the CHCA MALDI matrix at 1:1 volume ratio. 1 μL of this mixture was applied to an aluminum MALDI probe, allowed to crystallize and analyzed by MALDI-TOF-MS. The same procedure was used for the affinity capture studies of the synthesized peptides R and A, except that instead of protein digest, the incubation solution contained 5 μM peptide R and/or peptide A and 5 μM biotinylated ILPRa.
For the complex formation studies of peptides A and R with ILPRa, a mixture of 50 μM each of biotinylated ILPRa and peptide R or A was incubated at RT in a shaker for 30 min. A 1 μL aliquot of the mixture was applied onto the aluminum MALDI probe and 1 μL of MALDI matrix (saturated ATT solution with 10 mM NH4HCO3 dissolved in ACN) was then applied. The MALDI probe was mounted and each spot analyzed by MALDI-TOF-MS using a Bruker AutoFlex II instrument (Billerica, MA) in negative ion detection mode.
For studies of intact protein complexation with ILPRa followed by on-bead digestion of the proteins in the captured complexes, insulin or IGF-2 was first incubated with the 5′-biotinylated ILPRa in solution (concentration ratio 1:1 DNA:intact protein) at RT for 30 min in a shaker. The solution was then mixed with a solution of the streptavidinated beads (10 mg/mL) and incubated at RT for 30 min in a shaker [24]. After that, chymase was added to the beads to digest the captured insulin or IGF-2 at 37 °C for 30 min. The beads were then rinsed with PBS buffer to remove weakly associated and unbound peptides and sample concomitants, and the remaining, captured peptides were released from the beads and analyzed by MALDI-TOF-MS as described above.
MS/MS analysis of peptides by MALDI-TOF/TOF-MS/MS, LC-MS/MS and in silico digestion
For MALDI-TOF/TOF-MS/MS analysis, equal volumes of protein digest and the CHCA MALDI matrix were mixed and 1–1.5 μL of the mixture was applied to the aluminum MALDI probe, allowed to crystallize, and analyzed using LIFT detection and positive modes. The following were the high voltage settings for Post Source Decay (PSD): Ion source 1: 8 kV; Ion source 2: 7.2 kV; Lens: 3.6 kV; reflector: 13.86 kV; LIFT 1: 19 kV; LIFT 2: 3.1 kV.
The sample was analyzed by MALDI-TOF/TOF-MS/MS using a Bruker UltraFlex III instrument (Billerica, MA). In silico digestion was performed using online software “Protein Prospector” from the website of University of California, San Francisco with the following search parameters: Database: user protein; Digest: chymotrypsin; Variable Modification: none; Min peptide length: 3; Max missed cleavages: 5. Chymotrypsin was used since chymase digestion is not available for the in silico digestion. Chymase and chymotrypsin cleave insulin and IGF-2 at the same amino acids and so the substitution is valid.
For peptide sequencing by LC-MS/MS, 5 μL protein digest was loaded into the Agilent Zorbax SB-C18 capillary column (particle size: 5 μm; ID: 0.52 mm; length: 150 mm) by Agilent 1200 Series nano-flow LC system (Palo Alto, CA), with flow rate of 30 μL/min at 4 °C. The elution time was set to 40 min, including 25 min for gradient elution, starting at 5% ACN in 0.5% formic acid aqueous solution and ending at 80% ACN, followed by a washing column with 80% ACN for 5 min and then 10 min to return the mobile phase back to 5% ACN. Peptides were ionized under ESI mode and detected by a LTQ-Orbitrap instrument (Thermo Scientific, USA). Two scan events were set up for insulin and IGF-2 peptide fragmentation under MS2 and MS3 scan mode. Settings for the first scan event were: FTMS analyzer; normal mass range; resolution, 60000; scan type, full; polarity, positive; MS/MS on 677.62 (3+) for insulin peptide and 665.97 (3+) for IGF-2 peptide; CID: 36eV. Settings for the second scan event were: FTMS analyzer; normal mass range; resolution, 30000; data dependent scan for MS/MS: most intense ion selected from first scan event; CID: 35ev; minimum signal required: 1000.
Results
Insulin and IGF-2 peptide complexes with biotinylated ILPR oligonucleotides captured on streptavidinated beads
Figure 2 (top) shows the MALDI-TOF spectra of insulin digest peptides released from the ILPRa complexes after capture on the streptavidinated beads. Figure 2 (bottom) shows the MALDI-TOF mass spectrum of the total insulin peptide digest. For ILPRa, there is significant capture of an insulin peptide at m/z 1027 and indication of capture of a peak at m/z 880 as well. By comparing results of in silico digestion of insulin and peptide sequencing of the peaks in Figure 2 (top) using MALDI-TOF/TOF analysis of m/z 1027 (Supplementary Figure S1) and m/z 880 (not shown), we obtained the sequences LVCGERGFF and LVCGERGF, respectively. While the evidence for m/z 880 has relatively high uncertainty, its sequence is consistent with chymase cleavage to remove the Phe (F) at the C-terminus of the peptide corresponding to the peak at m/z 1027, and so its presence or absence does not change the overall conclusions regarding binding sequences.
Figure 2.

MALDI-MS of insulin peptides eluted from biotinylated ILPRa (top) after capture of the oligonucleotides and associated peptides on streptavidinated beads and total insulin peptide digest profile (bottom).
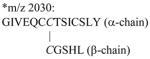
For ILPRh, the spectrum of insulin peptides released from the complexes after capture on the streptavidinated beads (Figure 3A (top)) showed only one peak, at m/z 2030. Based on results of in silico digestion of insulin, there is no peptide corresponding to m/z 2030; however, the Peptide Sequence Editor indicates that it could correspond to peptides GIVEQCCTSICSLY (m/z 1518) and CGSHL (m/z 515) crosslinked by the disulfide bond formed between the second cysteine of GIVEQCCTSICSLY and the cysteine of CGSHL. This is supported by the spectra of the insulin digest without and with DTT treatment to destroy the disulfide bonds (Supplementary Figure S2), which show the disappearance of the peak at m/z 2030 after DTT treatment. Further support is provided by the MALDI-TOF/TOF spectrum of the peak at m/z 2030 (Figure 3B) and by the LC-MS/MS spectrum (Supplementary Figure S3).
Figure 3.

(A) MALDI-MS of insulin peptides eluted from biotinylated ILPRh (top) and ILPRi (bottom) after capture of the oligonucleotides and associated peptides on streptavidinated beads. (B) MALDI-TOF/TOF-MS/MS of insulin peptide at 2030 m/z and the results of peptide sequencing.
No peaks were evident for insulin peptides after incubation with ILPRi and capture on the streptavidinated beads (Figure 3A (bottom)), indicating the absence of complex formation between ILPRi and insulin peptides. This is consistent with previous work that showed no evidence of affinity interaction between intact insulin protein and ILPRi, which does not form the G-quadruplex structure evidence for ILPRa and ILPRh in the CD spectra [7].
Figure 4A (top) shows the MALDI-MS spectra of IFG-2 digest peptides released from the ILPRa complexes after capture on the streptavidinated beads. Figure 4A (bottom) shows the MALDI-TOF mass spectrum of the IGF-2 peptide digest. For IGF-2 with ILPRa, there are peaks at m/z 1191, m/z 1649 and m/z 1994. By comparing results of in silico digestion of IGF-2 and peptide sequencing using MS/MS analysis of m/z 1191 (Supplementary Figure S4), we obtained the sequences QFVCGDRGFY. Based on the results of in silico digestion of IGF-2, there are no peptides corresponding to either m/z 1649 or m/z 1995. We therefore looked further into the structure of IGF-2 and considered the possibility that the disulfide bonds could contribute to the peptide mass. The addition of a sulfur atom to the peptide with m/z 1617 with sequence VDTLQFVCGDRGFY would account for the peak at m/z 1649. The peak at m/z 1995 could correspond to peptides of QFVCGDRGFY (m/z 1191) and CATPAKSE (m/z 805) with two cysteines crosslinked by disulfide bonds, as indicated by the Peptide Sequence Editor. DTT treatment of the IGF-2 digest to destroy disulfide bonds showed that DTT caused the disappearance of the peaks at m/z 1649 and m/z 1995 (Supplementary Figure S5), which is consistent with the presence of disulfide bonds in the captured peptides corresponding to these peaks. Further support is provided by the MALDI-TOF/TOF spectrum (Figure 4B) and the LC-MS/MS spectrum (Supplementary Figure S8) of the peak at m/z 1994. MALDI-MS/MS analysis of the peak at m/z 1649 supports the presence of disulfide bond (Supplementary Figure S7) in the proposed structure. For IGF-2 with ILPRh, there is only the single peak at m/z 1995 (Supplementary Figure S8, top). As was the case for insulin, no peaks are evident in the spectrum for ILPRi (Supplementary Figure S8, bottom), again consistent with the previously reported absence of affinity interactions between intact IGF-2 and ILPRi [7].
Figure 4.

(A) MALDI-MS of IGF-2 peptides eluted from biotinylated ILPRa (top) after capture of the oligonucleotides and associated peptides on streptavidinated beads and total IGF-2 peptide digest profile (bottom). (B) MALDI-TOF/TOF-MS/MS of IGF-2 peptide at 1994 m/z and results of peptide sequencing.
Affinity capture of insulin and IGF-2 peptides on ILPR-modified MALDI probe surfaces
Results for capture of insulin digest peptides on ILPR-modified MALDI probe surfaces are shown in Supplementary Figure S9. For ILPRa (Supplementary Figure S9, top) there is only one peak, at m/z 3414, which may correspond to the insulin β-chain (FVNQHLCGSHLVEALYLVCGERGFFYTPKT, MW 3431) with the loss of 17 mass units. Previous work has shown that insulin binds to ILPRa through the β-chain [20] and it is possible that any remaining β-chain after digestion preferentially binds to the surface-immobilized ILPRa. For ILPRh (Supplementary Figure S9, bottom), there is a single peak at m/z 880, which was also suggested for ILPRa complexation with insulin peptides (Figure 2, top) and corresponds to sequence LVCGERGF. No peaks were observed for ILPRi (not shown).
Results for capture of IGF-2 digest peptides on ILPR-modified MALDI probe surfaces are shown in Supplementary Figure S10. For ILPRa (Supplementary Figure S10, top), there are peaks at m/z 1191 and m/z 1617. Based on the results of in silico digestion and peptide sequencing already discussed for the affinity bead studies, m/z 1191 corresponds to QFVCGDRGFY and m/z 1617 corresponds to VDTLQFVCGDRGFY; both of these peptides contain the common sequence of VCG(N)RGF. For ILPRh (Supplementary Figure S10, bottom) there is the peak at m/z 1191 corresponding to QFVCGDRGFY as well as peaks at m/z 1163 and m/z 1396. Results of in silico digestion indicate peptides with sequences of RPSETLCGGEL and AYRPSETLCGGEL, respectively. No further sequencing was performed on these peaks, which were also captured on ILPRi spots (not shown) and likely associate through different binding mechanisms, possibly nonspecific, that do not involve the intramolecular G-quadruplex of ILPRa and ILPRh.
On-bead capture and digestion of intact insulin and IGF-2 complexed with biotinylated ILPRa
In order to compare capture of protein digest peptides discussed above with capture of intact proteins followed by digestion, insulin and IGF-2 were incubated with biotinylated ILPRa, followed by capture of the ILPRa and ILPRa-protein complexes on the streptavidinated beads. The captured proteins were then subjected to chymase digestion directly on the beads. The free peptides were then removed by washing and the remaining peptides still associated with the ILPRa were released and analyzed by MALDI-TOF. The results (Supplementary Figure S11) indicate a peptide with m/z 3348 for insulin and a peptide with m/z 1191 for IGF-2. Although there was insufficient protein recovered in these experiments for further sequencing, the insulin peptide most likely corresponds to a large portion of the β-chain and is consistent with the capture of a slightly larger peptide (m/z 3414) at the ILPRa-modified MALDI probe surface (Supplementary Figure S9, top). The IGF-2 peptide corresponds to the sequence QFVCGDRGFY that was detected in the other capture experiments as well. These experiments support the involvement of the common sequence VCG(N)RGF in the binding interaction of ILPRa with both proteins and also confirms the strong association of the insulin β-chain with ILPRa.
Importance of arginine in the binding interactions
It has been reported in the literature that arginine plays a role in interactions between proteins and G-quadruplex DNA structures [25]. Since the insulin and IGF-2 peptides captured on the ILPR G-quadruplexes in this work contain arginine in the common sequences, we compared binding of the peptide VCGERGF (“peptide R”) and VCGEAGF (“peptide A”) in which the arginine is replaced by alanine. The results are shown in Figure 5A for capture of the two peptides by biotinylated ILPRa using the affinity bead procedure. Capture is greater for peptide R compared to peptide A. We also studied complex formation between ILPRa and the two peptides in solution using MALDI-MS in negative ionization mode to detect the DNA and its complexes. The results (Figure 5B) indicate that only R forms a complex with ILPRa and peptide R shows greater affinity binding to ILPRa, supporting the importance of arginine in the binding interaction. In order to determine whether the effect is due to direct interactions between arginine and the ILPR G-quadruplex or to the effects of arginine on the overall conformation of the peptide, we collected CD spectra of the two peptides. The results (not shown) indicate that there is no significant conformational difference between the peptides, suggesting that arginine is directly involved in the interaction with the oligonucleotides. This does not mean that conformation does not play a role in the binding of the intact proteins or their peptides with the G-quadruplexes, rather, it indicates the likelihood that the conformation of the protein or peptide facilitates contact between arginine and the G-quadruplex.
Figure 5.

(A) Relative affinity MALDI-MS capture and detection of peptide R and peptide A on ILPRa-modified surface. (B) Complex formation between peptide R (top) and peptide A (bottom) and ILPRa determined in negative ion mode for MALDI-MS detection of ILPRa and its peptide complexes.
Discussion
Tables 1 and 2 summarize the peptide sequences that correspond to the peaks in the various capture experiments. The sequence VCG(N)RGF is common to all of the insulin and IGF-2 peptides captured by ILPRa. It is present in some but not all of the peptides captured by ILPRh. IGF-2 with ILPRh also shows nonspecific capture of peptides that are also captured by ILPRi. We conclude from these results that the sequence VCG(N)RGF plays a key role in the affinity binding of insulin and IGF-2 proteins with the G-quadruplexes formed by ILPRa and ILPRh, and that the specificity is greater for ILPRa than ILPRh. Figure 6 shows the location of the common peptide in the protein structures. The sequence is contained in the insulin β-chain, and previous work has shown that the affinity interactions between insulin and ILPRa occur through the β-chain [20]. The results indicate the direct participation of the arginine in the common peptide in the affinity binding interactions.
Table 1.
Results for affinity bead capture of insulin and IGF-2 peptide complexes with ILPR oligonucleotides.
| ILPR Oligonucleotide | ||
|---|---|---|
| ILPR a | ILPR h | |
| Insulin peptides | m/z 880: LVCGERGF m/z 1027: LVCGERGFF |
 |
| IGF-2 peptides |
§ m/z 1191: QFVCGDRGFY m/z 1650: VDTLQFVCGDRGFY+S |
|
Indictates two strands connected by disulfide linkage between italicized cysteines (C).
Also recovered from on-bead digestion.
Table 2.
Results for affinity capture of insulin and IGF-2 peptides by ILPR-modified surfaces in affinity MALDI-TOF-MS.
| ILPR Oligonucleotide | ||
|---|---|---|
| ILPR a | ILPR h | |
| Insulin peptides | m/z 3414: FVNQHLCGSHLVEALYLVCGERGFFYTPKT-NH2 | m/z 880: LVCGERGF |
| IGF-2 peptides | m/z 1191: QFVCGDRGFY m/z 1617: VDTLQFVCGDRGFY |
m/z 1191: QFVCGDRGFY * m/z 1163: RPSETLCGGEL * m/z 1396: YRPSETLCGGEL |
not sequenced, also captured by ILPRi
Figure 6.

Location of common sequence VCG(N)RGF (in blue) in insulin (left) and IGF-2 (right). Other possible binding sites are in bold and red. Graphs were created by the WebMol viewer software in the RCSB Protein Data Bank website (http://www.rcsb.org/pdb/home/home.do).
It is interesting to consider the effects of ILPR immobilization and pre-capture protein digestion vs. post-capture protein digestion on the results. For insulin with ILPRh and IGF-2 with both ILPRa and ILPRh, the main difference between complexation in solution vs. capture on immobilized ILPR is the presence of disulfide linkages in some of the peptides detected in the solution complexes but not in the peptides captured on the immobilized ILPR. A likely explanation is that immobilized ILPR will be constrained both in terms of possible conformations as well as modes of interaction with the peptides compared to free ILPR in solution. It should be noted that the constrained model is a more accurate model for the chromosomal ILPR and may therefore be a better predictor of possible interaction in live cells. Interestingly, in the case of insulin with ILPRa, almost the entire β-chain is captured when (1) the ILPRa is incubated with intact insulin prior to digestion and apparently protected from digestion, and (2) when insulin peptides are captured by immobilized ILPRa at the MALDI probe surface. This anomalous behavior is consistent with previous work indicating at least two interaction modes between insulin and ILPRa, one with a KD on the order of 10−7 M and the other with a KD on the order of pM, while insulin with ILPRh and IGF-2 with both ILPRa and ILPRh have single interaction modes with KDs on the order of 10−8–10−9 M [7]. Further studies are underway to model the binding interactions, including the effects of constraints due to DNA immobilization, and explore other variants of the ILPR sequence.
Conclusion
Knowledge of the affinity binding site in insulin and IGF-2 for G-quadruplexes formed by the ILPR oligonucleotides offers new insight into these interactions that could be used to design affinity reagents as well as increasing our understanding of the specificity of G-quadruplex-protein interactions. The binding interactions of the insulin and IGF-2 proteins or peptides with the ILPR G-quadruplexes may have biological significance, for example in regulation of the insulin and IGF-2 genes, and warrant further study.
Supplementary Material
Acknowledgments
The authors thank Dr. Dmitri Zagorevski, Director of the Proteomics Core Facility of the Center for Biotechnology and Interdisciplinary Studies at Rensselaer Polytechnic Institute, for his technical support and helpful advice.
Funding
This work was funded in part by the National Institutes of Health (1 R21 DK 70762).
Footnotes
Publisher's Disclaimer: This is a PDF file of an unedited manuscript that has been accepted for publication. As a service to our customers we are providing this early version of the manuscript. The manuscript will undergo copyediting, typesetting, and review of the resulting proof before it is published in its final citable form. Please note that during the production process errors may be discovered which could affect the content, and all legal disclaimers that apply to the journal pertain.
References
- 1.Bell GI, Karam JH, Rutter WJ. Polymorphic DNA region adjacent to the 5′ end of the human insulin gene. Proc Natl Acad Sci USA. 1981;78:5759–5763. doi: 10.1073/pnas.78.9.5759. [DOI] [PMC free article] [PubMed] [Google Scholar]
- 2.Bell GI, Selby MJ, Rutter WJ. The highly polymorphic region near the human insulin gene is composed of simple tandemly repeating sequences. Nature. 1982;295:31–35. doi: 10.1038/295031a0. [DOI] [PubMed] [Google Scholar]
- 3.Ullrich A, Dull TJ, Gray A, Philips JA, Peter S. Variation in the sequence and modification state of the human insulin gene flanking regions. Nucl Acids Res. 1982;10:2225–2240. doi: 10.1093/nar/10.7.2225. [DOI] [PMC free article] [PubMed] [Google Scholar]
- 4.Hammond-Kossack MC, Docherty K. A consensus repeat sequence from the human insulin gene linked polymorphic region adopts multiple quadriplex DNA structures in vitro. FEBS Lett. 1992;301:79–82. doi: 10.1016/0014-5793(92)80214-2. [DOI] [PubMed] [Google Scholar]
- 5.Hammond-Kossack MC, Dobrinski B, Lurz R, Docherty K, Kilpatrick MW. The human insulin gene linked polymorphic region exhibits an altered DNA structure. Nucl Acids Res. 1992;20:231–236. doi: 10.1093/nar/20.2.231. [DOI] [PMC free article] [PubMed] [Google Scholar]
- 6.Hammond-Kossack MC, Kilpatrick MW, Docherty K. Analysis of DNA structure in the human insulin gene-linked polymorphic region in vivo. J Mol Endocrinol. 1992;9:221–225. doi: 10.1677/jme.0.0090221. [DOI] [PubMed] [Google Scholar]
- 7.Xiao J, Carter JA, Frederick KA, McGown LB. A genome-inspired DNA ligand for the affinity capture of insulin and insulin-like growth factor-2. J Sep Sci. 2009;32:1654–1664. doi: 10.1002/jssc.200900060. [DOI] [PMC free article] [PubMed] [Google Scholar]
- 8.Yu Z, Schonhoft JD, Dhakal S, Bajracharya R, Hegde R, Basu S, Mao H. ILPR G-quadruplexes formed in seconds demonstrate high mechanical stabilities. J Am Chem Soc. 2009;131:1876–82. doi: 10.1021/ja806782s. [DOI] [PubMed] [Google Scholar]
- 9.Owerbach D, Nerup J. Restriction fragment length polymorphism of the insulin gene in diabetes mellitus. Diabetes. 1982;31:275–277. doi: 10.2337/diab.31.3.275. [DOI] [PubMed] [Google Scholar]
- 10.Bell GI, Horita S, Karam JH. A polymorphic locus near the human insulin gene is associated with insulin dependent diabetes mellitus. Diabetes. 1984;33:176–183. doi: 10.2337/diab.33.2.176. [DOI] [PubMed] [Google Scholar]
- 11.Owerbach D, Gabbay KH. Localization of a Type I diabetes susceptibility locus to the variable tandem repeat region flanking the insulin gene. Diabetes. 1993;42:1708–1714. doi: 10.2337/diab.42.12.1708. [DOI] [PubMed] [Google Scholar]
- 12.Kennedy GC, German MS, Rutter WJ. The minisatellite in the diabetes susceptibility locus IDDM2 regulates insulin transcription. Nature Genetics. 1995;9:293–298. doi: 10.1038/ng0395-293. [DOI] [PubMed] [Google Scholar]
- 13.Bennett ST, Lucassen AM, Gough SC, Powell EE, Undlien DE, Pritchard LE, Merriman ME, Kawaguchi Y, Dronsfield MJ, Pociot F, et al. Susceptibility to human type 1 diabetes at IDDM2 is determined by tandem repeat variation at the insulin gene minisatellite locus. Nat Genet. 1995;9:284–292. doi: 10.1038/ng0395-284. [DOI] [PubMed] [Google Scholar]
- 14.Owerbach D, Gabbay KH. The search for IDDM susceptibility genes. Diabetes. 1996;45:544–551. doi: 10.2337/diab.45.5.544. [DOI] [PubMed] [Google Scholar]
- 15.Castasti P, Chen X, Moyzis RK, Bradbury EM, Gupta G. Structure-function correlations of the insulin-linked polymorphic region. J Mol Biol. 1996;264:534–545. doi: 10.1006/jmbi.1996.0659. [DOI] [PubMed] [Google Scholar]
- 16.Pugliese A, et al. The insulin gene is transcribed in the human thymus and transcription levels correlated with allelic variation at the INS VNTR-IDDM2 susceptibility locus for type 1 diabetes. Nat Genet. 1997;15:293–297. doi: 10.1038/ng0397-293. [DOI] [PubMed] [Google Scholar]
- 17.Vafiadis P, et al. Insulin expression in the thymus is modulated by INS VNTR alleles at the IDDM2 locus. Nat Genet. 1997;15:289–292. doi: 10.1038/ng0397-289. [DOI] [PubMed] [Google Scholar]
- 18.Paquette J, Giannoukakis N, Polychronakos C, Vafiadis P, Deal C. The INS 5k variable number of tandem repeats is associated with IGF2 expression in humans. J Biol Chem. 1998;273:14158–14164. doi: 10.1074/jbc.273.23.14158. [DOI] [PubMed] [Google Scholar]
- 19.Lew A, Rutter WJ, Kennedy GC. Unusual DNA structure of the diabetes susceptibility locusIDDM2 and its effect on transcription by the insulin promoter factor Pur-1/MAZ. Proc Natl Acad Sci USA. 2000;97:12508–12512. doi: 10.1073/pnas.97.23.12508. [DOI] [PMC free article] [PubMed] [Google Scholar]
- 20.Connor AC, Frederick KA, Morgan EJ, McGown LB. Insulin Capture by an Insulin-linked Polymorphic Region G-Quadruplex DNA Oligonucleotide. J Am Chem Soc. 2006;128:4986–4991. doi: 10.1021/ja056097c. [DOI] [PMC free article] [PubMed] [Google Scholar]
- 21.Dick LW, Jr, McGown LB. Aptamer-enhanced laser desorption/ionization for affinity mass spectrometry. Anal Chem. 2004;76:3037–3041. doi: 10.1021/ac049860e. [DOI] [PubMed] [Google Scholar]
- 22.Cole JR, Dick LW, Jr, Morgan EJ, McGown LB. Affinity capture and detection of immunoglobulin E in human serum using an aptamer-modified surface in matrix assisted laser desorption/ionization mass spectrometry. Anal Chem. 2007;79:273–279. doi: 10.1021/ac061256b. [DOI] [PMC free article] [PubMed] [Google Scholar]
- 23.Sigma Aldrich product specifications, catalog number: C9612, Chymase human; catalog number: C8946, α-Chymotrypsin from human.
- 24.Nordhoff E, Krogsdam AM, Jørgensen HF, Kallipolitis BH, Clark BC, Roepstorff P, Kristiansen K. Rapid identification of DNA-binding proteins by mass spectrometry. Nat Biotechnol. 1999;17:884–888. doi: 10.1038/12873. [DOI] [PubMed] [Google Scholar]
- 25.Hermann T, Patel DJ. Adaptive recognition by nucleic acid aptamers. Science. 2000;287:820–825. doi: 10.1126/science.287.5454.820. [DOI] [PubMed] [Google Scholar]
Associated Data
This section collects any data citations, data availability statements, or supplementary materials included in this article.