Abstract
PC-IDMS experiments for two peptides, laminin nonapeptide and the N-terminal tryptic peptide of prostate specific antigen, were performed utilizing a variety of alkylating reagents. These experiments were conducted to investigate how hydrophobicity influences the limits-of-detection (LOD) by altering their electrospray ionization response. Nonpolar surface areas were calculated for both peptides and all alkylating reagents to provide an estimate of the hydrophobicity of the differently alkylated peptides. Decreases in LOD by 2-fold were observed for both peptides between the best and worst performing combination of alkylating reagent. However, while an increase in hydrophobicity was found to aid in decreasing LOD to an extent, beyond a certain hydrophobicty, we observed a decrease.
Introduction
Absolute quantification of a protein from its digestion products dates back to Barr et. al.1 A combination of proteolysis and MS for absolute quantification of a European Community Bureau of Reference (BCR) certified apolipoprotein A-1 standard that was proteolyzed with trypsin and quantified with a stable isotope labeled internal standard peptide with LC-flow-FAB MS/MS.1 Their results demonstrated that the use of protein cleavage coupled with isotope dilution mass spectrometry (PC-IDMS) was valid methodology for the standardization of measurements of particular proteins in a clinical environment. PC-IDMS performs best when protein cleavage is complete, as this produces a 1:1 molar ratio between the initial intact protein and the peptide or peptides to be analyzed. The quantification using IDMS is based on the ratio of the response of the labeled internal standard peptide to that of the unlabeled peptide resulting from the digestion of the particular protein of interest. IDMS has been utilized on a range of different analytes for almost 40 years and still maintains its utility for the quantification of several different molecules.2
The process of utilizing chemical tags to investigate the quantitative potential of mass spectrometry has been studied previously. To this end, numerous cysteine specific tags have been developed and employed for relative quantitative studies in proteomics: ICAT3, solid-phase ICAT4, cleavable ICAT5, and IDBEST6 are some examples. Goodlett et. al. described another cysteine specific tag which contained chlorine to assist with identification of analytes. Reagents targeting primary amine groups have also been investigated for relative quantification experiments7, 8 in addition to the iTRAQ9 reagent. Other tagging strategies for relative quantification include C-terminal tagging10 and phosphorylation site modification11. Several chemical tagging strategies are described in recent reviews.12–14 The basic idea of exploiting chemical derivatization of analytes with mass spectrometry has been thoroughly studies and produced promising results.
In a typical bottom-up proteomics experiment step reduction and alkylation of cysteines is completed prior to enzymatic or chemical digestion to eliminate to protein’s tertiary structure.15, 16 The alkylation step is the ideal choice for modification of protein/peptide chemical structure since the reaction is fairly straightforward and would eliminate the need for additional labeling steps. Several techniques for chemical tagging utilizing alkylation are summarized in two reviews by Leitner et. al. and Hamdan et.al.13, 17 Most of these strategies apply stable-isotope labels for relative quantification through the use of alkylation chemistry.
Previous literature has shown a link between increased electrospray (ESI) response and the hydrophobicity of an analyte.18 Fenn and co-workers illustrated this as far back as 1993.19 This improvement in electrospray response is believed to be a result of increased surface activity of the analyte with more nonpolar character (hydrophobicity).18, 20, 21
Null et. al. were the first to purposefully modify a large biomolecule (> 500 Da) with a hydrophobic moiety to increase the electrospray (ESI) response.21 The Muddiman group has previously described the ALiPHAT method, which utilized iodoacetamide derivatives, in a typical bottom-up approach, to increase the hydrophobicity of proteins/peptides and thus increase their electrospray response.22, 23 For particular peptide and iodoacetamide derivative combinations large increases in ESI response were observed versus the same peptide alkylated with commercially available iodoacetamide. In addition to the ALiPHAT method, several other tagging strategies for increasing the hydrophobicity of peptides have also been reported in the literature.24–26
Herein, we further investigate a method developed by our group, termed ALiPHAT, 22, 23 and utilize this method in a PC-IDMS experiment for two different peptides to demonstrate the method’s ability to enhance absolute quantification experiments. The hydrophobicity of a particular peptide and alkylating reagent is estimated by a calculation of nonpolar surface area. Furthermore, the consequences of increased nonpolar surface area on limits-of-detection (LOD) are discussed.
Experimental
Materials
Peptides were synthesized representing laminin nonapeptide and the N-terminal tryptic peptide from prostate specific antigen (tpPSA1–9) whose sequences are CDPGYIGSR and IVGGWECEK, respectively. An additional set of peptides with identical sequences, but incorporation of 13C and 15N were synthesized for use as internal standards: CDP[13C5, 15N1]GYIGSR and IV[13C5, 15N1]GGWECEK. Synthetic peptides were purchased from Mayo Clinic Proteomics Center (Rochester, MN). After dilution of these peptides their concentrations were confirmed utilizing UV-Vis spectroscopy and the Scopes method.27
Tris(2-carboxyethyl)phosphine (TCEP) iodoacetamide, and N-ethylmalemide (NEM) were purchased from Sigma-Aldrich (St. Louis, MO). TRIS-HCl buffer was purchased from Fisher Scientific (Pittsburgh, PA). Solvents for liquid chromatography were purchased from Burdick and Jackson (Muskegon, MI). All iodoacetamide derivatives utilized herein were synthesized by the Comins laboratory at NC State University as previously described.22, 23
Peptide Modification
Stock peptide solutions were prepared such that they comprised natural to stable isotope labeled (SIL) ratios of 0:8, 1:8, 3:8, 5:8, 10:8, and 16:8 for both peptides in a 100 mM TRIS-HCl buffer of pH 8.0. The stock solutions were reduced with TCEP at a 1:10 ratio of cysteine to TCEP and allowed to react at 37°C for 20 minutes. For alkylation with iodoacetamide a 1:20 ratio of cysteine to iodoacetamide was utilized. The iodoacetamide derivatives and N-ethylmalemide were added at a 1:40 cysteine:alkylating reagent ratio. The alkylation step was allowed to proceed for 1 hr at 37°C in darkness. The chemical modification of peptides was carried out in two experimental sets. Each set contained three alkylation reagents that were reacted with reduced stock solutions. Set one was carried out with iodoacetamide (IAM), N-ethylmalemide (NEM), and 2-Iodo-N-octylacetamide (octyl). Set two utilized 2-Iodo-N-benzylacetamide (Ph-1), 2-Iodo-N-(phenethyl)acetamide (Ph-2), and 2-Iodo-N-(4-phenylbutyl)acetamide (Ph-4). For each experimental set the modified peptides were combined to create an equal molar mixture, one for each natural to SIL peptide ratio. The modified peptide mixture was then diluted to produce the proper concentration for loading by the nano-LC-MS system (vida infra).
LC-MS/MS
Reversed phase liquid chromatography was performed using a 75 µm i.d. PicoFrit capillary column (New Objective, Woburn, MA) with a 15 µm emitter tip packed in-house with 4 µm Jupiter Proteo C12 90Å stationary phase (Phenomenex, Torrance, CA). The packed volume had dimensions 75 µm i.d. × 100 mm and was operated at room temperature. Modified peptide mixtures injections of 10 µL were loaded using a Shimadzu SIL-20AC (Columbia, MD) and over the course of 4 minutes trapped and washed on a custom built Jupiter Proteo C12 OPTI-PAK trap cartridge (Optimize Technologies; Oregon City, OR) with 100% Mobile Phase A (95/5 water/acetonitrile) at 10 uL/min. Then a 6 port Shimadzu FCV-12AH switching valve was triggered to move the sample in-line with the gradient. Elution was carried out by a Shimadzu LC-20AD nano-flow pump (Zwingen, Switzerland) at 500 nL/min with mobile phases containing 95/5 (v/v) (Mobile Phase A) and 5/95 (Mobile Phase B) water and acetonitrile, respectively. The ion pairing reagent used was 0.2% formic acid (Sigma Aldrich, St. Louis, MO) in both mobile phases. The LC gradient was held at initial conditions of 2% B for 4.5 minutes followed by a linear ramp to 85% B over 14 minutes, then ramped to 95% B over 1 minute, and held for an additional four minutes before re-equilibrating at 2% B, for a total gradient time of 32 minutes.
All samples from each set (vide supra) were injected in triplicate onto the LC-MS/MS system. A blank containing only mobile phase A was injected between each run for a total of 144 injections. Each injection was monitored for twelve transitions (2 natural peptide and 2 SIL peptides each modified by one of 3 alkylating reagents per set).
All quantification was carried out on a triple quadrupole mass spectrometer (Thermo Scientific, San Jose, CA) that was operated in SRM mode to monitor transitions of the peptides of interest and their stable isotope labeled counterparts. The transition monitored for all peptides was the [M+2H+]2+ to the y71+-ion, as this was the strongest transition present. Each transition was monitored for 83 milliseconds (for a total of ~1 second to measure twelve transitions per experimental set) and unit resolution was employed for both Q1 and Q3 quadrupoles. Additional experimental parameters included an ESI voltage of 2.0 kV, capillary offset of 35 V, and a capillary temperature of 250°C.
Nonpolar Surface Area
Nonpolar surface areas were calculated for the peptides utilized by methods previously described by Enke and co-workers20 which sums the nonpolar surface area for each amino acid28 in a particular peptide sequence. Values for the alkylating reagents were estimated using basic geometry along with bond lengths and Van der Waals radii.29
Results and Discussion
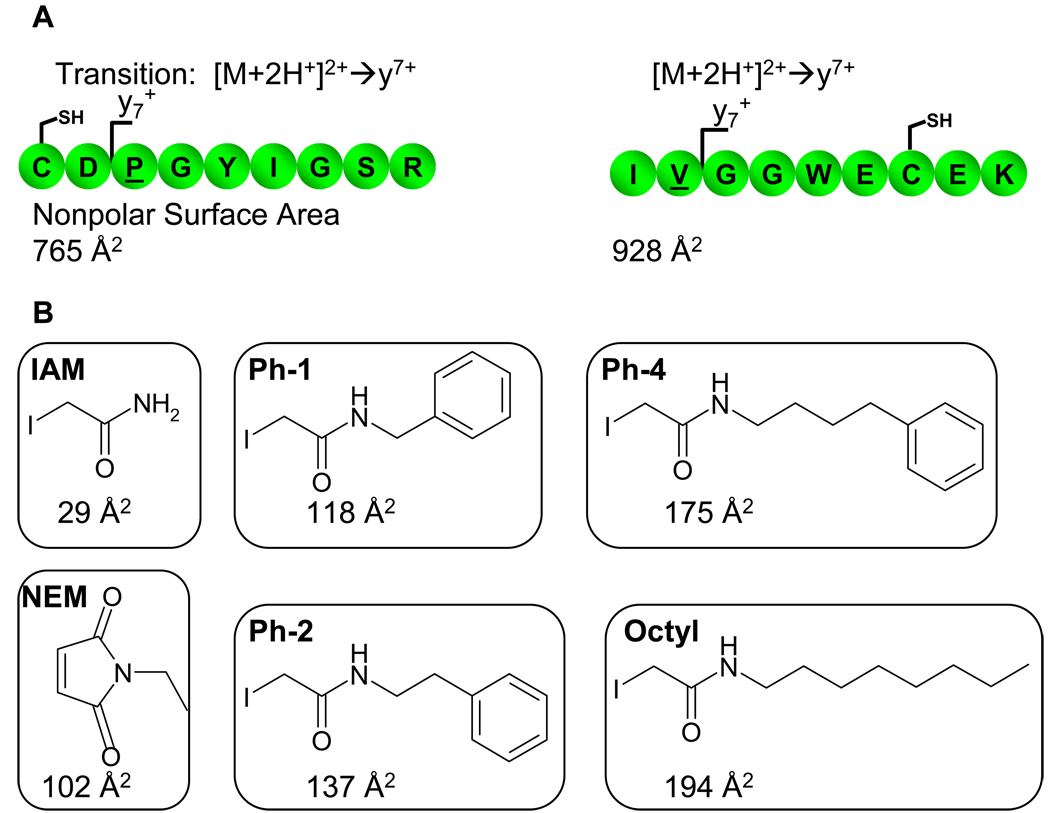
Figure 1A shows the amino acid sequences, nonpolar surface area, and measured transitions for both laminin nonapeptide and tpPSA1–9. Both peptides are comprised of nine amino acids and the strongest transition observed in initial studies for both peptides were [M+2H]2+ → y71+ (data not shown). The nonpolar surface area for the tpPSA1–9 is higher than that of the laminin nonapeptide, which suggests that tpPSA1–9 has more inherent hydrophobicity. These peptides were chosen because of their biological relevance and differing cysteine placement within their sequences. Also, since both peptides included nine amino acids, this aided in comparison of their results in this proof of principle study. Figure 1B illustrates the various alkylation reagents that were used in these studies and their nonpolar surface areas.
Figure 1.
A) Illustrates the amino acid sequences of the two peptides used in this study, the transition used by the mass spectrometer, and the nonpolar surface area for the given peptide. The underlined amino acid shows the stable isotope labeled form for in the internal standard. B) The alkylating reagents utilized in this study are shown along with their abbreviation used in this manuscript and their nonpolar surface area.
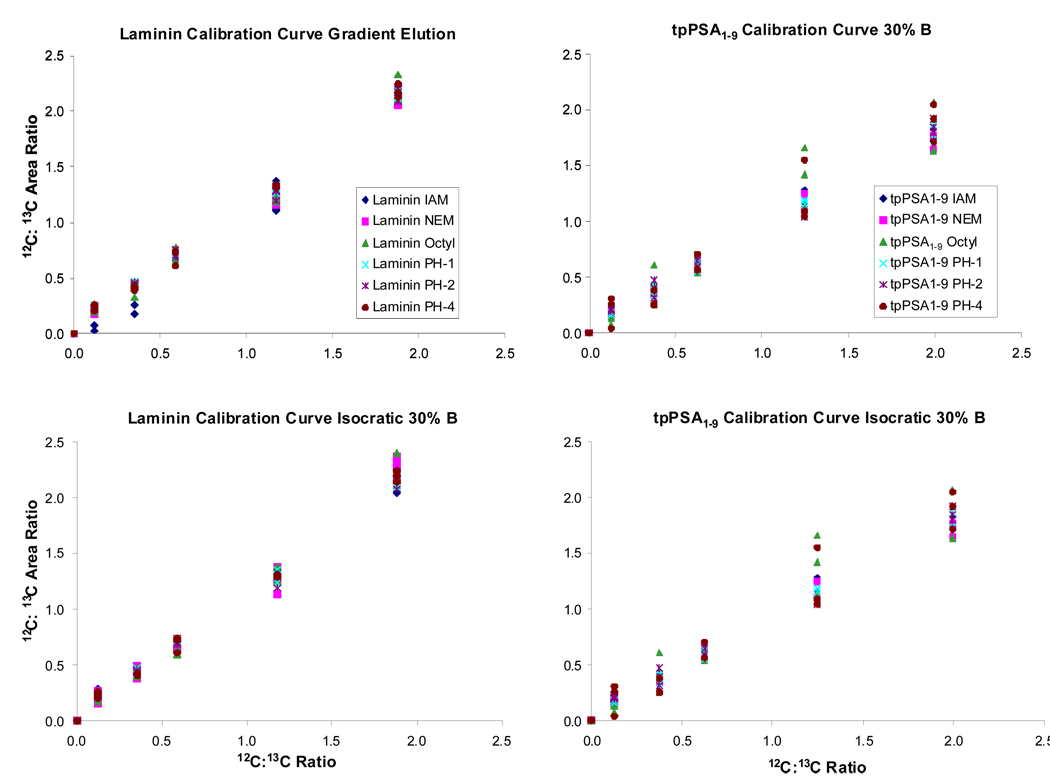
Calibration curves were generated utilizing all combinations of the two peptides and the six alkylation reagents undergoing gradient elution and isocratic elution at 30% B. The calibration curves were generated by calculating the concentration ratio of natural to stable isotope labeled peptide injected on column (x-axis) and plotting versus the instrument’s response (peak area) on the y-axis.
Figure 2 illustrates these calibration curves. The response measured from laminin alkylated with all reagents provided a linear response with R2 values ranging from 0.97 to 0.99 for the gradient elution. Similar results were observed with the isocratic elution experiments. The calibration curves generated for tpPSA1–9 also illustrated linear response across the concentration range shown with correlation coefficients ranging from 0.94 to 0.99 for the gradient elution. The lowest of these values came from the alkylation of tpPSA1–9 with the octyl tag (2-iodo-N-octylacetamide), which provided for a wide response range for the natural to SIL concentration ratio of 1.25. These results were similar to those resulting from isocratic elution.
Figure 2.
Calibration curves for laminin and tpPSA1–9 for both gradient elution and isocratic elution experiments are shown. The overlap of the peptides with different alkylating reagents demonstrated that all combination could be used to perform absolute quantification experiments with a PC-IDMS methodology.
The linear response for the two investigated peptides alkylated with differing alkylating reagents (commercially available and ALiPHAT tags) is an important observation. This demonstrates that in a PC-IDMS experiment absolute quantification would indeed be successful regardless of alkylation reagent choice. In addition, the linear response observed illustrated the alkylation reaction for each reagent was complete and specific for both natural isotope and stable isotope labeled versions of the peptides.
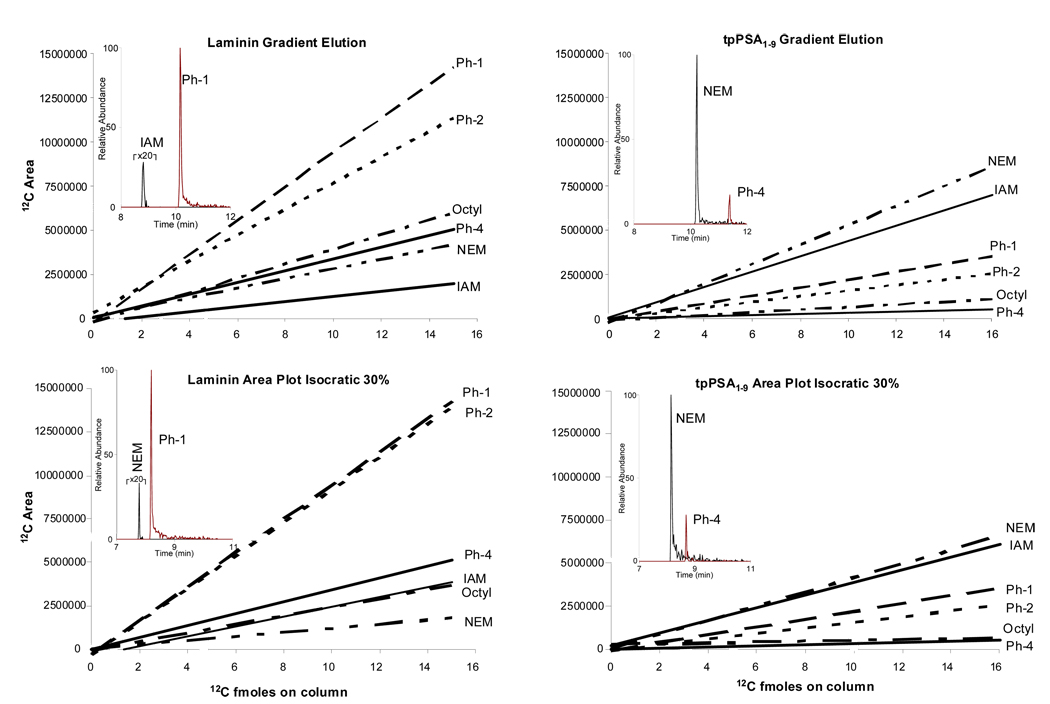
From the data in Figure 2 LOD can be calculated, as shown in previous publications.30–32 Laminin alkylated with the Ph-1 ALiPHAT reagent had a LOD of 0.3 fmole on column, while laminin alkylated with IAM had a LOD calculated to be 0.8 fmole on column. This is a decrease in LOD of ~2 fold by merely changing the alkylating reagent. The tpPSA1–9 alkylated with NEM was determined to provide a LOD of 0.4 fmole on column, while tpPSA1–9 alkylated with Ph-4 had a LOD of 0.9 fmole on column. This decrease in LOD is also ~ 2 fold, but the alkylating reagent with lower hydrophobicity proved to be the best candidate for tpPSA1–9. The above LOD’s were calculated from gradient elution experiments; however, data from isocratic elutions were comparable.
Figure 3 contains plots of the amount of natural peptide alkylated with the various reagents injected on column and their absolute abundances, measured by peak area, observed by the mass spectrometer. Laminin demonstrated the best response across the range of concentration when alkylated with the Ph-1 reagent for both gradient and isocratic elutions. This is confirmed by the line with the highest slope corresponding to laminin alkylated with Ph-1. Each line is labeled with the abbreviation for its alkylating reagent. Insets of the extracted ion chromatograms from the 5 fmole injection are shown for the best and worst performing combination of peptide and alkylating reagent. The same information is given on the right side of Figure 3 for tpPSA1–9. These results show tpPSA1–9 achieved the greatest instrumental response at various injected amounts when alkylated with NEM, while it performed the worst when alkylated with the Ph-4 reagent. This data illustrates that different combinations of alkylating reagents with different peptides can create analytes with different analytical sensitivities, as shown by the various slopes in the data in Figure 3.
Figure 3.
Sensitivity is shown to differ for both peptides depending on which alkylating reagent is utilized. Abbreviations denote which alkylating reagent was used. Inset is the extracted ion chromatogram for the best and worst performing peptide and alkylating reagents for the denoted experimental set.
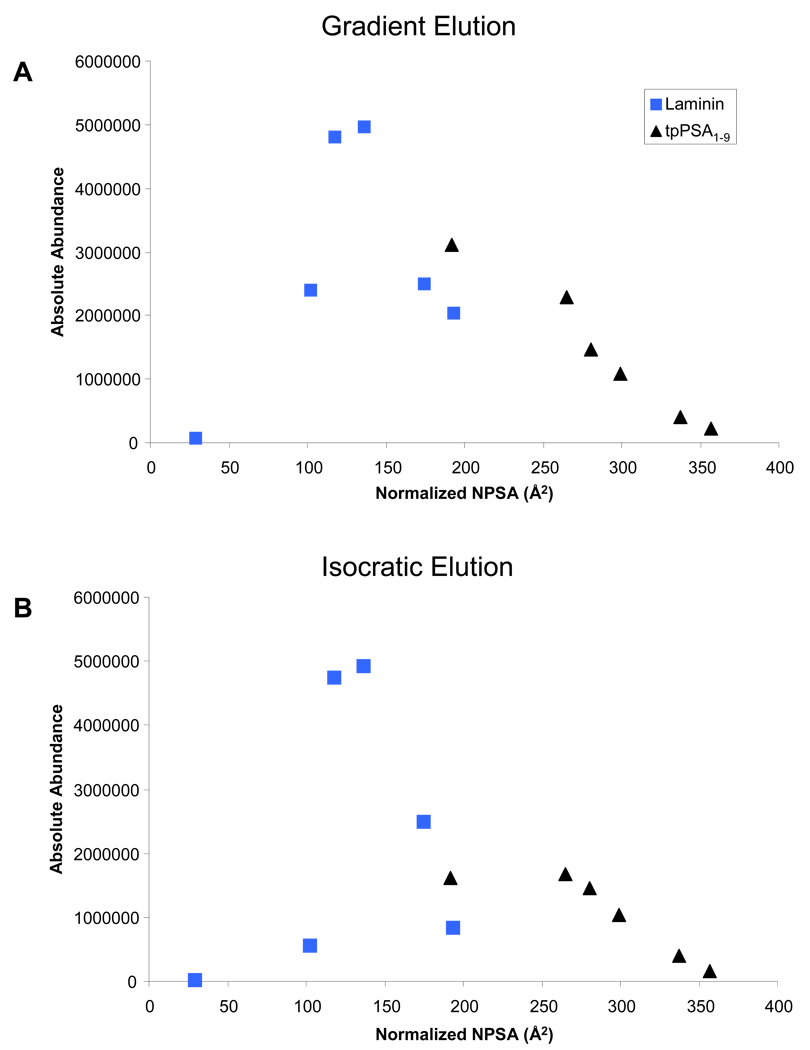
Both peptides analyzed herein obtain an optimum LOD and sensitivity with a specific alkylating reagent. Nonpolar surface area was utilized as a metric to quantify the hydrophobicity of a particular combination of peptide and alkylating reagent. To further investigate this Figure 4A and Figure 4B were generated to demonstrate how normalized nonpolar surface area relates to absolute abundance observed by the mass spectrometer for 5 fmoles injected on column for gradient and isocratic elution, respectively. This normalized nonpolar surface was the total for a given peptide and alkylating reagent minus the total calculated for the laminin nonapeptide.
Figure 4.
The relationship between normalized nonpolar surface area and ESI response is shown for A) Gradient elution and B) Isocratic elution of 5 fmole on column. Squares represent laminin, while triangles represent tpPSA1–9.
These data suggested that a species can be made too hydrophobic which will diminish its ESI response and thus increase its LOD. One possible solution for further decreasing the LOD of tpPSA1–9 would be to introduce a cysteine targeting tag which would add polar character to its structure, thus actually decreasing its hydrophobicity. However, an additional source of increasing LOD with increasing hydrophobicity could be diminishing solubility in the initial solvent composition (98% water, 2% ACN). This could possibly be addressed by the future utilization of HILIC chromatography with the ALiPHAT methodology. However, it has been shown herein that utilizing reverse phase chromatography and choosing an alkylating reagent that maximizes ESI response can achieve a true decrease in LOD in PC-IDMS experiments.
Conclusions
A wide variety of alkylating reagents, including those previously developed for the ALiPHAT method, have been applied in a PC-IDMS experiment for two separate peptides. An optimum LOD was found to occur with a specific alkylating reagent for each peptide (NEM alkylated tpPSA1–9 and Ph-1 alkylated laminin). Both peptides were able to provide for a better than 2-fold decrease in LOD with the proper alkylating reagent (versus worst combination of peptide and alkylating reagent). Nonpolar surface area was calculated for the alkylating reagents and peptides and this information was utilized as a metric for determining the total hydrophobicity of the different alkylated peptides. This information illustrated how changes in hydrophobicity effect the response by the mass spectrometer, and ultimately the LOD of the analyte.
Acknowledgements
Research described in this article was supported in part by the National Institutes of Health (R33 CA105295) and North Carolina State University. In addition, DKW would like to acknowledge the ACS Division of Analytical Chemistry and Merck for their support.
Footnotes
Publisher's Disclaimer: This is a PDF file of an unedited manuscript that has been accepted for publication. As a service to our customers we are providing this early version of the manuscript. The manuscript will undergo copyediting, typesetting, and review of the resulting proof before it is published in its final citable form. Please note that during the production process errors may be discovered which could affect the content, and all legal disclaimers that apply to the journal pertain.
References
- 1.Barr JR, Maggio VL, Patterson DG, et al. Isotope dilution mass spectrometric quantification of specific proteins: Model application with apolipoprotein A-I. Clin. Chem. 1996;42(10):1676–1682. [PubMed] [Google Scholar]
- 2.de Leenheer AP, Thienpont LM. Applications of Isotope-Dilution Mass-Spectrometry in Clinical-Chemistry, Pharmacokinetics, and Toxicology. Mass Spectrom. Rev. 1992;11(4):249–307. [Google Scholar]
- 3.Gygi SP, Rist B, Gerber SA. Quantitative analysis of complex protein mixtures using isotope-coded affinity tags. Nat. Biotechnol. 1999;17(10):994–999. doi: 10.1038/13690. [DOI] [PubMed] [Google Scholar]
- 4.Zhou HL, Ranish JA, Watts JD, et al. Quantitative proteome analysis by solid-phase isotope tagging and mass spectrometry. Nature Biotechnology. 2002;20(5):512–515. doi: 10.1038/nbt0502-512. [DOI] [PubMed] [Google Scholar]
- 5.Li JX, Steen H, Gygi SP. Protein profiling with cleavable isotope-coded affinity tag (cICAT) reagents - The yeast salinity stress response. Mol. Cell. Proteomics. 2003;2(11):1198–1204. doi: 10.1074/mcp.M300070-MCP200. [DOI] [PubMed] [Google Scholar]
- 6.Hall MP, Schneider LV. Isotope-differentiated binding energy shift tags (IDBEST (TM)) for improved targeted biomarker discovery and validation. Expert Rev. Proteomics. 2004;1(4):421–431. doi: 10.1586/14789450.1.4.421. [DOI] [PubMed] [Google Scholar]
- 7.Geng MH, Ji JY, Regnier FE. Signature-peptide approach to detecting proteins in complex mixtures. Journal of Chromatography A. 2000;870(1–2):295–313. doi: 10.1016/s0021-9673(99)00951-6. [DOI] [PubMed] [Google Scholar]
- 8.Chakraborty A, Regnier FE. Global internal standard technology for comparative proteomics. Journal of Chromatography A. 2002;949(1–2):173–184. doi: 10.1016/s0021-9673(02)00047-x. [DOI] [PubMed] [Google Scholar]
- 9.Ross PL, Huang YLN, Marchese JN, et al. Multiplexed protein quantitation in Saccharomyces cerevisiae using amine-reactive isobaric tagging reagents. Mol. Cell. Proteomics. 2004;3(12):1154–1169. doi: 10.1074/mcp.M400129-MCP200. [DOI] [PubMed] [Google Scholar]
- 10.Cagney G, Emili A. De novo peptide sequencing and quantitative profiling of complex protein mixtures using mass-coded abundance tagging. Nature Biotechnology. 2002;20(2):163–170. doi: 10.1038/nbt0202-163. [DOI] [PubMed] [Google Scholar]
- 11.Goshe MB, Conrads TP, Panisko EA, et al. Phosphoprotein isotope-coded affinity tag approach for isolating and quantitating phosphopeptides in proteome-wide analyses. Anal. Chem. 2001;73(11):2578–2586. doi: 10.1021/ac010081x. [DOI] [PubMed] [Google Scholar]
- 12.Julka S, Regnier F. Quantification in proteomics through stable isotope coding: A review. J. Proteome Res. 2004;3(3):350–363. doi: 10.1021/pr0340734. [DOI] [PubMed] [Google Scholar]
- 13.Leitner A, Lindner W. Current chemical tagging strategies for proteome analysis by mass spectrometry. J. Chromatogr., B: Anal. Technol. Biomed. Life Sci. 2004;813(1–2):1–26. doi: 10.1016/j.jchromb.2004.09.057. [DOI] [PubMed] [Google Scholar]
- 14.Ong SE, Mann M. Mass spectrometry-based proteomics turns quantitative. Nature Chemical Biology. 2005;1(5):252–262. doi: 10.1038/nchembio736. [DOI] [PubMed] [Google Scholar]
- 15.Sechi S, Chait BT. Modification of cysteine residues by alkylation. A tool in peptide mapping and protein identification. Anal. Chem. 1998;70(24):5150–5158. doi: 10.1021/ac9806005. [DOI] [PubMed] [Google Scholar]
- 16.Herbert B, Galvani M, Hamdan M. Reduction and alkylation of proteins in preparation of two-dimensional map analysis: Why, when, and how? Electrophoresis. 2001;22(10):2046–2057. doi: 10.1002/1522-2683(200106)22:10<2046::AID-ELPS2046>3.0.CO;2-C. [DOI] [PubMed] [Google Scholar]
- 17.Hamdan M, Righetti PG. Modern strategies for protein quantification in proteome analysis: Advantages and limitations. Mass Spectrom. Rev. 2002;21(4):287–302. doi: 10.1002/mas.10032. [DOI] [PubMed] [Google Scholar]
- 18.Cech NB, Enke CG. Practical implications of some recent studies in electrospray ionization fundamentals. Mass Spectrom. Rev. 2001;20(6):362–387. doi: 10.1002/mas.10008. [DOI] [PubMed] [Google Scholar]
- 19.Fenn JB. Ion Formation from Charged Droplets - Roles of Geometry, Energy, and Time. J. Am. Soc. Mass Spectrom. 1993;4(7):524–535. doi: 10.1016/1044-0305(93)85014-O. [DOI] [PubMed] [Google Scholar]
- 20.Cech NB, Enke CG. Relating electrospray ionization response to nonpolar character of small peptides. Anal. Chem. 2000;72(13):2717–2723. doi: 10.1021/ac9914869. [DOI] [PubMed] [Google Scholar]
- 21.Null AP, Nepomuceno AI, Muddiman DC. Implications of hydrophobicity and free energy of solvation for characterization of nucleic acids by electrospray ionization mass spectrometry. Anal. Chem. 2003;75(6):1331–1339. doi: 10.1021/ac026217o. [DOI] [PubMed] [Google Scholar]
- 22.Frahm JL, Bori ID, Comins DL, et al. Achieving augmented limits of detection for peptides with hydrophobic alkyl tags. Anal. Chem. 2007;79(11):3989–3995. doi: 10.1021/ac070558q. [DOI] [PubMed] [Google Scholar]
- 23.Williams DK, Meadows CW, Bori ID, et al. Synthesis, characterization, and application of iodoacetamide derivatives utilized for the ALiPHAT strategy. J. Am. Chem. Soc. 2008;130(7) doi: 10.1021/ja076849y. 2122-+ [DOI] [PubMed] [Google Scholar]
- 24.Foettinger A, Leitner A, Lindner W. Derivatisation of arginine residues with malondialdehyde for the analysis of peptides and protein digests by LC-ESI-MSMS. J. Mass Spectrom. 2006;41(5):623–632. doi: 10.1002/jms.1020. [DOI] [PubMed] [Google Scholar]
- 25.Ullmer R, Plematl A, Rizzi A. Derivatization by 6-aminoquinolyl-N-hydroxysuccinimidyl carbamate for enhancing the ionization yield of small peptides and glycopeptides in matrix-assisted laser desorption/ionization and electrospray ionization mass spectrometry. Rapid Commun. Mass Spectrom. 2006;20(9):1469–1479. doi: 10.1002/rcm.2464. [DOI] [PubMed] [Google Scholar]
- 26.Mirzaei H, Regnier F. Enhancing electrospray ionization efficiency of peptides by derivatization. Anal. Chem. 2006;78(12):4175–4183. doi: 10.1021/ac0602266. [DOI] [PubMed] [Google Scholar]
- 27.Scopes RK. Measurement of Protein by Spectrophotometry at 205-Nm. Analytical Biochemistry. 1974;59(1):277–282. doi: 10.1016/0003-2697(74)90034-7. [DOI] [PubMed] [Google Scholar]
- 28.Karplus PA. Hydrophobicity regained. Protein Science. 1997;6(6):1302–1307. doi: 10.1002/pro.5560060618. [DOI] [PMC free article] [PubMed] [Google Scholar]
- 29.Oxtoby DW, Gillis HP, Nachtrieb NH. Principles of modern chemistry. 4th ed. Fort Worth: Saunders College Pub.; 1999. p. xxiii.p. 876. [Google Scholar]
- 30.Barnidge DR, Goodmanson MK, Klee GG, et al. Absolute quantification of the model biomarker prostate-specific antigen in serum by LC-MS/MS using protein cleavage and isotope dilution mass spectrometry. J. Proteome Res. 2004;3(3):644–652. doi: 10.1021/pr049963d. [DOI] [PubMed] [Google Scholar]
- 31.Williams DK, Muddiman DC. Absolute quantification of C-reactive protein in human plasma derived from patients with epithelial ovarian cancer utilizing protein cleavage isotope dilution mass spectrometry. J Proteome Res. 2009;8(2):1085–1090. doi: 10.1021/pr800922p. [DOI] [PMC free article] [PubMed] [Google Scholar]
- 32.Muddiman DC, Gusev AI, Hercules DM. Application of secondary ion and matrix-assisted laser desorption-ionization time-of-flight mass spectrometry for the quantitative analysis of biological molecules. Mass Spectrom. Rev. 1995;14(6):383–429. [Google Scholar]


