

Summary
While adipose tissue-associated macrophages contribute to development of chronic inflammation and insulin resistance of obesity, little is known about the role of hepatic Kupffer cells in this environment. Here we address the impact of Kupffer cell ablation using clodronate-encapsulated liposome depletion in a diet-induced obese (DIO) and insulin resistant mouse model. Hepatic expression of macrophage markers measured by realtime RT-PCR remained unaltered in DIO mice despite characteristic expansion of adipose tissue-associated macrophages. DIO mouse livers displayed increased expression of alternative activation markers but unaltered proinflammatory cytokine expression when compared to lean mice. Kupffer cell ablation reduced hepatic anti-inflammatory cytokine IL-10 mRNA expression in lean and DIO mice by 95% and 84%, respectively. Despite decreased hepatic IL-6 gene expression after ablation in lean and DIO mice, hepatic STAT3 phosphorylation, Socs3 and acute phase protein mRNA expression increased. Kupffer cell ablation in DIO mice resulted in additional hepatic triglyceride accumulation and a 30-40% reduction in hepatic insulin receptor autophosphorylation and Akt activation. Implicating systemic loss of IL-10, high-fat-fed IL-10 knockout mice also displayed increased hepatic STAT3 signaling and hepatic triglyceride accumulation. Insulin signaling was not altered, however. In conclusion, Kupffer cells are a major source of hepatic IL-10 expression, the loss of which is associated with increased STAT3-dependent signaling and steatosis. One or more additional factors appear to be required, however, for the Kupffer cell-dependent protective effect on insulin receptor signaling in DIO mice.
Keywords: Kupffer cell, macrophage, diet-induced obesity, inflammation, steatosis
Introduction
Omental adipose tissue produces an array of adipokines including leptin, adiponectin, resistin, and proinflammatory cytokines such as IL-6 and tumor necrosis factor alpha (TNF-α) [1]. Levels of these factors are under metabolic regulation and can individually impact local and systemic insulin responsiveness. For instance, levels of the proinflammatory cytokines IL-6 and TNF-α are elevated in the adipose tissue of obese, insulin resistant patients [2-4] and have been shown to directly inhibit insulin signaling through SOCS-3 induction [5] and c-Jun-N-terminal kinase (JNK)-dependent activation [6-8] respectively.
Adipose tissue-associated macrophages are increased in obesity [9-11] and account for almost all of the TNF-α production and a significant fraction of the IL-6 produced by the adipose tissue [11, 12]. This can be attributed to the increased inflammatory properties of the newly-recruited macrophages [12] as well as a shift in resident adipose tissue-associated macrophage activation state from alternative to classical activation [13]. Obesity increases expression and secretion of monocyte chemoattractant protein 1 (MCP-1/CCL2) in adipocytes and may explain how the adipose tissue actively recruits new macrophages. In fact, knockout mouse models of MCP-1 or its receptor (CCR2) have reduced macrophage accumulation and decreased inflammation within the adipose tissue under high-fat diet conditions [14, 15] and in leptin receptor deficient (Lepdb) mice [16].
Macrophage stimuli can elicit varied and distinct macrophage activation states [17]. Classical (Th1) activation is elicited in response to inflammatory molecules such as LPS or TNF-α in combination with IFN-γ and results in proinflammatory cytokine production and the respiratory burst (characterized by nitric oxide production) [17]. In contrast, alternative (Th2) activation dampens inflammatory responses and is characterized by increased arginase 1 expression and activity as well as increased expression of molecules such as MHC class II, mannose receptor, chitinase 3-like 3 (Ym1/2), and the resistin-like molecule FIZZ1 [17, 18].
Recent investigations have focused on the phenotypic shift in adipose tissue-associated macrophage activation state from alternative to classical that occurs during obesity. Lumeng et al. [13] demonstrated that the predominant adipose tissue-associated macrophage activation state shifts from the more protective, anti-inflammatory Th2 state to proinflammatory Th1 in obesity. More recently, Odegaard et al. [19] observed that loss of PPAR-γ (in the Th2-prone Balb/c mice) impairs alternative activation of adipose tissue-associated macrophages, resulting in susceptibility to diet-induced obesity and decreased insulin responsiveness via reduced β-oxidative capacity. Kang et al. [20] demonstrated that parenchymal cell-derived IL-13 cannot stimulate alternative activation of PPAR-δ-deficient myeloid cells and results in inflammation and metabolic dysfunction in adipose tissue and liver. Additionally, Odegaard et al. [21] demonstrated that loss of PPAR-δ in lean mice impairs alternative activation of Kupffer cells, which results in decreased oxidative metabolism, hepatic steatosis and increased systemic insulin resistance. Clarification of the involvement of PPAR-γ and PPAR-δ is needed, however, as Marathe et al. [22] reported that neither PPAR-γ nor PPAR-δ was required for alternative activation.
Given the active involvement of the adipose tissue-associated macrophages and circulating monocyte [23] populations in chronic inflammation of obesity, this current study was designed to investigate the role of the hepatic macrophage, or Kupffer cell, in the inflammatory and insulin resistant states of obesity. Kupffer cells are the largest macrophage population in the body [24] and, in addition to fulfilling a variety of other immunologic functions [25, 26], are the primary innate immune defense against exposure to foreign antigens from the diet and intestinal tract [26, 27].
In contrast to the active characterization of adipose tissue-associated macrophages, there are few studies addressing the role of Kupffer cells in the inflammatory and metabolically dysfunctional obese state. While the work by Odegaard et al. [21] suggested that an alternatively activated Kupffer cell may support hepatic insulin responsiveness, the effect of obesity on the native Kupffer cell population remains undefined. The results of this investigation indicate that in contrast to adipose tissue-associated macrophages, Kupffer cells do not significantly contribute to the chronic proinflammatory environment of obesity. In support of observations by Odegaard et al. [21], Kupffer cells may partially protect hepatocytes from the inflammatory milieu and the subsequent steatosis and insulin resistance associated with high-fat diet-induced obesity.
Materials and Methods
2.1 Antibodies
Phospho-specific Akt (serine 473), phospho-specific STAT3 (tyrosine705) and STAT3 antibodies were purchased from Cell Signaling Technology (Beverly, MA). An anti-phosphotyrosine antibody was purchased from Millipore (Billerica, MA). Akt1/2 and insulin receptor beta chain antibodies were purchased from Santa Cruz Biotechnology (Santa Cruz, CA).
2.2 Animals
Male C57BL/6J mice purchased from Jackson Laboratories were housed 4 per cage in a microisolator room on a 12 hr light/dark cycle at the University of Rochester. The University Committee on Animal Resources approved all protocols. 4-week-old C57BL/6J male mice were fed standard chow or a high-fat diet (16.6% kcal/gm protein, 59.3% kcal/gm fat, 24.48% kcal/gm carbohydrate) (Bioserve #S3282, Frenchtown, NJ). The latter resulted in diet-induced obesity. With the exception of the animals used for metabolic challenge tests, mice were utilized for experimentation after 15-17 weeks on the high fat diet. Interleukin-10 knockout mice (B6.129P2-IL10tm1cgn/J) and wild-type controls were purchased from Jackson Laboratories and housed according to the conditions above. High-fat feeding of this model began at 4 weeks of age and experiments were performed after 7-8 weeks.
2.3 Metabolic studies
Metabolic studies were performed after 12-14 weeks of high-fat diet and 36 hr following PBS- or clodronate-containing liposome administration. Briefly, mice were fasted overnight and given an intraperitoneal injection of insulin (1.5U/kg), glucose (1.5g/kg), or pyruvate (1.0g/kg) dissolved in sterile saline. Blood was taken from tail vein every 15 minutes and glucose was measured with an Accu-chek Advantage® glucometer (Accu-chek). Results were normalized to percent starting (fasted) glucose and area under the curve (AUC) was calculated.
2.4 Kupffer cell ablation and immunostaining
Phosphate buffered saline (PBS)-containing and clodronate-containing liposome suspensions were prepared as described earlier [28]. All parameters were assessed at 36 hr following a 200ul intra-peritoneal injection. Liver slices were formalin-fixed, paraffin-embedded, and sectioned. Sections were stained using rat anti-mouse F4/80 (Invitrogen, Carlsbad CA) antibody at 1:50 dilution. Detection was achieved using a biotin-conjugated rabbit anti-rat antibody (Vector Laboratories Inc., Burlingame, CA), incubation with streptavidin-horseradish peroxidase (Jackson Labs), exposure to aminoethylcarbazole (Dako, Carpinteria, CA), and hematoxylin blue counterstaining.
2.5 Assessment of in vivo insulin signaling
Following an overnight fast (∼15 hr), animals were briefly anesthetized using an isofluorane vaporizer (Summit Medical, Salem, OR), and injected intraperitoneally with vehicle (sterile saline) or 1.5 Units/kg Novolin® human insulin (Novo Nordisk Pharmaceuticals, Princeton, NJ). After 10 min, animals were sacrificed. Harvest and processing of frozen tissue for immunoprecipitation and quantitative immunoblotting were carried out as previously described [29].
2.6 Lipid Extraction and Analysis
Lipid extraction protocol was adapted from [30]. Briefly, frozen liver fractions were weighed and homogenized in chloroform: methanol (2:1 vol/vol). Extracts were passed through fluted filter paper. Saline/0.05% sulfuric acid was added to partition the chloroform at a ratio of 1:5 (vol/vol) of filtered extract. Partitioning of extracts was completed by centrifugation, and the chloroform layer was removed, dried down and resuspended in fresh chloroform. Samples were diluted in 5% (vol/vol) Triton X-100 (Sigma) in chloroform and evaporated. Lipids were measured using L-Type Tg and Cholesterol E kits from Wako Chemicals USA (Richmond, VA) in duplicate. Total lipid was normalized to protein content per wet weight of sample tissue. Oil Red O staining was performed on frozen liver sections and counterstained with hematoxylin.
2.7 Serum Collection and Analysis
Blood was collected via cardiac puncture, allowed to clot for 30 min, and spun at 7,000 rpm for 10 min. Isolated serum was stored at -80°C. Triglyceride and cholesterol levels were measured by the automated clinical laboratories at the University of Rochester. PAI-1, MCP-1, leptin, resistin, and insulin levels were determined using a LINCOplex™ (LINCO Research, Inc, St. Charles, MO) mouse serum adipokine kit on the Bio-Rad Bio-Plex™ 200 Suspension Array System. IL-6 levels were determined using a Luminex® Beadlyte® (Upstate, Lake Placed, NY) assay. Blood glucose was measured from tail vein using an Accu-chek Advantage® glucometer (Accu-chek) and HOMA-IR (homeostasis model assessment of insulin resistance) was calculated: (fasting blood glucose (mmol/L) × fasting blood insulin (μU/ml)/22.5 [31].
2.8 Real-Time PCR Analysis
RNA was extracted using TRIzol® (Invitrogen) according to the manufacturer's directions. Reverse transcription was performed using iSCRIPT™ (Bio-Rad). TaqMan probes for Actb, Ccl2, Emr1, Il6, Il10, Socs3, Tnfa, and Hp were purchased from Applied Biosystems and used with TaqMan 2× Master Mix (Applied Biosystems). Primer sequences for assays using Sybr Green (Bio-Rad) can be found in the Supplementary Table. The samples were run on an iCycler IQ real-time PCR detection system (Bio-Rad) and calculations determined as previously described [32].
2.9 Statistical analysis
Statistical analysis was performed using StatView 5 software (SAS Institute, Cary, NC) and Microsoft Excel (2004). Experimental outliers were calculated and removed using interquartile range calculations. Experimental means were compared using ANOVA where sample means from four groups were compared and Student t-test for comparing two groups.
Results
3.1 Diet-induced obesity does not increase hepatic Kupffer cell markers or result in classical activation of Kupffer cells
C57BL/6J mice were fed a normal chow (lean) or high-fat diet for 15 weeks to promote diet-induced obesity (DIO). Levels of two macrophage markers, F4/80 and CD68, were used to assess resident hepatic Kupffer cells. Expression of Emr1 (F4/80) and Cd68 remained unaltered in DIO mice (Fig. 1A). Hepatic expression of Ccl2 (MCP-1) (Fig. 1A) and inflammatory cytokines Il6, Tnfa (TNF-α), and Il10 (Fig. 1B) also remained essentially unaltered following high-fat feeding. These data suggest that the Kupffer cell population is not expanded in DIO mice and that the liver may not be directly contributing to the chronic inflammatory state of obesity.
Figure 1. Diet-induced obesity does not induce Kupffer cell expansion or activation.

C57BL/6J mice were fed a normal chow (lean) or high-fat diet (DIO) ad libitum for 15 weeks. Realtime RT-PCR was performed on RNA extracted from liver tissue. Markers of macrophage presence (Emr1, Cd68) and recruitment (Ccl2) (A), inflammatory cytokines (B), and alternative activation (C) were measured in the liver of lean and DIO mice. Arg1 (arginase 1); Chi3l3 (chitinase 3-like 3); Mgl1 (macrophage galactose N-acetyl-galactosamine specific lectin 1); Mrc2 (mannose receptor, C type 2); Ppard (PPARδ), Il4 (interleukin-4). All markers were normalized to expression of 36B4. Lean mice: mean ±S.E. n=10. DIO mice: mean ±S.E. n=9. *p≤0.05; **p≤0.01
Given the absence of increased inflammatory cytokine production, hepatic markers of alternative activation were examined. Expression of Chi3l3 (chitinase 3-like 3), Mgl1 (macrophage galactose N-acetyl-galactosamine specific lectin 1), and Mrc2 (mannose receptor, C type 2) were all modestly elevated in the liver of DIO mice (Fig. 1C). DIO mice also displayed a 40% increase in expression of Ppard (PPARδ), which Odegaard et al. [21] demonstrated to be required for alternative activation. Expression of IL-4, a cytokine produced by alternatively activated macrophages, was also increased in DIO liver. Expression of arginase 1, a major product of alternative activation remained unaltered. Collectively, these results indicate an increase in alternative activation markers in the liver of DIO mice, which may have functional relevance in this metabolic condition as the results of Odegaard et al. [21] suggest. Since the C57BL/6 strain has impaired alternative activation, the magnitude of activation may not be as robust as that observed in other strains, such as the Th2-prone Balb/c line [33].
In contrast to the liver, the adipose tissue of the DIO mice displayed increased expression of macrophage markers and increased inflammatory cytokine expression. Adipose tissue expression of macrophage markers, Emr1 and Cd68, increased 4- and 7-fold, respectively, in DIO mice compared to lean controls (supplementary Fig. 1A). Expression of Ccl2 was 5-fold elevated, although this induction did not reach statistical significance. A 3-fold induction of Tnfa was observed, while Il6 and Il10 also trended upwards, indicating an active inflammatory environment (supplementary Fig. 1B). As anticipated, the active inflammatory response within the adipose tissue of high-fat-fed mice is associated with increased weight gain (supplementary Fig. 1C), impaired systemic glucose tolerance (supplementary Fig. 1D), increased homeostatic model assessment of insulin resistance (HOMA-IR) (supplementary Fig. 1E), and increased hepatic triglyceride accumulation (supplementary Fig. 1F).
3.2 Kupffer cell ablation using clodronate-containing liposomes
Diet-induced obesity did not expand or classically activate the Kupffer cell population, but increased expression of markers of alternative activation was observed relative to lean controls (Fig. 1C). To more directly examine the role of Kupffer cells in obesity and expand upon the observation that alternatively-activated Kupffer cells have the potential to protect against obesity-associated inflammation, steatosis, and insulin resistance [21], a well-characterized macrophage ablation technique was employed. The majority of intraperitoneally-injected clodronate-containing (CLD) liposomes are phagocytized by Kupffer cells (and peritoneal macrophages), resulting in cellular apoptosis [28, 34]. Using this approach, nearly complete ablation of Kupffer cells was achieved 36 h post-injection in lean and DIO mice. This was confirmed by a loss of F4/80 staining by immunohistochemistry in clodronate-treated liver sections (Supplementary Fig. 2A) and a 98% (lean) and 96% (DIO) loss of Emr1 expression (Supplementary Fig. 2B). Comparable F4/80 staining in lean and DIO liver from PBS-injected animals supports the interpretation that the Kupffer cell population did not expand with high-fat feeding. CLD liposomes did not disrupt adipose tissue macrophages of lean animals, but a 2-fold increase in DIO adipose tissue-associated Emr1 expression was observed (Supplementary Fig. 2B). This latter effect in DIO mice was not associated with increases in circulating levels of IL-6 (Table 1) or inflammatory cytokine-dependent target gene expression in adipose tissue (Supplementary Fig. 2C).
TABLE 1. Serum parameters in DIO mice, 36hr. after CLD liposome administration.
| PBS liposomes | CLD liposomes | ||
|---|---|---|---|
| PAI-1 | 3.5 ng/ml ±0.52 | 4.7 ng/ml ±1.12 | p = 0.345 |
| MCP-1 | 17.3 pg/ml ±1.87 | 46.6 pg/ml ±7.78 | p = 0.002 |
| Leptin | 8.2 ng/ml ±1.23 | 11.1 ng/ml ±1.70 | p = 0.192 |
| Resistin | 2.0 ng/ml ±0.34 | 1.9 ng/ml ±0.44 | p = 0.922 |
| IL-6 | 13.8 pg/ml ±2.68 | 19.2 pg/ml ±11.27 | p = 0.657 |
| IL-10 | 17.1 pg/ml ±2.41 | 14.4 pg/ml ±4.82 | p = 0.607 |
| Triglyceride | 117.2 mg/dl ±10.4 | 124.3 mg/dl ±8.6 | p = 0.631 |
| Cholesterol | 148 mg/dl ±6.3 | 174.3 mg/dl ±4.1 | p = 0.014 |
| Fasted glucose | 130 mg/dl ± 16 | 172 mg/dl ± 21 | p = 0.126 |
| Fasted insulin | 0.28 ng/ml ± 0.07 | 0.76 ng/ml ± 0.3 | p = 0.004 |
Plasminogen activator inhibitor 1 (PAI-1), monocyte chemoattractant protein (MCP-1), leptin, and resistin were measured in serum using Bio-plex™ technology (Bio-Rad). IL-6 and IL-10 were measured using Luminex® Beadlyte® technology (Upstate). All values are the mean ±S.E. of n ≥6. Triglyceride and cholesterol values are the mean ±S.E. of n ≥4. Fasted glucose and insulin values are the mean ±S.E. of n ≥5.
3.3 Loss of Kupffer cells alters the local hepatic inflammatory environment of lean and DIO mice
Kupffer cell ablation in lean mice reduced hepatic expression of Il6 (73%) and Tnfa (46%) (Fig. 2A). Expression of Il6 was reduced by 52% in DIO mice following Kupffer cell ablation, but Tnfa expression remained unaltered (Fig. 2B). A striking 95% and 84% loss of IL-10 expression in lean and DIO mice, respectively, indicates that Kupffer cells are the primary source of this anti-inflammatory cytokine in the liver (Fig. 2A,B).
Figure 2. Loss of Kupffer cells results in increased STAT3-dependent signaling in lean and DIO mice.

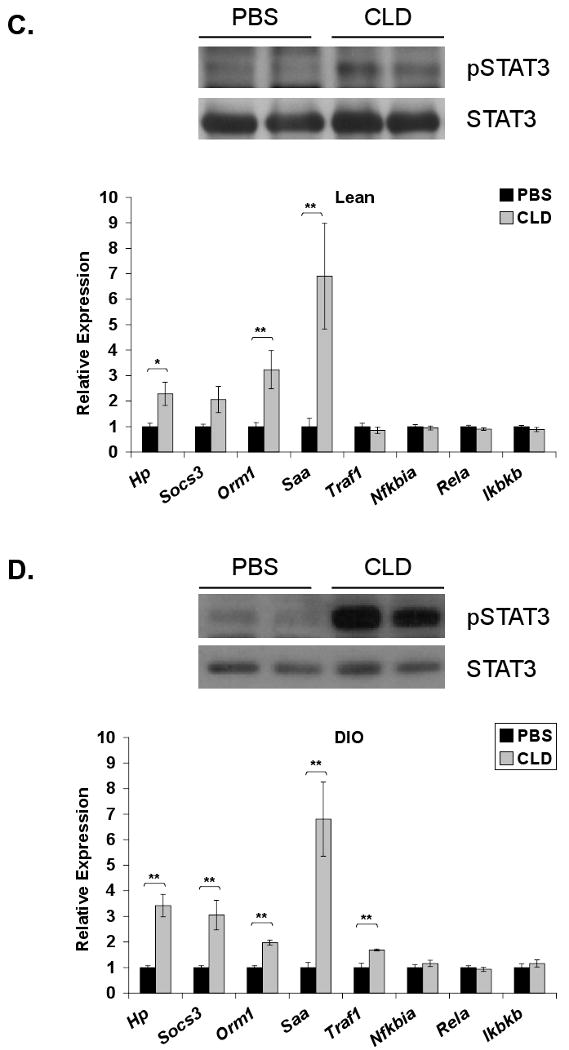
Lean and DIO mice were sacrificed 36 h following an intraperitoneal injection of PBS-containing or clodronate (CLD)-containing liposomes. RNA was extracted from the liver and realtime RT-PCR was performed for expression of inflammatory cytokines in (A) lean (mean ±S.E. n≥6) and (B) DIO (mean ±S.E. n≥16) mice. Hepatic IL-6-responsive genes (Hp, Socs3, Orm1, Saa) and TNF-α responsive genes (Traf1, Nfkbia, Rela, Ikbkb) were also assessed in lean (C) (mean ±S.E. n≥9) and DIO (D) (mean ±S.E. n≥4) mice and normalized to 36B4 expression. Western blot analysis for phosphorylation of STAT3 (Y705) was performed on liver extracts from lean (C) (mean ±S.E. n≥4) and DIO (D) (mean ±S.E. n=12) mice and compared to total STAT3 protein. Representative Western blots are presented. *p≤0.05; **p≤0.01
Although Kupffer cell ablation did not increase hepatic cytokine production, a selective increase in hepatic STAT3 signaling was observed in the liver of lean and DIO mice. Phosphorylation of STAT3 was increased in both lean (Fig. 2C) and DIO (Fig. 2D) mice following Kupffer cell ablation. Acute phase protein family members haptoglobin (Hp), orosomucoid-1 (Orm1), and serum amyloid A (Saa) were approximately 2-, 3-, and 7-fold elevated in lean mice following CLD liposome administration (Fig. 2C). Elevations of these markers were also observed in Kupffer cell ablated DIO mouse livers, with a significant 3-fold increase in suppressor of cytokine signaling (SOCS)-3 (Fig. 2D). In contrast, downstream transcriptional targets of TNF-α or endotoxin via NFκB signaling [35-37] including Traf1, Nfkbia (IκBα), Rela, and Ikbkb (IKKβ) were collectively unchanged in lean liver (Fig. 2C). With the exception of a modest increase in Traf1, they were also unchanged in DIO liver (Fig. 2D). Since IL-6 gene expression within the liver actually trended downward, the increased STAT3-dependent signaling may reflect decreased feedback inhibition of the pathway and/or a response to increased circulating STAT3 agonist.
To explore this possibility, serum cytokine and adipokine markers were assessed in DIO mice following Kupffer cell ablation. Circulating levels of IL-6 and IL-10 in DIO mice remained unaltered following Kupffer cell ablation (Table 1). TNF-α levels were not detectable. No change in the inflammatory marker PAI-1 or adipokine markers (leptin, resistin) was observed. Interestingly, circulating levels of MCP-1 were significantly elevated, possibly reflecting a replenishment mechanism following Kupffer cell ablation. While cholesterol levels were elevated, circulating triglyceride levels remained unchanged.
3.4 Kupffer cell ablation in DIO mice results in increased hepatic lipid accumulation
The reports of Odegaard [21] and Kang [20] suggested that cross-talk between Kupffer cells and hepatocytes could influence hepatic lipid metabolism. It was further proposed that Kupffer cells may protect hepatocytes from steatosis. To test this hypothesis, the impact of Kupffer cell ablation on obesity-associated alterations in lipid metabolism was examined. Lipid accumulation as a result of high-fat feeding was visible by Oil Red O staining in DIO liver sections compared to the lean controls (Fig. 3A). This increase is displayed quantitatively in Supplementary Figure 1F. No qualitative or quantitative change in lipid accumulation was observed in livers of lean mice following Kupffer cell ablation (Fig. 3A and B). Kupffer cell ablation in DIO mice, however, increased hepatic triglyceride accumulation beyond that caused by high-fat feeding alone (Fig. 3A and B). Although serum cholesterol was increased in DIO mice upon Kupffer cell ablation, total hepatic cholesterol remained unaltered (PBS = 1.00 ± 0.11, CLD = 1.03 ± 0.14, p = 0.86). These results support the proposal that Kupffer cells partially protect hepatocytes from dysregulation of hepatic lipid metabolism and steatosis associated with obesity. Protein and gene expression of several lipid metabolic targets was analyzed in the livers of DIO control and DIO Kupffer cell-ablated mice and displayed in Supplementary Figure 3. Of the oxidation, synthesis, and secretion-related markers, only PPARγ mRNA was elevated (supplementary Fig. 3B). Since the modest elevation was not accompanied by changes in any other targets, the significance of this observation is unclear.
Figure 3. Kupffer cell ablation in DIO mice is associated with altered hepatic lipid content.
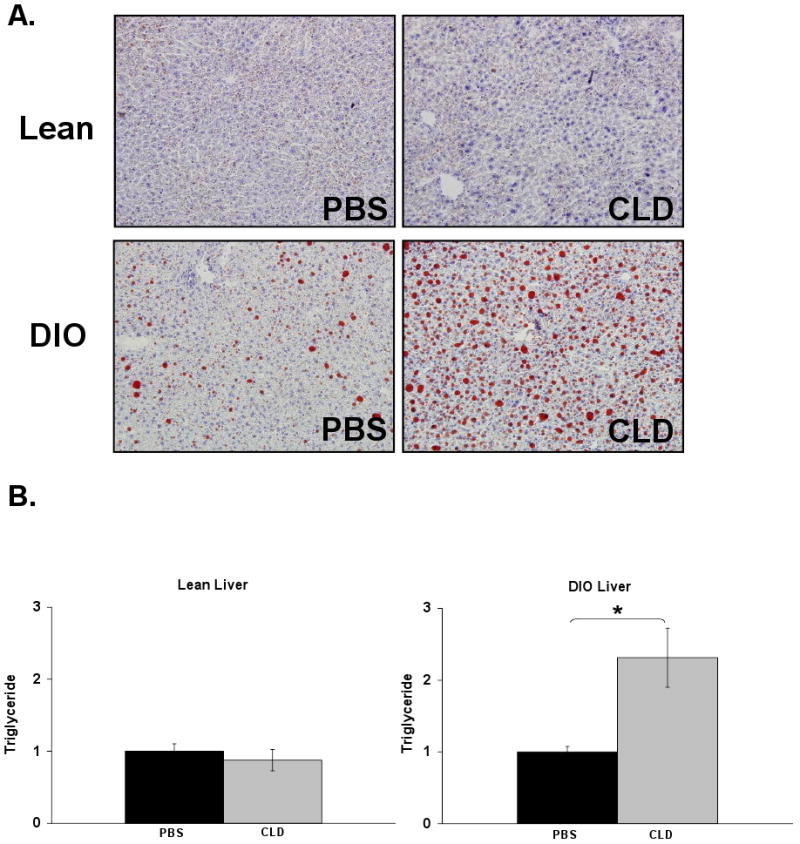
Hepatic lipid content in normal chow-fed (lean) and diet-induced obese (DIO) mice was assessed 36 h following Kupffer cell ablation. A) Representative Oil Red O stained liver sections (20×) are displayed from mice treated with PBS- or CLD-containing liposomes. B) Lipids were extracted from frozen livers of lean (mean ±S.E. n=8) and DIO (mean ±S.E. n=6) mice. Triglyceride content (mg/wet weight) was normalized to protein content (mg/wet weight).
3.5 Kupffer cell ablation in DIO mice impairs hepatic insulin signaling
Given that several reports link IL-6-induced STAT3-dependent signaling and hepatic lipid accumulation with insulin resistance [5, 29, 38], it would be predicted that hepatic insulin signaling would decrease in a Kupffer cell-ablated liver. To test this hypothesis, hepatic response to an insulin bolus was assessed following Kupffer cell ablation. Despite increased STAT3-dependent signaling in Kupffer cell-ablated lean mice, no change in insulin-stimulated insulin receptor autophosphorylation or serine phosphorylation of the downstream signaling mediator Akt was observed (Fig. 4A). In DIO mice, where both STAT3-dependent signaling and increased steatosis were observed, insulin receptor autophosphorylation and Akt serine phosphorylation were reduced 30% and 40%, respectively, upon Kupffer cell ablation (Fig. 4B). These results indicate that increased triglyceride in combination with increased STAT3-dependent signaling is associated with suppressed hepatic insulin signaling following Kupffer cell ablation in DIO mice.
Figure 4. Kupffer cell ablation in DIO mice is associated with impaired hepatic insulin signaling.
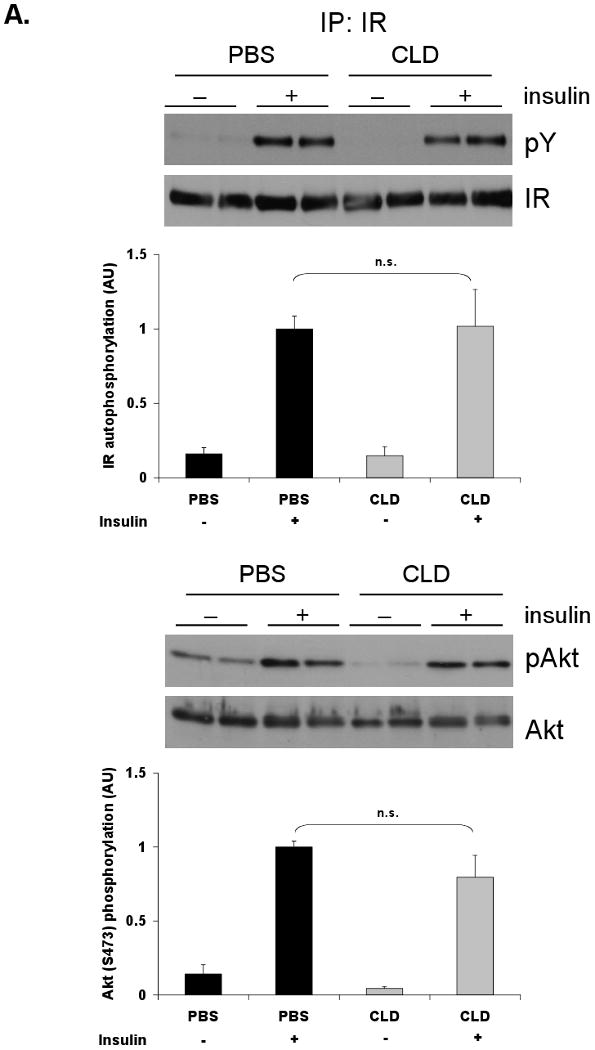

Following Kupffer cell ablation and an overnight fast, lean and DIO mice were given an i.p. insulin bolus (1.5 Units/kg). Tissues were harvested after 10 min. Tyrosine phosphorylation of the insulin receptor (IR) and Akt Ser473 phosphorylation were assessed by Western blot analysis in livers of lean (A) and DIO (B) mice. IR was immunoprecipitated prior to blotting. Each bar represents the mean ± S.E. of n≥7 (lean) and n≥9 (DIO). Mass blots are used to confirm comparable loading. Representative blots are shown. PBS = PBS-containing liposomes. CLD = clodronate-containing liposomes. *p≤0.05; **p≤0.01
3.6 Kupffer cell ablation in DIO mice and systemic response to insulin
Given that clodronate-treated DIO mice displayed impaired hepatic insulin signaling, systemic response to metabolic stimuli was assessed in these mice. Kupffer cell ablation in DIO mice resulted in an increase in HOMA-IR, an index of insulin resistance (Figure 5A). This increase is primarily due to a 3-fold increase in fasting insulin levels (Table 1). In agreement with this result, Kupffer cell ablation of DIO mice modestly impaired insulin-stimulated glucose uptake, but area under the curve (AUC) did not show a significant effect (Figure 5B). Response to a glucose bolus was similar in PBS and clodronate-treated DIO mice (Figure 5C). A pyruvate tolerance test revealed prolonged circulating glucose in response to an i.p. injection of pyruvate in the clodronate-treated animals, but this effect did not reach significance (Figure 5D). These results indicate that Kupffer cell ablation in DIO mice is associated with increased insulin resistance but only minor impairment in metabolic challenge tests.
Figure 5. Kupffer cell ablation in DIO mice has minor impact on systemic insulin response.


DIO mice were Kupffer cell ablated and fasted overnight prior to i.p. injection of glucose, insulin, or pyruvate. Blood glucose was measured from tail vein at 15 min intervals. A) HOMA-IR determined from fasted serum insulin and glucose measurements. PBS n=10; CLD n=7. B) Insulin tolerance test (ITT) in response to 1.5U/kg insulin. C) Glucose tolerance test (GTT) in response to 1.5g/kg glucose. D) Pyruvate tolerance test (PTT) in response to 1.0g/kg sodium pyruvate. Results for ITT are normalized to percent starting (fasted) glucose. AUC is plotted for each challenge test. For tolerance tests, PBS n=5; CLD n>5. PBS = PBS-containing liposomes. CLD = clodronate-containing liposomes. *p≤0.05
3.7 Systemic loss of IL-10 during diet-induced obesity
We hypothesized that loss of Kupffer cell-derived IL-10 may locally or systemically contribute to dysregulation of STAT3 signaling and lipid metabolism in diet-induced obesity. To address this, IL-10 knockout mice (IL-10KO) and matched controls (WT) were subjected to a high-fat diet for 8 weeks. This shorter feeding protocol, compared to Kupffer cell ablation studies (15-17 weeks), was employed to minimize colitis that develops progressively in the IL-10KO mouse model [39]. Induction of insulin resistance was confirmed by increased HOMA-IR in high-fat diet-fed WT and IL-10KO mice compared to lean controls (Fig. 6A). No significant difference in HOMA-IR or body weight (DIO WT = 30.3g ± 1.1; DIO IL-10KO = 33.4 ± 1.3; p = 0.09) was seen, however, between obese WT and IL-10KO mice. Systemic deletion of IL-10 in an obese mouse resulted in increased hepatic STAT3 phosphorylation and 2.5- and 2-fold increases in hepatic Socs3 and Saa expression, respectively (Fig. 6B). These increases occurred in the absence of increased hepatic Il6 message or an increase in circulating IL-6 levels (Figure 6C). Circulating IL-6 levels actually decreased in obese IL-10KO mice. Although the magnitude of hepatic acute phase protein gene induction was less than that observed in lean and DIO mice following Kupffer cell ablation (Fig. 2C,D), these data again suggest an association between loss of IL-10 and increased hepatic STAT3-dependent signaling in high-fat diet induced obesity. Despite a modest reduction in Rela, hepatic expression of most NFκB-responsive genes remained unaltered (Fig. 6B). A statistically significant increase in hepatic triglyceride content was also observed in the livers of the high-fat diet-fed IL-10KO mice compared to their WT counterparts (Fig. 6D). Systemic loss of IL-10 in an obese state, however, did not alter hepatic insulin signaling compared to WT controls (Fig. 6E). Thus, while loss of IL-10 by gene deletion or Kupffer cell ablation is associated with altered hepatic STAT3 signaling, acute phase protein induction, and increased hepatic lipid accumulation, loss of additional Kupffer cell factors are required to further impair obesity-associated hepatic insulin signaling.
Figure 6. DIO IL-10 knockout mice do not display altered hepatic insulin responsiveness.
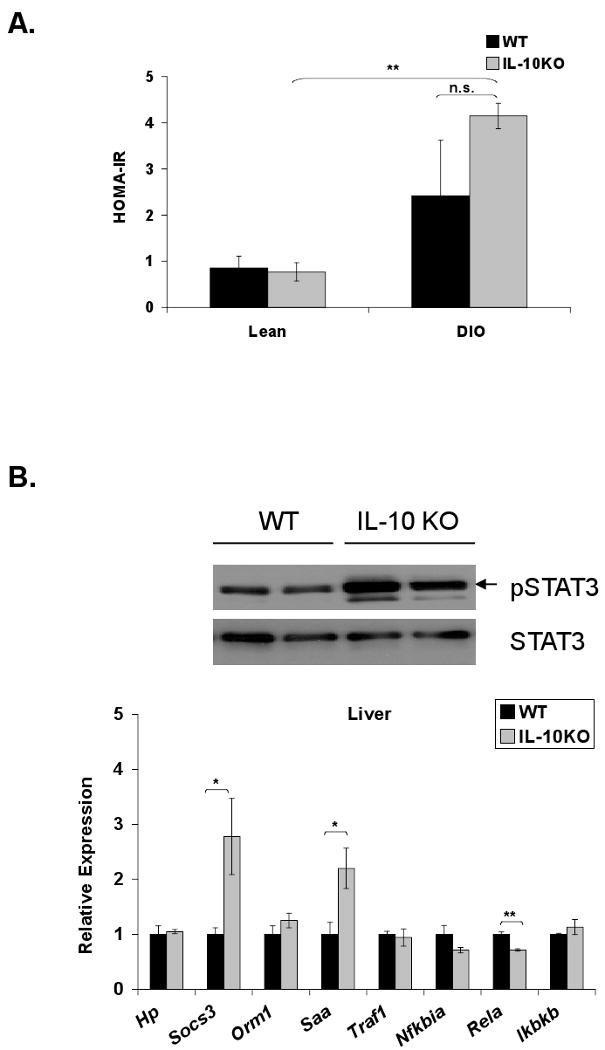

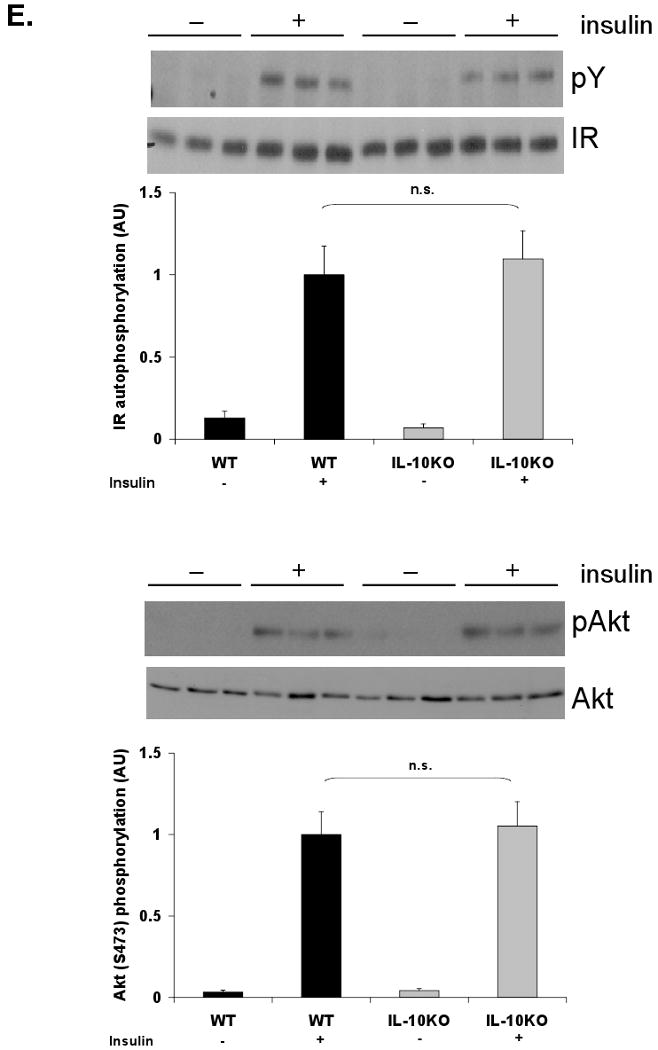
IL-10 knockout (IL-10KO) and wild-type (WT) mice were fed a high-fat diet for 8 weeks. A) HOMA-IR was calculated from glucose and insulin concentrations of 16-h fasted WT and IL-10KO mice (mean ± S.E. of n≥4). B) Western blot analysis for phosphorylation of STAT3 (Y705) was performed on whole cell extracts from WT and IL-10KO mouse liver. Hepatic expression of IL-6-responsive genes and TNF-α responsive genes was assessed by realtime RT-PCR (mean ± S.E. of n=6). C) Hepatic cytokine expression was assessed by realtime RT-PCR (mean ± S.E. of n=6). Circulating IL-6 levels were measured by a Luminex® Beadlyte® assay (mean ± S.E. of n=6). D) Hepatic triglyceride content (mg/wet weight) was quantified in WT and IL-10KO mice and normalized to protein (mg/wet weight) (mean ± S.E. of n=11). High-fat-fed WT and IL-10KO mice were fasted overnight prior to an i.p. injection of insulin (1.5 Units/kg). Tissues were harvested after 10 min. E) Tyrosine phosphorylation of the insulin receptor (IR) and Akt Ser473 phosphorylation in livers of WT and KO mice were assessed by Western blot analysis (mean ± S.E. of n=6). IR was immunoprecipitated prior to blotting. IR and Akt mass blots are included for comparison. *p≤0.05; **p≤0.01
Discussion
Obesity-mediated insulin resistance has been shown to have a strong inflammatory component. Several groups, including Weisberg et al. [11] and Xu et al. [9], have suggested an important role for the adipose tissue-associated macrophage in mediating this inflammatory state and subsequent insulin resistance. In contrast to the characterization of the adipose tissue-associated macrophages, the effect of obesity on the Kupffer cell population is poorly understood. The current study investigated the role of liver macrophages, or Kupffer cells, in a diet-induced obese mouse model of hepatic inflammation and insulin resistance. Our results support the conclusion that Kupffer cells do not contribute to the proinflammatory environment of obesity, but modulate STAT3-dependent signaling and obesity-associated impairment of hepatic lipid metabolism and insulin resistance.
Here we report similar levels of macrophage markers, Emr1 and Cd68, in livers of lean and obese mice, suggesting no expansion of the Kupffer cell population in obesity. F4/80 staining of liver samples from lean and DIO mice supports this interpretation. This is also supported by the observations of Weisberg et al. [11] and Xu et al. [9] who reported similar Kupffer cell numbers despite an increased adipose tissue-associated macrophage population. Cintra et al. [40] and Cai et al. [41], however, report increased Kupffer cell numbers in mice placed on a high-fat diet for 2 and 3 months, respectively. The use of the Swiss mouse strain by Cintra et al. [40] could account for some of this difference, as mouse strains display varied phenotypes. A variation in diet composition, such as the ratio of saturated to unsaturated fat [42], could play a role in the obesity-associated effects seen by Cai et al. [41], but this dietary information was not provided.
In addition to no change in Kupffer cell markers in the liver following high-fat feeding, the absence of a change in hepatic inflammatory cytokine expression suggests that Kupffer cells are not actively contributing to the proinflammatory environment of diet-induced obesity. A collective increase in expression of alternative activation markers suggests that hepatic macrophages do not respond to the Th1 polarizing environment of obesity. These data are in contrast to adipose tissue-associated macrophages which undergo a Th2 to Th1 switch [13] and actively increase production of inflammatory cytokines. Other hepatic immune populations like CD4+NK1.1 cells can mediate alternative activation of Kupffer cells in response to inflammation [43]. Perhaps they also mediate a similar Kupffer cell activation in response to the adipose tissue-derived cytokines and hepatic lipid accumulation.
Kupffer cell-ablated and IL-10KO DIO mice displayed increased hepatic STAT3-dependent signaling. In all cases, this occurred in the absence of increased hepatic IL-6 message, but a dramatic (≥90%) reduction of IL-10. Since IL-10 is an antagonist of IL-6 signaling, we hypothesize that Kupffer cell-derived IL-10 could modulate this response. This observation does not rule out a role for other Kupffer cell-derived direct or indirect cellular mediators of hepatocyte STAT3 signaling. Kupffer cell-derived molecules could be inducing inhibitors of IL-6 or other STAT3-dependent effectors within the hepatocyte, such as protein inhibitor of activated STAT3 (PIAS3), SH2-domain-containing tyrosine phosphatase (SHP2), or p38 stress kinase [44-46]. Alternatively, increased shedding or expression of soluble IL-6 receptor alpha (soluble gp80) following Kupffer cell ablation, could sensitize hepatocytes to circulating IL-6 and increase acute phase protein production [47, 48]. Endotoxin stimulation of CD14 has been reported to activate the acute phase response, especially in the obese state [49], but this seems unlikely in our models as NFκB transcriptional markers remained unaltered.
Both loss of Kupffer cells and systemic absence of IL-10 exacerbated hepatic triglyceride accumulation (steatosis) associated with obesity. This suggests that Kupffer cells and/or IL-10 production impart partial protection against pathologic accumulation of hepatic lipid. In support of this premise, inhibition of Kupffer cells has been shown to decrease PGE2 release within the liver leading to increased hepatic lipid synthesis [50]. In agreement with our DIO IL-10KO model, den Boer and associates also observed that systemic loss of IL-10 during obesity results in hepatic triglyceride accumulation [51]. Loss of IL-10 and increased hepatic STAT3-dependent signaling in our model is not sufficient, however, for increased hepatic lipid accumulation, as lipid content remained unaltered following Kupffer cell ablation in lean mice. A high-fat diet appears to also be necessary. These observations do not rule out the possibility that other Kupffer cell-derived factors could be directly involved in hepatic triglyceride synthesis or secretion during obesity.
Experimental evidence demonstrates that chronic inflammation and altered lipid metabolism associated with obesity directly impair insulin signaling. While many cytokines are involved in the chronic inflammation of obesity, IL-6 appears to be a major effector inhibiting insulin signaling in the liver at least in part through SOCS-3 induction [5, 52, 53]. Lipid accumulation induces oxidative stress and activates serine kinases that impair the insulin-signaling cascade [54-56]. Our Kupffer cell-ablated DIO mice displayed significant increases STAT3-dependent signaling and hepatic triglyceride accumulation. As a result, we hypothesized that insulin signaling would be impaired in this model. Hepatic response to an insulin bolus following Kupffer cell ablation was impaired 30-40% in association with a 3-fold increase in expression of Socs3 in the DIO mice. Despite an increase in HOMA-IR, systemic response to insulin, glucose, or pyruvate was not significantly altered following ablation in DIO mice. These data would suggest that Kupffer cells promote local hepatic insulin action. Since Kupffer cell ablation in lean mice elevated STAT3-dependent gene expression in the absence of impaired insulin signaling, increased STAT3-dependent signaling alone is not sufficient to impair insulin signaling in this model.
Recently, Cintra et al. [40] observed that treatment of DIO Swiss mice with IL-10 neutralizing antibodies or suppressing its expression using antisense techniques increased inflammation and impaired insulin responsiveness. In support of this premise, increased IL-10 expression levels in humans have been correlated with increased insulin sensitivity [57]. While infusion of IL-6 into mice impaired insulin responsiveness during a hyperinsulinemic, euglycemic clamp study, co-infusion of IL-10 was shown to overcome the IL-6 effect [58]. In contrast to this, insulin signaling remained unaltered in our DIO IL-10KO mouse model. This agrees with the observation by den Boer et al. [51] that DIO IL-10 knockout mice displayed altered hepatic lipid metabolism, but unaltered insulin action compared to high-fat-fed wild-type controls. Additional work is needed to clarify the relationship between IL-10, inflammation, and insulin signaling.
Our observations indicate that while IL-10 is associated with modulation of hepatic STAT3-dependent signaling and lipid metabolism in DIO mice, one or more additional Kupffer cell mediators is necessary to partially preserve insulin responsiveness. Reactive oxygen species and ER stress have been directly implicated in the induction of insulin resistance in hepatocytes [55, 59]. Kupffer cell-produced anti-oxidative molecules are potential direct or indirect protective mediators. Activation of the powerful anti-oxidant heme oxygenase-1 (HO-1) [60] reduces obesity-associated inflammation and improves systemic insulin responsiveness in mouse and rat models [61, 62]. Kupffer cells produce HO-1, which has been demonstrated to protect against endotoxemia and oxidative stress in a rat model of ischemia-reperfusion [63]. Kupffer cell ablation may alter synthesis of another powerful anti-oxidant, lipoic acid, which can dampen macrophage inflammatory responses [64] and has also been implicated in protection against oxidative stress-induced insulin resistance [65, 66]. Cyclooxygenase (COX) 1/2 and prostaglandin E2 (PGE2) appear to be integral to resolution of an inflammatory response [67] and lipid accumulation [50]. Both of these latter responses appear to be required for impairment of insulin signaling in our DIO Kupffer cell ablation model.
Very recently, Neyrinck et al [68] demonstrated that inhibition of Kupffer cells in DIO mice by i.p. injection of gadolinium chloride improves HOMA-IR and systemic glucose tolerance in association with reduced hepatic steatosis. While these results are contrary to those reported here, there are important limitations to the gadolinium chloride model that may account for this difference. Gadolinium chloride treatments are associated with hepatocyte proliferation [69]. Gadolinium chloride toxicity and mineral deposition in liver and stomach of rodents has also been documented by Spencer et al. [70] following single injections. The markedly reduced weight gain on a high fat diet observed by Neyrinck et al [68] in mice receiving twice weekly gadolinium chloride injections for 3 weeks may be a related to these tissue changes. Improved insulin sensitivity and glucose tolerance in gadolinium chloride-treated DIO mice could be due to the decreased weight gain independent of changes in Kupffer cell function.
In summary, the results of this investigation indicate that Kupffer cells resist classical activation and do not contribute to the proinflammatory state of high-fat diet-induced obesity. Loss of Kupffer cells in obesity results in a marked loss of hepatic IL-10 expression that is associated with increased hepatic STAT3-dependent signaling and increased lipid accumulation. Kupffer cell loss in DIO mice is also associated with decreased hepatic insulin receptor signaling. Future investigations are necessary to elucidate the mechanism of these Kupffer cell-dependent effects.
Supplementary Material
C57BL/6J mice were fed a normal chow (lean) or high-fat diet (DIO) ad libitum for 15 weeks. Expressional markers of macrophage presence (Emr1, Cd68) and recruitment (Ccl2) (A) and inflammatory cytokines (B) were measured in adipose tissue of lean and DIO mice. All markers were normalized to expression of 36B4. Lean mice: mean ±S.E. n=10. DIO mice: mean ±S.E. n=9. C) Weight gain was assessed in lean and DIO animals over 15 weeks of feeding: mean ±S.E. n=12. D) Glucose tolerance was assessed following intraperitoneal administration of 1.5g/kg glucose. Each point: mean ±S.E. n=4. E) HOMA-IR was calculated from 16-h fasted glucose and insulin levels (mean ±S.E. n=10). F) Triglyceride content (mg/wet weight) was normalized to protein content (mg/wet weight). (mean ±S.E. n=10) *p≤0.05; **p≤0.01
Lean and DIO mice were sacrificed 36 h following an intraperitoneal injection of PBS-containing or clodronate-containing (CLD) liposomes. A) Immunohistochemical staining for F4/80 (brown stain with hematoxylin counter-stain) was performed on formalin-fixed liver sections from lean (upper two panels) and DIO (lower two panels) mice to confirm loss of Kupffer cells. Representative liver sections (20×) are presented. B) Realtime RT-PCR was performed on RNA extracted from liver and adipose tissue of lean (mean ±S.E. n≥7) and DIO (mean ±S.E. n≥16) mice to confirm loss of Emr1 (F4/80) expression (normalized to expression of β-Actin). C) Adipose tissue inflammatory cytokine response gene expression by real time RT-PCR was assessed following clodronate or PBS control treatment. **p≤0.01
Overnight fasted DIO mice were sacrificed 36 h following an intraperitoneal injection of PBS-containing or clodronate-containing (CLD) liposomes. A) Phosphorylation of acetylCoA carboxylase (pACC) and fatty acid synthase (FAS) mass were detected by Western blot analysis in liver cell lysates with β-actin included as a loading control. B) Expression of several lipid metabolic genes (Pparg, Srebf1, Scd1, Ppara, Acox1, and Apob) were assessed by realtime RT-PCR on RNA extracted from liver and normalized to β-actin expression (mean ± S.E., n≥4). *p≤0.05
Acknowledgments
This work was funded by a Research Grant from the American Diabetes Association (7-04-RA-78) to R.A.M. Additional support was provided by United States Public Health Service Grant RO1-DK060732 to R.A.M.
Footnotes
Publisher's Disclaimer: This is a PDF file of an unedited manuscript that has been accepted for publication. As a service to our customers we are providing this early version of the manuscript. The manuscript will undergo copyediting, typesetting, and review of the resulting proof before it is published in its final citable form. Please note that during the production process errors may be discovered which could affect the content, and all legal disclaimers that apply to the journal pertain.
References
- 1.Trayhurn P, Wood IS. Adipokines: inflammation and the pleiotropic role of white adipose tissue. Br J Nutr. 2004;92:347–355. doi: 10.1079/bjn20041213. [DOI] [PubMed] [Google Scholar]
- 2.Kern PA, Ranganathan S, Li C, Wood L, Ranganathan G. Adipose tissue tumor necrosis factor and interleukin-6 expression in human obesity and insulin resistance. Am J Physiol Endocrinol Metab. 2001;280:E745–751. doi: 10.1152/ajpendo.2001.280.5.E745. [DOI] [PubMed] [Google Scholar]
- 3.Kern PA, Saghizadeh M, Ong JM, Bosch RJ, Deem R, Simsolo RB. The expression of tumor necrosis factor in human adipose tissue. Regulation by obesity, weight loss, and relationship to lipoprotein lipase. J Clin Invest. 1995;95:2111–2119. doi: 10.1172/JCI117899. [DOI] [PMC free article] [PubMed] [Google Scholar]
- 4.Bastard JP, Maachi M, Van Nhieu JT, Jardel C, Bruckert E, Grimaldi A, Robert JJ, Capeau J, Hainque B. Adipose tissue IL-6 content correlates with resistance to insulin activation of glucose uptake both in vivo and in vitro. J Clin Endocrinol Metab. 2002;87:2084–2089. doi: 10.1210/jcem.87.5.8450. [DOI] [PubMed] [Google Scholar]
- 5.Senn JJ, Klover PJ, Nowak IA, Zimmers TA, Koniaris LG, Furlanetto RW, Mooney RA. Suppressor of cytokine signaling-3 (SOCS-3), a potential mediator of interleukin-6-dependent insulin resistance in hepatocytes. J Biol Chem. 2003;278:13740–13746. doi: 10.1074/jbc.M210689200. [DOI] [PubMed] [Google Scholar]
- 6.Hotamisligil GS, Shargill NS, Spiegelman BM. Adipose expression of tumor necrosis factor-alpha: direct role in obesity-linked insulin resistance. Science. 1993;259:87–91. doi: 10.1126/science.7678183. [DOI] [PubMed] [Google Scholar]
- 7.Hotamisligil GS, Budavari A, Murray D, Spiegelman BM. Reduced tyrosine kinase activity of the insulin receptor in obesity-diabetes. Central role of tumor necrosis factor-alpha. J Clin Invest. 1994;94:1543–1549. doi: 10.1172/JCI117495. [DOI] [PMC free article] [PubMed] [Google Scholar]
- 8.Hotamisligil GS, Peraldi P, Budavari A, Ellis R, White MF, Spiegelman BM. IRS-1-mediated inhibition of insulin receptor tyrosine kinase activity in TNF-alpha- and obesity-induced insulin resistance. Science. 1996;271:665–668. doi: 10.1126/science.271.5249.665. [DOI] [PubMed] [Google Scholar]
- 9.Xu H, Barnes GT, Yang Q, Tan G, Yang D, Chou CJ, Sole J, Nichols A, Ross JS, Tartaglia LA, Chen H. Chronic inflammation in fat plays a crucial role in the development of obesity-related insulin resistance. J Clin Invest. 2003;112:1821–1830. doi: 10.1172/JCI19451. [DOI] [PMC free article] [PubMed] [Google Scholar]
- 10.Takahashi K, Mizuarai S, Araki H, Mashiko S, Ishihara A, Kanatani A, Itadani H, Kotani H. Adiposity elevates plasma MCP-1 levels leading to the increased CD11b-positive monocytes in mice. J Biol Chem. 2003;278:46654–46660. doi: 10.1074/jbc.M309895200. [DOI] [PubMed] [Google Scholar]
- 11.Weisberg SP, McCann D, Desai M, Rosenbaum M, Leibel RL, Ferrante AW., Jr Obesity is associated with macrophage accumulation in adipose tissue. J Clin Invest. 2003;112:1796–1808. doi: 10.1172/JCI19246. [DOI] [PMC free article] [PubMed] [Google Scholar]
- 12.Lumeng CN, Deyoung SM, Bodzin JL, Saltiel AR. Increased inflammatory properties of adipose tissue macrophages recruited during diet-induced obesity. Diabetes. 2007;56:16–23. doi: 10.2337/db06-1076. [DOI] [PubMed] [Google Scholar]
- 13.Lumeng CN, Bodzin JL, Saltiel AR. Obesity induces a phenotypic switch in adipose tissue macrophage polarization. J Clin Invest. 2007;117:175–184. doi: 10.1172/JCI29881. [DOI] [PMC free article] [PubMed] [Google Scholar]
- 14.Weisberg SP, Hunter D, Huber R, Lemieux J, Slaymaker S, Vaddi K, Charo I, Leibel RL, Ferrante AW., Jr CCR2 modulates inflammatory and metabolic effects of high-fat feeding. J Clin Invest. 2006;116:115–124. doi: 10.1172/JCI24335. [DOI] [PMC free article] [PubMed] [Google Scholar]
- 15.Kanda H, Tateya S, Tamori Y, Kotani K, Hiasa K, Kitazawa R, Kitazawa S, Miyachi H, Maeda S, Egashira K, Kasuga M. MCP-1 contributes to macrophage infiltration into adipose tissue, insulin resistance, and hepatic steatosis in obesity. J Clin Invest. 2006;116:1494–1505. doi: 10.1172/JCI26498. [DOI] [PMC free article] [PubMed] [Google Scholar]
- 16.Tamura Y, Sugimoto M, Murayama T, Ueda Y, Kanamori H, Ono K, Ariyasu H, Akamizu T, Kita T, Yokode M, Arai H. Inhibition of CCR2 Ameliorates Insulin Resistance and Hepatic Steatosis in db/db Mice. Arterioscler Thromb Vasc Biol. 2008 doi: 10.1161/ATVBAHA.108.168633. [DOI] [PubMed] [Google Scholar]
- 17.Gordon S. Alternative activation of macrophages. Nat Rev Immunol. 2003;3:23–35. doi: 10.1038/nri978. [DOI] [PubMed] [Google Scholar]
- 18.Mosser DM. The many faces of macrophage activation. J Leukoc Biol. 2003;73:209–212. doi: 10.1189/jlb.0602325. [DOI] [PubMed] [Google Scholar]
- 19.Odegaard JI, Ricardo-Gonzalez RR, Goforth MH, Morel CR, Subramanian V, Mukundan L, Eagle AR, Vats D, Brombacher F, Ferrante AW, Chawla A. Macrophage-specific PPARgamma controls alternative activation and improves insulin resistance. Nature. 2007;447:1116–1120. doi: 10.1038/nature05894. [DOI] [PMC free article] [PubMed] [Google Scholar]
- 20.Kang K, Reilly SM, Karabacak V, Gangl MR, Fitzgerald K, Hatano B, Lee CH. Adipocyte-derived Th2 cytokines and myeloid PPARdelta regulate macrophage polarization and insulin sensitivity. Cell Metab. 2008;7:485–495. doi: 10.1016/j.cmet.2008.04.002. [DOI] [PMC free article] [PubMed] [Google Scholar]
- 21.Odegaard JI, Ricardo-Gonzalez RR, Red Eagle A, Vats D, Morel CR, Goforth MH, Subramanian V, Mukundan L, Chawla A. Alternative M2 activation of Kupffer cells by PPARdelta ameliorates obesity-induced insulin resistance. Cell Metab. 2008;7:496–507. doi: 10.1016/j.cmet.2008.04.003. [DOI] [PMC free article] [PubMed] [Google Scholar]
- 22.Marathe C, Bradley MN, Hong C, Chao L, Wilpitz D, Salazar J, Tontonoz P. Preserved glucose tolerance in high fat diet-fed C57BL/6 mice transplanted with PPARgamma -/-, PPARdelta -/-, PPARgamma delta -/- or LXRalpha beta -/- bone marrow. J Lipid Res. 2008 doi: 10.1194/jlr.M800189-JLR200. [DOI] [PMC free article] [PubMed] [Google Scholar]
- 23.Ghanim H, Aljada A, Hofmeyer D, Syed T, Mohanty P, Dandona P. Circulating mononuclear cells in the obese are in a proinflammatory state. Circulation. 2004;110:1564–1571. doi: 10.1161/01.CIR.0000142055.53122.FA. [DOI] [PubMed] [Google Scholar]
- 24.Sheth K, Bankey P. The liver as an immune organ. Curr Opin Crit Care. 2001;7:99–104. doi: 10.1097/00075198-200104000-00008. [DOI] [PubMed] [Google Scholar]
- 25.Sun Z, Wada T, Maemura K, Uchikura K, Hoshino S, Diehl AM, Klein AS. Hepatic allograft-derived Kupffer cells regulate T cell response in rats. Liver Transpl. 2003;9:489–497. doi: 10.1053/jlts.2003.50091. [DOI] [PubMed] [Google Scholar]
- 26.Parker GA, Picut CA. Liver immunobiology. Toxicol Pathol. 2005;33:52–62. doi: 10.1080/01926230590522365. [DOI] [PubMed] [Google Scholar]
- 27.Canbay A, Feldstein AE, Higuchi H, Werneburg N, Grambihler A, Bronk SF, Gores GJ. Kupffer cell engulfment of apoptotic bodies stimulates death ligand and cytokine expression. Hepatology. 2003;38:1188–1198. doi: 10.1053/jhep.2003.50472. [DOI] [PubMed] [Google Scholar]
- 28.Van Rooijen N, Sanders A. Liposome mediated depletion of macrophages: mechanism of action, preparation of liposomes and applications. J Immunol Methods. 1994;174:83–93. doi: 10.1016/0022-1759(94)90012-4. [DOI] [PubMed] [Google Scholar]
- 29.Senn JJ, Klover PJ, Nowak IA, Mooney RA. Interleukin-6 induces cellular insulin resistance in hepatocytes. Diabetes. 2002;51:3391–3399. doi: 10.2337/diabetes.51.12.3391. [DOI] [PubMed] [Google Scholar]
- 30.Burant CF, Sreenan S, Hirano K, Tai TA, Lohmiller J, Lukens J, Davidson NO, Ross S, Graves RA. Troglitazone action is independent of adipose tissue. J Clin Invest. 1997;100:2900–2908. doi: 10.1172/JCI119839. [DOI] [PMC free article] [PubMed] [Google Scholar]
- 31.Katsuki A, Sumida Y, Gabazza EC, Murashima S, Furuta M, Araki-Sasaki R, Hori Y, Yano Y, Adachi Y. Homeostasis model assessment is a reliable indicator of insulin resistance during follow-up of patients with type 2 diabetes. Diabetes Care. 2001;24:362–365. doi: 10.2337/diacare.24.2.362. [DOI] [PubMed] [Google Scholar]
- 32.Klover PJ, Clementi AH, Mooney RA. Interleukin-6 depletion selectively improves hepatic insulin action in obesity. Endocrinology. 2005;146:3417–3427. doi: 10.1210/en.2004-1468. [DOI] [PubMed] [Google Scholar]
- 33.Mills CD, Kincaid K, Alt JM, Heilman MJ, Hill AM. M-1/M-2 macrophages and the Th1/Th2 paradigm. J Immunol. 2000;164:6166–6173. doi: 10.4049/jimmunol.164.12.6166. [DOI] [PubMed] [Google Scholar]
- 34.Van Rooijen N, Sanders A. Kupffer cell depletion by liposome-delivered drugs: comparative activity of intracellular clodronate, propamidine, and ethylenediaminetetraacetic acid. Hepatology. 1996;23:1239–1243. doi: 10.1053/jhep.1996.v23.pm0008621159. [DOI] [PubMed] [Google Scholar]
- 35.Gay NJ, Gangloff M. Structure and function of Toll receptors and their ligands. Annu Rev Biochem. 2007;76:141–165. doi: 10.1146/annurev.biochem.76.060305.151318. [DOI] [PubMed] [Google Scholar]
- 36.Baud V, Karin M. Signal transduction by tumor necrosis factor and its relatives. Trends Cell Biol. 2001;11:372–377. doi: 10.1016/s0962-8924(01)02064-5. [DOI] [PubMed] [Google Scholar]
- 37.Tian B, Nowak DE, Brasier AR. A TNF-induced gene expression program under oscillatory NF-kappaB control. BMC Genomics. 2005;6:137. doi: 10.1186/1471-2164-6-137. [DOI] [PMC free article] [PubMed] [Google Scholar]
- 38.Boden G, She P, Mozzoli M, Cheung P, Gumireddy K, Reddy P, Xiang X, Luo Z, Ruderman N. Free fatty acids produce insulin resistance and activate the proinflammatory nuclear factor-kappaB pathway in rat liver. Diabetes. 2005;54:3458–3465. doi: 10.2337/diabetes.54.12.3458. [DOI] [PubMed] [Google Scholar]
- 39.Berg DJ, Davidson N, Kuhn R, Muller W, Menon S, Holland G, Thompson-Snipes L, Leach MW, Rennick D. Enterocolitis and colon cancer in interleukin-10-deficient mice are associated with aberrant cytokine production and CD4(+) TH1-like responses. J Clin Invest. 1996;98:1010–1020. doi: 10.1172/JCI118861. [DOI] [PMC free article] [PubMed] [Google Scholar]
- 40.Cintra DE, Pauli JR, Araujo EP, Moraes JC, de Souza CT, Milanski M, Morari J, Gambero A, Saad MJ, Velloso LA. Interleukin-10 is a protective factor against diet-induced insulin resistance in liver. J Hepatol. 2008;48:628–637. doi: 10.1016/j.jhep.2007.12.017. [DOI] [PubMed] [Google Scholar]
- 41.Cai D, Yuan M, Frantz DF, Melendez PA, Hansen L, Lee J, Shoelson SE. Local and systemic insulin resistance resulting from hepatic activation of IKK-beta and NF-kappaB. Nat Med. 2005;11:183–190. doi: 10.1038/nm1166. [DOI] [PMC free article] [PubMed] [Google Scholar]
- 42.Kim YB, Nakajima R, Matsuo T, Inoue T, Sekine T, Komuro M, Tamura T, Tokuyama K, Suzuki M. Gene expression of insulin signal-transduction pathway intermediates is lower in rats fed a beef tallow diet than in rats fed a safflower oil diet. Metabolism. 1996;45:1080–1088. doi: 10.1016/s0026-0495(96)90006-2. [DOI] [PubMed] [Google Scholar]
- 43.Li Z, Soloski MJ, Diehl AM. Dietary factors alter hepatic innate immune system in mice with nonalcoholic fatty liver disease. Hepatology. 2005;42:880–885. doi: 10.1002/hep.20826. [DOI] [PubMed] [Google Scholar]
- 44.Lehmann U, Schmitz J, Weissenbach M, Sobota RM, Hortner M, Friederichs K, Behrmann I, Tsiaris W, Sasaki A, Schneider-Mergener J, Yoshimura A, Neel BG, Heinrich PC, Schaper F. SHP2 and SOCS3 contribute to Tyr-759-dependent attenuation of interleukin-6 signaling through gp130. J Biol Chem. 2003;278:661–671. doi: 10.1074/jbc.M210552200. [DOI] [PubMed] [Google Scholar]
- 45.Chung CD, Liao J, Liu B, Rao X, Jay P, Berta P, Shuai K. Specific inhibition of Stat3 signal transduction by PIAS3. Science. 1997;278:1803–1805. doi: 10.1126/science.278.5344.1803. [DOI] [PubMed] [Google Scholar]
- 46.Ahmed ST, Mayer A, Ji JD, Ivashkiv LB. Inhibition of IL-6 signaling by a p38-dependent pathway occurs in the absence of new protein synthesis. J Leukoc Biol. 2002;72:154–162. [PubMed] [Google Scholar]
- 47.Scheller J, Rose-John S. Interleukin-6 and its receptor: from bench to bedside. Med Microbiol Immunol. 2006;195:173–183. doi: 10.1007/s00430-006-0019-9. [DOI] [PubMed] [Google Scholar]
- 48.Mackiewicz A, Schooltink H, Heinrich PC, Rose-John S. Complex of soluble human IL-6-receptor/IL-6 up-regulates expression of acute-phase proteins. J Immunol. 1992;149:2021–2027. [PubMed] [Google Scholar]
- 49.Cani PD, Bibiloni R, Knauf C, Waget A, Neyrinck AM, Delzenne NM, Burcelin R. Changes in gut microbiota control metabolic endotoxemia-induced inflammation in high-fat diet-induced obesity and diabetes in mice. Diabetes. 2008;57:1470–1481. doi: 10.2337/db07-1403. [DOI] [PubMed] [Google Scholar]
- 50.Neyrinck AM, Margagliotti S, Gomez C, Delzenne NM. Kupffer cell-derived prostaglandin E2 is involved in regulation of lipid synthesis in rat liver tissue. Cell Biochem Funct. 2004;22:327–332. doi: 10.1002/cbf.1110. [DOI] [PubMed] [Google Scholar]
- 51.den Boer MA, Voshol PJ, Schroder-van der Elst JP, Korsheninnikova E, Ouwens DM, Kuipers F, Havekes LM, Romijn JA. Endogenous interleukin-10 protects against hepatic steatosis but does not improve insulin sensitivity during high-fat feeding in mice. Endocrinology. 2006;147:4553–4558. doi: 10.1210/en.2006-0417. [DOI] [PubMed] [Google Scholar]
- 52.Shi H, Tzameli I, Bjorbaek C, Flier JS. Suppressor of cytokine signaling 3 is a physiological regulator of adipocyte insulin signaling. J Biol Chem. 2004;279:34733–34740. doi: 10.1074/jbc.M403886200. [DOI] [PubMed] [Google Scholar]
- 53.Rui L, Yuan M, Frantz D, Shoelson S, White MF. SOCS-1 and SOCS-3 block insulin signaling by ubiquitin-mediated degradation of IRS1 and IRS2. J Biol Chem. 2002;277:42394–42398. doi: 10.1074/jbc.C200444200. [DOI] [PubMed] [Google Scholar]
- 54.Hirosumi J, Tuncman G, Chang L, Gorgun CZ, Uysal KT, Maeda K, Karin M, Hotamisligil GS. A central role for JNK in obesity and insulin resistance. Nature. 2002;420:333–336. doi: 10.1038/nature01137. [DOI] [PubMed] [Google Scholar]
- 55.Ozcan U, Cao Q, Yilmaz E, Lee AH, Iwakoshi NN, Ozdelen E, Tuncman G, Gorgun C, Glimcher LH, Hotamisligil GS. Endoplasmic reticulum stress links obesity, insulin action, and type 2 diabetes. Science. 2004;306:457–461. doi: 10.1126/science.1103160. [DOI] [PubMed] [Google Scholar]
- 56.Griffin ME, Marcucci MJ, Cline GW, Bell K, Barucci N, Lee D, Goodyear LJ, Kraegen EW, White MF, Shulman GI. Free fatty acid-induced insulin resistance is associated with activation of protein kinase C theta and alterations in the insulin signaling cascade. Diabetes. 1999;48:1270–1274. doi: 10.2337/diabetes.48.6.1270. [DOI] [PubMed] [Google Scholar]
- 57.van Exel E, Gussekloo J, de Craen AJ, Frolich M, Bootsma-Van Der Wiel A, Westendorp RG. Low production capacity of interleukin-10 associates with the metabolic syndrome and type 2 diabetes : the Leiden 85-Plus Study. Diabetes. 2002;51:1088–1092. doi: 10.2337/diabetes.51.4.1088. [DOI] [PubMed] [Google Scholar]
- 58.Kim HJ, Higashimori T, Park SY, Choi H, Dong J, Kim YJ, Noh HL, Cho YR, Cline G, Kim YB, Kim JK. Differential effects of interleukin-6 and -10 on skeletal muscle and liver insulin action in vivo. Diabetes. 2004;53:1060–1067. doi: 10.2337/diabetes.53.4.1060. [DOI] [PubMed] [Google Scholar]
- 59.Houstis N, Rosen ED, Lander ES. Reactive oxygen species have a causal role in multiple forms of insulin resistance. Nature. 2006;440:944–948. doi: 10.1038/nature04634. [DOI] [PubMed] [Google Scholar]
- 60.Bauer I, Rensing H, Florax A, Ulrich C, Pistorius G, Redl H, Bauer M. Expression pattern and regulation of heme oxygenase-1/heat shock protein 32 in human liver cells. Shock. 2003;20:116–122. doi: 10.1097/01.shk.0000075568.93053.fa. [DOI] [PubMed] [Google Scholar]
- 61.Nicolai A, Li M, Kim DH, Peterson SJ, Vanella L, Positano V, Gastaldelli A, Rezzani R, Rodella LF, Drummond G, Kusmic C, L'Abbate A, Kappas A, Abraham NG. Heme oxygenase-1 induction remodels adipose tissue and improves insulin sensitivity in obesity-induced diabetic rats. Hypertension. 2009;53:508–515. doi: 10.1161/HYPERTENSIONAHA.108.124701. [DOI] [PMC free article] [PubMed] [Google Scholar]
- 62.Li M, Kim DH, Tsenovoy PL, Peterson SJ, Rezzani R, Rodella LF, Aronow WS, Ikehara S, Abraham NG. Treatment of obese diabetic mice with a heme oxygenase inducer reduces visceral and subcutaneous adiposity, increases adiponectin levels, and improves insulin sensitivity and glucose tolerance. Diabetes. 2008;57:1526–1535. doi: 10.2337/db07-1764. [DOI] [PubMed] [Google Scholar]
- 63.Kobayashi T, Hirano K, Yamamoto T, Hasegawa G, Hatakeyama K, Suematsu M, Naito M. The protective role of Kupffer cells in the ischemia-reperfused rat liver. Arch Histol Cytol. 2002;65:251–261. doi: 10.1679/aohc.65.251. [DOI] [PubMed] [Google Scholar]
- 64.Kiemer AK, Muller C, Vollmar AM. Inhibition of LPS-induced nitric oxide and TNF-alpha production by alpha-lipoic acid in rat Kupffer cells and in RAW 264.7 murine macrophages. Immunol Cell Biol. 2002;80:550–557. doi: 10.1046/j.1440-1711.2002.01124.x. [DOI] [PubMed] [Google Scholar]
- 65.Pershadsingh HA. Alpha-lipoic acid: physiologic mechanisms and indications for the treatment of metabolic syndrome. Expert Opin Investig Drugs. 2007;16:291–302. doi: 10.1517/13543784.16.3.291. [DOI] [PubMed] [Google Scholar]
- 66.Konrad D. Utilization of the insulin-signaling network in the metabolic actions of alpha-lipoic acid-reduction or oxidation? Antioxid Redox Signal. 2005;7:1032–1039. doi: 10.1089/ars.2005.7.1032. [DOI] [PubMed] [Google Scholar]
- 67.Willoughby DA, Moore AR, Colville-Nash PR, Gilroy D. Resolution of inflammation. Int J Immunopharmacol. 2000;22:1131–1135. doi: 10.1016/s0192-0561(00)00064-3. [DOI] [PubMed] [Google Scholar]
- 68.Neyrinck AM, Cani PD, Dewulf EM, De Backer F, Bindels LB, Delzenne NM. Critical role of Kupffer cells in the management of diet-induced diabetes and obesity. Biochem Biophys Res Commun. 2009;385:351–356. doi: 10.1016/j.bbrc.2009.05.070. [DOI] [PubMed] [Google Scholar]
- 69.Rose ML, Bradford BU, Germolec DR, Lin M, Tsukamoto H, Thurman RG. Gadolinium chloride-induced hepatocyte proliferation is prevented by antibodies to tumor necrosis factor alpha. Toxicol Appl Pharmacol. 2001;170:39–45. doi: 10.1006/taap.2000.9077. [DOI] [PubMed] [Google Scholar]
- 70.Spencer AJ, Wilson SA, Batchelor J, Reid A, Rees J, Harpur E. Gadolinium chloride toxicity in the rat. Toxicol Pathol. 1997;25:245–255. doi: 10.1177/019262339702500301. [DOI] [PubMed] [Google Scholar]
Associated Data
This section collects any data citations, data availability statements, or supplementary materials included in this article.
Supplementary Materials
C57BL/6J mice were fed a normal chow (lean) or high-fat diet (DIO) ad libitum for 15 weeks. Expressional markers of macrophage presence (Emr1, Cd68) and recruitment (Ccl2) (A) and inflammatory cytokines (B) were measured in adipose tissue of lean and DIO mice. All markers were normalized to expression of 36B4. Lean mice: mean ±S.E. n=10. DIO mice: mean ±S.E. n=9. C) Weight gain was assessed in lean and DIO animals over 15 weeks of feeding: mean ±S.E. n=12. D) Glucose tolerance was assessed following intraperitoneal administration of 1.5g/kg glucose. Each point: mean ±S.E. n=4. E) HOMA-IR was calculated from 16-h fasted glucose and insulin levels (mean ±S.E. n=10). F) Triglyceride content (mg/wet weight) was normalized to protein content (mg/wet weight). (mean ±S.E. n=10) *p≤0.05; **p≤0.01
Lean and DIO mice were sacrificed 36 h following an intraperitoneal injection of PBS-containing or clodronate-containing (CLD) liposomes. A) Immunohistochemical staining for F4/80 (brown stain with hematoxylin counter-stain) was performed on formalin-fixed liver sections from lean (upper two panels) and DIO (lower two panels) mice to confirm loss of Kupffer cells. Representative liver sections (20×) are presented. B) Realtime RT-PCR was performed on RNA extracted from liver and adipose tissue of lean (mean ±S.E. n≥7) and DIO (mean ±S.E. n≥16) mice to confirm loss of Emr1 (F4/80) expression (normalized to expression of β-Actin). C) Adipose tissue inflammatory cytokine response gene expression by real time RT-PCR was assessed following clodronate or PBS control treatment. **p≤0.01
Overnight fasted DIO mice were sacrificed 36 h following an intraperitoneal injection of PBS-containing or clodronate-containing (CLD) liposomes. A) Phosphorylation of acetylCoA carboxylase (pACC) and fatty acid synthase (FAS) mass were detected by Western blot analysis in liver cell lysates with β-actin included as a loading control. B) Expression of several lipid metabolic genes (Pparg, Srebf1, Scd1, Ppara, Acox1, and Apob) were assessed by realtime RT-PCR on RNA extracted from liver and normalized to β-actin expression (mean ± S.E., n≥4). *p≤0.05