

Abstract
Flat substrate surfaces are a key to successful imaging of biological macromolecules by atomic force microscopy (AFM). Although usable substrate surfaces have been prepared for still imaging of immobilized molecules, surfaces that are more suitable have recently been required for dynamic imaging to accompany the progress of the scan speed of AFM. In fact, the state-of-the-art high-speed AFM has achieved temporal resolution of 30 ms, a capacity allowing us to trace molecular processes played by biological macromolecules. Here, we characterize three types of streptavidin two-dimensional crystals as substrates, concerning their qualities of surface roughness, uniformity, stability, and resistance to nonspecific protein adsorption. These crystal surfaces are commonly resistant to nonspecific protein adsorption, but exhibit differences in other properties to some extent. These differences must be taken into consideration, but these crystal surfaces are still useful for dynamic AFM imaging, as demonstrated by observation of calcium-induced changes in calmodulin, GroES binding to GroEL, and actin polymerization on the surfaces.
Introduction
Atomic force microscopy (AFM) (1) has become a powerful tool for high-resolution visualization of biological samples in aqueous solutions (2–4). Immobilization of biological molecules onto a planar support is prerequisite for the imaging, and therefore, selecting or preparing appropriate substrates is a key to successful imaging. Thus far, a number of immobilization methods have been developed to this end (5–7). Bare mica surface has been frequently used for reproducible imaging of biological samples because it is atomically flat over a wide area and many proteins attach to the surface under buffer solutions. However, because of the electrostatic adsorption, its attachment is often weak and selective attachment in controlled orientation cannot be achieved, except for rare cases. To achieve a firm attachment, the technique of chemisorption of biomolecules onto self-assembled monolayers of molecules, terminated with chemically reactive groups, has been used (8,9). This immobilization can avoid displacement of biomolecules by a scanning tip. These methods for sample attachment have contributed to the success of still imaging and slow time-lapse imaging (10–13) of biological samples.
Recent advent of high-speed AFM expands the usefulness of AFM for biological research (14,15). Its maximum imaging rate of 33 frames/s enables direct imaging of biomolecular processes in real time. However, for dynamic AFM imaging of molecular processes, previously used substrate surfaces are often useless. Biomolecular processes often contain dynamic interactions between molecules. When all molecules are attached to a surface, they have almost no chance to interact with each other. In addition to such generally required conditions for the surfaces as a small amount of roughness for identifying the molecules of interest, and a high affinity for the sample, dynamic AFM imaging also requires selective attachment of a specific component in a multicomponent sample, controlled orientation of immobilized molecule, and a lack of perturbation to the biological function of the sample (i.e., absence of nonspecific interactions).
In a pioneering study (16), streptavidin two-dimensional (2D) crystals formed on biotin-containing planar lipid layers (17–20) was imaged by AFM, and their use for biomolecule attachment in AFM studies was proposed. Here, we examined whether the surfaces of streptavidin 2D crystals can fulfill the above-mentioned requirements. Streptavidin is comprised of four identical subunits, each of which specifically binds to one biotin molecule with a strong affinity (Ka ≈ 1013 M−1) (21). In the 2D crystals, the two biotin binding sites face the free solution, and therefore, can bind to biotinylated samples to be imaged (18,20). Since biotinylated Ni-NTA is commercially available, the surface also can immobilize His-tag conjugated recombinant proteins without lateral diffusion (note that His-tag conjugated proteins can be directly attached to a Ni-NTA containing lipid bilayer surface, but lateral diffusion occurs because of fluidity of the lipid bilayer). Importantly, streptavidin is resistant to nonspecific binding to many proteins (21), which possibly guarantees the surface-bound proteins against dysfunction (22).
On biotinylated planar lipid layers, streptavidin self-assembles into three distinct crystalline arrangements (i.e., types 1–3 with P2 symmetry), which depend on crystallization conditions such as pH (23) and ionic strength (24). Here, we characterize these different 2D crystals taking into consideration the stability, degree of order, surface roughness, and nonspecific binding. Although the surfaces of these crystals satisfy the required conditions for dynamic imaging of molecular processes, our characterization results indicate that it would be better to consider their different properties depending on the sample to be imaged.
Using high-speed AFM, we demonstrate the applicability of these crystal surfaces to dynamic AFM imaging by observing three different samples. For immobilized calmodulin (CaM), we detected its structural changes upon calcium binding. GroEL was immobilized in a controlled orientation (i.e., side-on orientation) by introducing biotin at the outer surface of the equatorial domain of GroEL. Using this orientation (in which both ends of GroEL double rings are accessible to GroES), binding of GroES to GroEL was successfully visualized. The process of actin polymerization was also visualized. Thus, the streptavidin 2D crystals are shown to be a useful tool for high-speed AFM imaging of biomolecular processes.
Materials and Methods
Materials
We obtained following materials and used without further purification; streptavidin, Wako Pure Chemical (Osaka, Japan); bovine brain CaM, Calbiochem (Darmstadt, Germany); lipids, Avanti Polar Lipids (Alabaster, AL); biotin-(AC5)2-sulfo-osu and biotin-PEAC5-maleimide, Dojindo Laboratories (Kumamoto, Japan); Cy3-osu, GE Healthcare (Buckinghamshire, UK); and phalloidin, Invitrogen (Carlsbad, CA). Coverslips and natural muscovite mica were purchased from Matsunami (Osaka, Japan) and Nilaco (Tokyo, Japan), respectively.
Coverslips
Coverslips were washed for 30 min with detergent in an ultrasonic bath, and then boiled in H2SO4/H2O2 (80:20, v/v) to remove hydrocarbon contaminants. After rinsing with MilliQ water (Millipore, Billerica, MA), the coverslips were immersed in 6 M KOH for 12 h. Subsequently, the cleaned coverslips were sonicated in MilliQ water.
Preparation of streptavidin 2D crystals
For the measurement by total internal reflection fluorescence microscopy (TIRFM), coverslips are used as the solid support for biotinylated lipid bilayers; a flow cell was built using two coverslips (24 × 36 mm2 and 18 × 18 mm2), between which a space was created by two strips of double-sided sticky tape, forming a center channel for injecting samples and buffer solutions. For AFM imaging, either mica (1-mm diameter) or a coverslip (2 × 2 mm2) were used as the solid support. Streptavidin 2D crystals were formed on supported biotin-containing lipid bilayers as described (25). Briefly, a supported biotin-containing lipid bilayer was first obtained by applying small unilamellar vesicles (0.125 mM) of lipids to a solid support. The lipid compositions were dioleoylphosphatidylcholine, dioleoylphosphatidylserine, and 1,2-dioleoyl-sn-glycero-3-phosphoethanolamine-N-(cap biotinyl) (biotinylated lipid) at 7:2:1 (w/w). After washing out the excess lipids with a crystallization buffer solution, a 0.1–0.2 mg/ml streptavidin solution was placed on the biotinylated lipid bilayer and incubated at room temperature in a sealed container. The crystallization buffers used were 10 mM HEPES, 150 mM NaCl, and 2 mM CaCl2 (pH 7.4) for the type-1 P2 crystal; 10 mM MES, 450 mM NaCl, and 2 mM CaCl2 (pH 5.8) for the type-2 P2 crystal; and 10 mM acetate, 450 mM NaCl, and 2 mM CaCl2 (pH 4.0) for the type-3 P2 crystal. After the incubation for at least 2 h, the excess streptavidin was washed out with the buffer solution used for crystallization. For the chemical fixation of the streptavidin crystals, a 10 mM glutaraldehyde-containing crystallization solution was applied and incubated for 5 min. The reaction was quenched using 20 mM Tris mixed in the crystallization buffer. To distinguish the crystal types in this article, we used the notations type-1, type-2, and type-3. (Note that, for the type-1 P2 crystal, C222 has been used before in a 2D image in the literature (16,20,25). Also please note that, although the notation P1 has been used for the type-3 P2 crystal (23,24), it certainly has P2 symmetry because the top view of the surface-attached streptavidin tetramer itself has a twofold rotation symmetry.)
Biological samples
CaM
To prepare biotinylated CaM, CaM was reacted with biotin-(AC5)2-sulfo-osu as described previously (26). For the fluorescent labeling, nonbiotinylated or biotinylated CaM was reacted with Cy3-osu as described (26). The molar ratio of biotin to CaM in the biotinylated CaM was determined to be 0.6 based on the avidin-2-(4′-Hydroxybenzeneazo)benzoic acid assay (27). The molar ratio of conjugated Cy3 to CaM was 0.7–1.9 throughout the study. Before the immobilization of biotinylated CaM, the streptavidin 2D crystals were washed with buffer A (20 mM imidazole, 100 mM KCl, 2 mM MgCl2, 1 mM EGTA, pH 7.6). To distinguish specific and nonspecific binding, 0.1 nM of biotinylated or nonbiotinylated Cy3-CaM in buffer A was infused to the flow cell. After incubating for 3 min, the sample was washed with buffer A to remove excess Cy3-CaM. To further examine the nonspecific adsorption, a 100-times higher concentration (i.e., 10 nM) of nonbiotinylated Cy3-CaM was infused to the flow cell and then observed by TIRFM. For AFM observations, 200 nM biotinylated or nonlabeled CaM in buffer A was deposited onto the streptavidin type-3 P2 crystal formed on mica-supported lipid bilayer. After 3 min, the sample was washed with buffer A to remove unattached CaM. The AFM measurements were performed in buffer A in the presence or absence of 2 mM Ca2+.
GroEL and GroEL-GroES complexes
The GroEL D490C mutant was produced by site-directed mutagenesis. D490C GroEL and wild-type GroES were expressed in Escherichia coli XL1-Blue and purified as described (28). D490C GroEL was dialyzed against buffer B (50 mM HEPES-KOH, 50 mM KCl, 10 mM MgCl2, pH 7.4) containing 2 mM Tris (2-carboxyethyl) phosphine hydrochloride and then biotinylated by the reaction with biotin-PEAC5-maleimide (molar ratio of reagent to subunit equal to 1) for 30 min at 25°C. The reaction was quenched with 5 mM dithreitol (DTT). To remove unreacted biotin, the sample was dialyzed against buffer B containing 2 mM DTT. The molar ratio of biotin to GroEL subunit was 0.8. The streptavidin type-1 P2 crystal formed on mica-supported lipid bilayer was used as a substrate after fixing with glutaraldehyde. The streptavidin crystal was rinsed with buffer B. For high-speed AFM observation, the biotinylated GroEL was diluted to 25 nM in buffer B and deposited to the streptavidin crystal. After 3 min, the sample was washed with buffer B to remove unattached GroEL. High-speed AFM measurement of GroEL-GroES complex was performed in buffer B in the presence of 1 μM GroES, 1 mM ADP, and 2 mM DTT.
Actin
Actin was purified from rabbit skeletal muscles as described (27). Partially biotinylated F-actin was prepared as follows. G-actin was reacted with biotin-(AC5)2-sulfo-osu as described (29). The molar ratio of conjugated biotin to G-actin was 2.0. The biotinylated G-actin was copolymerized with nonbiotinylated G-actin (1:9 molar ratio) in buffer A containing 0.2 mM ATP, and then stabilized with phalloidin. As a substrate, the streptavidin type-2 P2 crystal formed on mica-supported lipid bilayer was used after fixing with glutaraldehyde. The streptavidin crystal was rinsed with buffer A. One micromolar of partially biotinylated F-actin in buffer A was deposited to the 2D crystal. After 3 min, the sample was washed with buffer A to remove excess actin. High-speed AFM visualization of polymerization processes of single actin filaments were performed in buffer A in the presence of 1 μM nonbiotinylated G-actin, 0.2 mM ATP, and 2 mM DTT.
TIRFM
Fluorescently labeled proteins were illuminated with a diode pumped green laser (532 nm; CrystaLaser, Reno, NV). The fluorescence images were captured at 10 frames/s using an inverted fluorescence microscope (IX71; Olympus, Tokyo, Japan) equipped with a high NA objective lens (100× Apo TIRF NA = 1.49; Nikon, Tokyo, Japan) and a charge-coupled device camera (Andor Technology, Belfast, Northern Ireland). The recorded images were averaged over 10 frames.
AFM imaging
For scan sizes ≥500 nm, images were recorded with a commercial AFM (Nanoscope IVa; Veeco, Santa Barbara, CA) in the tapping mode, using cantilevers (BioLever mini; Olympus) with a spring constant of 0.1–0.3 N/m. The cantilever was oscillated at its resonant frequency (∼30 kHz in water). For scan sizes <500 nm, high-speed AFM imaging was carried out in the tapping mode, using our laboratory-built instrument (15) and small cantilevers (Olympus) with a spring constant of 0.1–0.2 N/m and a resonant frequency of 0.8–1.2 MHz in water, as described previously (25).
Results and Discussion
Surface homogeneity and topographies of streptavidin 2D crystals
The surface homogeneity and small roughness of streptavidin 2D crystals are important factors for easy identification by AFM of proteins immobilized on these surfaces. We examined these properties by imaging streptavidin 2D crystals by AFM. Fig. 1 shows low magnification AFM images of three types of streptavidin 2D crystals formed on mica-supported lipid bilayers. The crystals showed P2 space group symmetry with different vector axes (for the molecular arrangements, see Fig. 3), i.e., type-1 (Fig. 1 A), type-2 (Fig. 1 B), and type-3 (Fig. 1 C). Wide areas were covered by ordered crystalline lattices, suitable as substrates for AFM imaging of biological molecules. These crystals were stable over a period >12 h.
Figure 1.
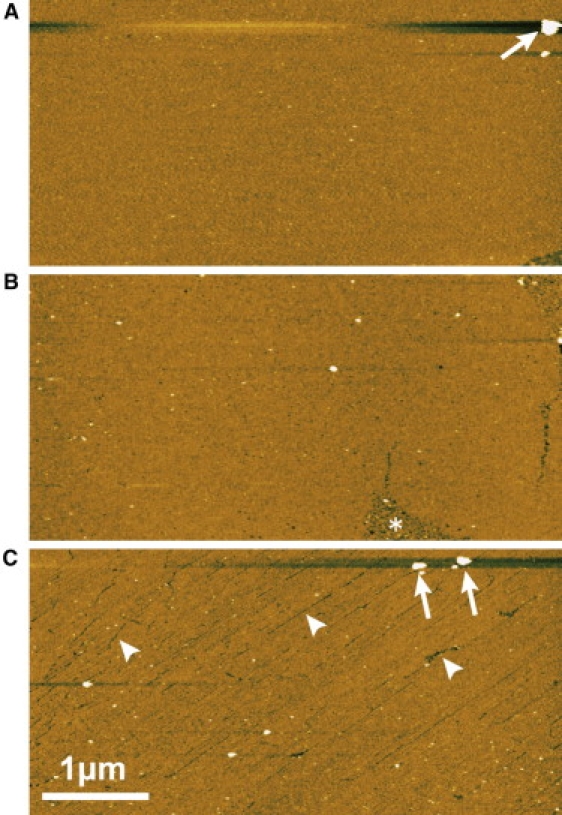
Low magnification AFM images of streptavidin 2D crystals formed on mica-supported lipid bilayer. The space group symmetries of the crystals are (A) type-1 P2, (B) type-2 P2, and (C) type-3 P2. The arrows indicate large particles found on the streptavidin 2D crystals. The asterisk in panel B indicates a noncrystallized region. The arrowheads in panel C indicate cracks found on the type-3 P2 crystal. These AFM images were obtained at a scan rate of 1 s/line (512 pixels). Z scale: 5 nm.
Figure 3.
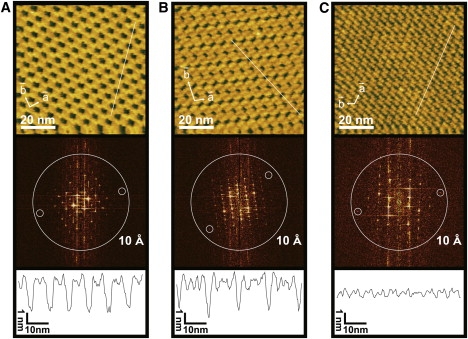
High magnification surface topographies of the streptavidin 2D crystals formed on mica-supported lipid bilayer. The space group symmetries of the crystals are (A) type-1 P2, (B) type-2 P2, and (C) type-3 P2. (Top) AFM images of the streptavidin 2D crystals. These AFM images were obtained at an imaging rate of 1 s/frame with 256 × 256 pixels. (Middle) Calculated diffraction patterns from the AFM images shown in the top panels. The large circles indicate the position of 1 nm−1. The small circles surround diffraction spots with the apparent highest resolution detected. In the reciprocal lattice, the diffraction spots can be discerned up to (5, −1) for the type-1 P2, (4, 4) for the type-2 P2, and (3, −4) for the type-3 P2, corresponding to the apparent resolutions of 1.14, 1.19, and 1.17 nm, respectively. Note that these values do not necessarily represent the spatial resolution of the images because of an effect of tip-contouring (32). (Bottom) Cross sections of the surface profiles along the lines indicated in the AFM images in the top panels.
Although not significant obstacles to practical use, the surface of the type-3 P2 crystal contained a number of line defects and cracks (Fig. 1 C, arrowheads), due to a relatively smaller size of crystalline domains. In the type-1 and type-2 P2 crystals, the surfaces were continuous and smooth over a wide area (>1 μm2), except for a small number of defects such as 1), large particles (Fig. 1, A and C, arrows); and 2), noncrystallized region (Fig. 1 B, asterisk). These imperfections of the crystals are likely to be induced by the instability of lipid bilayers underneath the streptavidin crystals or by not fully optimized crystallization conditions.
AFM images at medium magnification revealed more-detailed surface structures (Fig. 2). The type-1 P2 crystal (Fig. 2 A) and the type-2 P2 crystal (Fig. 2 B) showed a significantly low density of vacancy defects. In contrast, a significant defects such as point (Fig. 2 C, arrowheads) and line defects (Fig. 2 C, outlined with dashed lines) were observed in the type-3 P2 crystal. However, these lattice defects cannot be severe obstacles to AFM imaging of proteins immobilized on such surfaces. Proteins immobilized onto crystalline areas always protrude from the crystal surface, whereas the vacancies and line defects can be seen as depressions. Therefore, the proteins attached to the crystal surface are easily identified. Note that, as mentioned later, proteins do not attach to the cracks, because the exposed surfaces are those of lipid bilayers.
Figure 2.
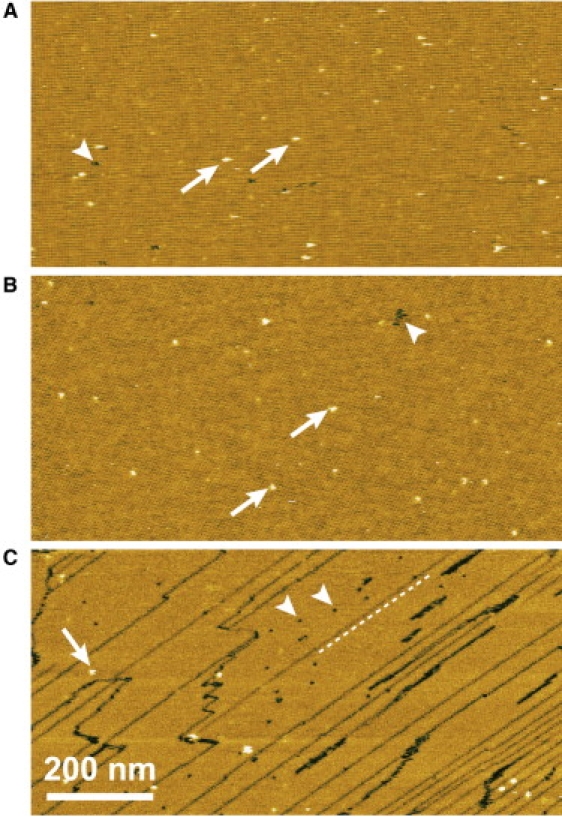
Medium magnification AFM images of streptavidin 2D crystals formed on mica-supported lipid bilayer. The space group symmetries of the crystals are (A) type-1 P2, (B) type-2 P2, and (C) type-3 P2. The arrowheads indicate vacancies. The dashed line in panel C outlines a line defect. The arrows indicate small particles. These AFM images were obtained at a scan rate of 1 s/line (512 pixels). Z scale: 3.5 nm.
Another type of defect is small particles (Fig. 2, arrows). The height of these particles was 3.3 ± 1.3 nm, which is comparable to diameters of many proteins. The similar dimensions might be an obstacle to identifying immobilized proteins by AFM. However, the density of small particles is sufficiently low (1–2 particles per 200 × 200 nm2) to allow AFM imaging of immobilized proteins on the surfaces. The origin of the small particles is uncertain. One possibility could be misalignments of streptavidin in the crystalline arrays.
The molecular arrangements of streptavidin in the different 2D crystals are clearly identified in the high magnification AFM images (Fig. 3, top). The lattice constants obtained from the images are a = 5.8 ± 0.1 nm, b = 5.8 ± 0.2 nm, and γ = 89 ± 1° for the type-1 P2 crystal (Fig. 3 A); a = 5.8 ± 0.1 nm, b = 11.3 ± 0.1 nm, and γ = 102 ± 3° for the type-2 P2 crystal (Fig. 3 B); and a = 5.5 ± 0.1 nm, b = 4.6 ± 0.1 nm, and γ = 110 ± 2° for the type-3 P2 crystal (Fig. 3 C). These values well agree with those obtained in previous studies (18,30,31), when the unit cells are consistently selected. The Fourier transformation of the AFM images showed characteristic diffraction patterns for respective streptavidin 2D crystals (Fig. 3, middle). The maximum diffraction spots ranging 0.83–0.9 nm−1 were obtained for all three types of streptavidin 2D crystals, although they do not necessarily represent the spatial resolution of the images (32).
The small roughness of the crystal surfaces is an important factor when they are served as substrate surfaces for AFM imaging. The cross-sectional views of the 2D crystals (Fig. 3, bottom) indicate that the smallest roughness is obtained in the type-3 P2 crystal. The surface corrugation amplitude of the type-3 P2 crystal was <1 nm, whereas it was 2–3 nm in the other two crystals. The surface roughness measurements are summarized in Fig. 4. For each crystal surface, the root mean-square (RMS) roughness was calculated using corresponding AFM images from which maximum diffraction spots better than 0.67 nm−1 were obtained. For a comparison, the values of RMS roughness of glass and mica surfaces are also given in Fig. 4. The values of RMS roughness of the type-1 and type-2 P2 crystals were comparable to that of bare glass surfaces, while the surface roughness of the type-3 P2 crystal was only slightly larger than that measured for atomically flat mica.
Figure 4.
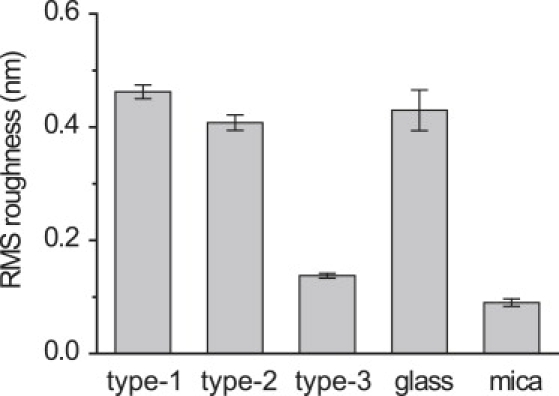
RMS surfaces roughness of glass, mica, and streptavidin 2D crystals (type-1, type-2, and type-3) formed on mica-supported lipid bilayer. The data were obtained from several high magnification AFM images (scanning area of 75 × 75 nm2) of respective surfaces. The error bars are SD.
High-speed AFM imaging of the crystals also showed a different aspect of the crystals. As found by our previous study with the type-1 P2 crystal (25), the diffusion of vacancy defects were also observed in the type-2 P2 crystal. In contrast, the vacancies in the type-3 P2 crystal did not diffuse, indicating that the intermolecular interactions of streptavidin are considerably stronger in the type-3 P2 crystal than those in the other two crystals. In fact, the type-3 P2 crystal was highly resistant to an increased tapping force exerted by an oscillating tip. Although the type-1 and type-2 P2 crystals are somewhat fragile, we can treat them by glutaraldehyde when higher mechanical strength is required. After the treatment, the crystal surfaces still retain sufficiently strong affinity for biotinylated proteins.
Resistance to nonspecific protein adsorption of streptavidin 2D crystals
Resistance of substrate surfaces to nonspecific binding of proteins is important for the immobilized proteins to retain their native activities and also for selectively attaching a specific protein contained in a multicomponent sample. Using TIRFM, we examined this issue by measuring nonspecific adsorption of fluorescently labeled CaM to the streptavidin 2D crystals. For the TIRFM measurements, we used coverslips as a substitute for mica.
First, we confirmed that streptavidin could be crystallized on glass-supported lipid bilayers using the same crystallization procedures used for mica. Fig. 5 A shows an AFM image of the type-1 P2 crystal formed on a glass-supported lipid bilayer. The type-2 and type-3 P2 crystals were also formed. The lattice constants of these crystals were consistent with that formed on mica-supported lipid bilayer. However, the surfaces of the crystals formed on glass-supported lipid bilayers showed a slight undulation, reflecting the rugged surface of the coverslip underneath the supported lipid bilayer. Next, TIRFM measurements were performed to examine nonspecific binding of proteins to the crystal surfaces. A 0.1 nM Cy3-CaM solution was applied to a flow cell, on the surface of which the type-1 P2 crystals were formed. After washing the flow cell with buffer-A solution, no fluorescent spots were observed (Fig. 5 B). When 100-times higher concentration of Cy3-CaM was added without being followed by washing, a low density of fluorescent spots was observed (Fig. 5 C). On the other hand, when 0.1 nM biotinylated Cy3-CaM was used, a significant density of fluorescent spots was observed (Fig. 5 D). Even when CaM was replaced with bovine serum albumin, we obtained similar results. Thus, the type-1 P2 crystal surface is resistant to nonspecific binding to proteins. In addition, the chemical fixation of the type-1 P2 crystal with glutaraldehyde had no effects on this resistance. Comparable results were also obtained for the type-2 and type-3 P2 crystals although densely packed fluorescent regions were frequently observed for these crystals. This nonspecific binding is likely due to the partial disruption of lipid bilayer on coverslips under the buffer conditions used for these types of crystals, since examinations by AFM imaging for the type-2 and type-3 P2 crystals formed on mica-supported lipid bilayers did not show such densely assembled regions of applied proteins (CaM, GroEL, GroES, and actin).
Figure 5.
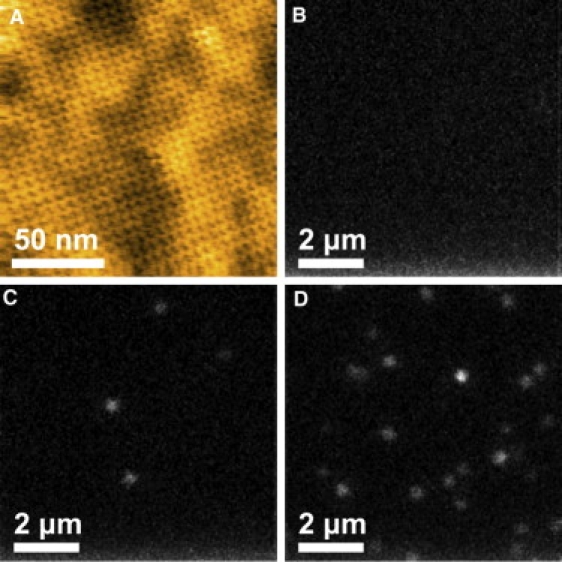
Specific and nonspecific adsorption of CaM to the type-1 P2 crystal of streptavidin formed on glass surface. (A) AFM image of the type-1 P2 crystal formed on a glass surface. The AFM image was obtained at an imaging rate of 1 s/frame with 256 × 256 pixels. Z scale: 3.3 nm. (B–D) TIRFM images of Cy3-CaM attached to the type-1 P2 crystal of streptavidin. (B) After incubating in the presence of 0.1 nM Cy3-CaM for 3 min, the flow cell was washed with buffer A. (C) The flow cell was incubated in the presence of 10 nM Cy3-CaM without being followed by washing-out free Cy3-CaM. (D) Specific binding of biotinylated Cy3-CaM after the incubation in the presence of 0.1 nM biotinylated Cy3-CaM for 3 min.
Ca2+-induced conformational change in CaM
As the type-3 P2 crystal shows the smallest roughness among the three types of crystals (Fig. 4), it is a suitable substrate when structural changes of relatively small proteins are imaged by AFM. Here, we used CaM (16.7 kDa) as a small protein to be visualized on the type-3 P2 crystal. CaM is a Ca2+ binding protein with the N-terminal and C-terminal globular domains connected by a central linker helix (33). Each globular domain contains two Ca2+ binding sites. CaM undergoes a conformational change upon Ca2+ binding (34,35).
Fig. 6 A shows successive AFM images captured at 1 s/frame of biotinylated CaM specifically bound to the type-3 P2 crystal in the absence of Ca2+. Rather than a pair of two globular domains as expected from earlier structural studies (33,34), the immobilized CaM was observed as single globes. This probably arises from lack of immobilization of either of the globular domains due to the low content of biotin (0.6 per molecule) and the intrinsic flexibility of the central linker helix. In fact, noise spikes frequently appeared around the globes, indicating rapidly moving moieties around the globes. The addition of Ca2+ to the sample changed the appearance of CaM, resulting in larger lateral dimensions and greater height (Fig. 6 B). The average height was increased from 1.9 ± 0.3 nm to 2.6 ± 0.4 nm (Fig. 6 D), while the average half-width was increased from 4.3 ± 1.0 nm to 5.9 ± 1.1 nm. This change in height and width was fully reversible in the same sample (Fig. 6 C), representing the conformational change of CaM.
Figure 6.
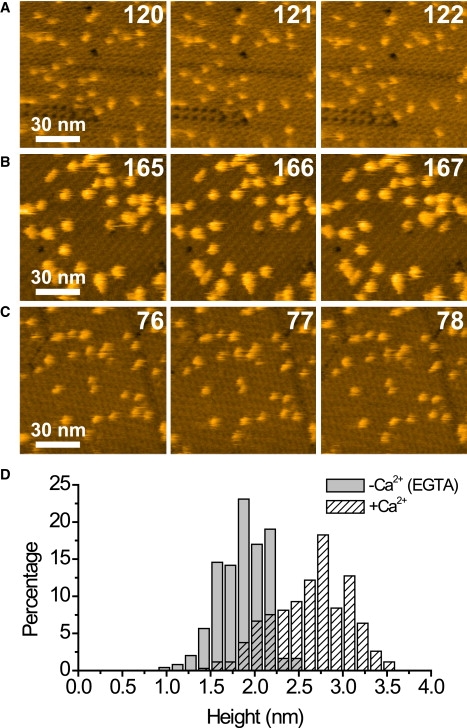
Biotinylated CaM immobilized on the type-3 P2 crystal of streptavidin. The successive AFM images were obtained in the absence (A and C) or presence (B) of Ca2+, at an imaging rate of 1 s/frame with 256 × 256 pixels. Z scale: 6 nm. The three sets of imaging for the same sample were performed in the alphabetical order. Before taking images of panels B and C, the buffer solution was replaced with 2 mM Ca2+-containing buffer-A and buffer-A alone, respectively. Numbers in the AFM images indicate frame numbers. (D) Histogram of the height of the immobilized CaM in the presence or absence of Ca2+.
Previous structural studies have indicated that the conformational change of CaM upon binding to Ca2+ at each globular domain is drastic (33,34). The binding of Ca2+ induces an opening of the two EF-hand motifs in each globular domain. As a result, the distances between two helices in each EF-hand substantially increase (2.5–6.2 Å) upon binding to Ca2+. The increase in the dimension of CaM observed in Fig. 6 B is close to the opening of the EF-hands in the immobilized globular domain. This result indicates that AFM measurements on the streptavidin crystal enable the detection of conformational change of the immobilized proteins in the z dimension at subnanometer precision.
Immobilization of GroEL with controlled orientation
Streptavidin 2D crystals will benefit AFM imaging studies, if the orientation of the immobilized proteins can be controlled. This control can be achieved by the introduction of more than two biotin molecules at specific sites of a protein. Here we immobilized GroEL on the type-1 P2 crystal surface in a side-on orientation. GroEL and GroES are chaperonin proteins that assist folding of other proteins in vivo and in vitro (36,37). GroEL is a cylindrical protein composed of two heptameric rings stacked back to back, each of which is comprised of seven identical ATPase subunits (38). During the ATPase cycle, GroES transiently binds to the ends of the double rings (39,40).
Previously, the association and dissociation between GroEL and GroES were directly observed by AFM (11,12). In these studies, GroEL was adsorbed onto a mica surface, in which the GroEL has a strong tendency to take an end-up orientation. In this orientation, only one GroEL ring is exposed to the aqueous buffer and accessible to GroES floating in the solution. To solve this problem, previous TIRFM studies introduced biotin to the Cys-490 residue located at the outer surface of the equatorial domain of the D490C GroEL mutant (41,42). The resulting biotinylated GroEL is expected to be anchored on a streptavidin layer in a side-on orientation, but no evidence for this side-on orientation of the anchored GroEL was ever provided from other studies.
Fig. 7 shows successive AFM images of the biotinylated GroEL mutant immobilized on the type-1 P2 crystal in the presence of GroES and ADP. Two species with different appearances were observed. One exhibited a rectangle shape (Fig. 7, arrowhead) (rather than a circular shape, as has been observed with GroEL on a mica surface), indicating GroEL alone in a side-on orientation, and the other exhibited a bullet shape (Fig. 7, arrow), indicating a 1:1 complex of GroEL and GroES (39). Interestingly, the protruded side of the bullet-shaped GroEL is switched (asterisks; compare the images in Fig. 7), indicating GroES release from one end of the two rings, which is followed by GroES binding to the other end. This behavior occurred reversibly in the GroEL molecule, although most GroEL molecules were rather stable and did not show such dynamic association/disassociation events during the imaging period. Note that GroES never bound to the streptavidin crystal surface even when its concentration was relatively high. As exemplified here, it is possible to immobilize proteins in a desired orientation by introducing multiple biotins to a protein at designed sites.
Figure 7.
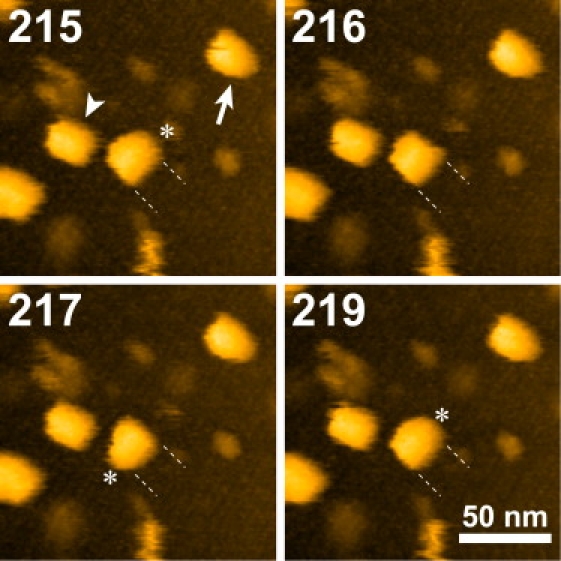
AFM images of GroEL alone and GroEL-GroES complex. The GroEL is D490C mutant, the Cys-490 residues of which are labeled with biotin, and is immobilized in a side-on orientation on the streptavidin type-1 P2 crystal that is chemically fixed with glutaraldehyde. The arrowhead indicates GroEL alone and the arrow indicates the GroEL-GroES complex. The dashed lines indicate the end positions of the GroEL. The asterisks indicate GroES bound to one of the GroEL rings. The AFM images were obtained at an imaging rate of 2 s/frame with 200 × 200 pixels. Z scale: 19 nm. Numbers in the AFM images indicate frame numbers.
Visualization of actin polymerization
Here, we further verified the applicability of the streptavidin 2D crystal surfaces to dynamic AFM imaging by directly observing actin polymerization on the type-2 P2 crystal surface. The polymerization of actin is a key process in a variety of cellular functions (43). To date, many studies have demonstrated that the polymerization of actin consists of nucleation and growth steps followed by dynamic equilibrium in the steady state. It is also well known that actin filaments have a structural polarity, so that the polymerization kinetics is different at the two ends of the filaments; the polymerization rate is higher at the barbed end than at the pointed end. Previous TIRFM imaging studies (44,45) on the polymerization dynamics with individual actin filaments have suggested a polymerization unit not to be composed of monomers alone but, instead, an average of monomers, oligomers, and fragments. However, analysis of precise molecular events occurring at the filament edges has been difficult due to the limited spatial resolution of optical microscopy. In contrast, high-speed AFM allows direct observation of the polymerization process at the molecular level, thanks to the high spatial resolution and subsecond temporal resolution.
Fig. 8 A shows AFM images captured at 0.25 s/frame for a polymerizing actin filament in the presence of nonbiotinylated G-actin (also see Movie S1 in the Supporting Material). Instead of finding actin filament ends, the ends were produced by breaking an actin filament (Fig. 8 A, 0 s) upon applying an increased tapping force (Fig. 8 A, 2.0–2.5 s). This procedure allowed simultaneous visualization of both barbed and pointed ends in the relatively small scan area. The actin filament showed stepwise elongation at one end (Fig. 8 A, arrows at 6.75 s–13.5 s, and Fig. 8 B), whereas at the other end, elongation was not observed in the imaging period. From this difference, the end on the left-hand is assigned to be the barbed end. The observed elongation rate at the barbed end was 0.11 μm/min, which is comparable to the values obtained previously (44,45). Interestingly, a stepwise decrease (3.5 ± 1.4 nm) in the length was occasionally observed (Fig. 8 B, arrows). An actin filament is composed of two filamentous actin strands organized into an apparent double helix. The actin subunits are spaced 5.5 nm apart along each helix. The two strands are axially staggered relative to each other by half the subunit repeat (i.e., 2.75 nm). Based on this structure, we can make a correlation between the observed elongation step lengths (Fig. 8 B: 3.1 ± 0.9 nm and 5.2 ± 1.1 nm) and the numbers of the molecules incorporated. The smaller step length is close to the half-length of an actin subunit, whereas the larger one agrees well with the size of an actin subunit. The former result indicates monomer binding to the end of one strand that is recessed relative to the end of the other strand. On the other hand, the latter result indicates dimer binding; the barbed end of each strand is bound by an actin subunit, so that the filament elongates by the size of an actin subunit. Therefore, both monomers and dimers are incorporated into the barbed end of actin filaments during the polymerization process.
Figure 8.
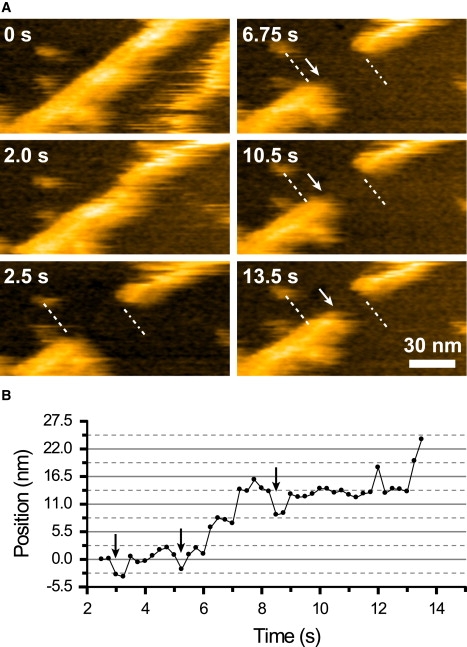
Polymerization process at actin filament ends observed by high-speed AFM. (A) High-speed AFM images of partially biotinylated actin filaments on the streptavidin type-2 P2 crystal that is chemically fixed with glutaraldehyde. The dashed lines and dot-dash lines indicate the initial positions of the barbed and pointed ends, respectively. The ends were produced by partially dissecting the filament by an oscillating cantilever tip. The arrows indicate the positions of the growing barbed end of the dissected actin filament. The successive images were obtained at an imaging rate of 0.25 s/frame with 256 × 128 pixels. Z scale: 11 nm. (B) Change with elapsed time in the barbed-end position along the longitudinal axis of the filament. The position was measured from the successive AFM images. The arrows indicate decrease in the length of the filament.
In a previous TIRFM study on actin polymerization, the polymerization unit was estimated to be six monomers on average (44). This value is significantly larger than that obtained in this study. One possible reason for this discrepancy may be attributed to the annealing of actin fragments, in which fragments associate to each other at their ends to form a longer filament. The annealing rate is comparable to the polymerization rate as reported previously (46). Therefore, annealing events will make the apparent polymerization unit larger. We did not observe the annealing process in this study. A further examination of actin polymerization by high-speed AFM will provide deeper insights into the actin polymerization process.
Conclusion
The characterization of the three types of streptavidin 2D crystals showed their appropriate properties as substrates to which proteins are immobilized for dynamic AFM imaging, i.e., uniformity over relatively wide areas, small roughness, and resistance to nonspecific binding to proteins. Among the three types of crystals, the type-3 P2 crystal seems the most appropriate choice for a wide range of biological samples because of the smallest roughness and the highest stability (glutaraldehyde treatment is unnecessary). Although type-3 P2 crystals often contain line cracks, they are also resistant to nonspecific binding to proteins because their surfaces are those of lipid bilayers. When the presence of line cracks is undesired in dynamic AFM imaging of a biological sample, we can use the type-1 or type-2 P2 crystals of which surfaces have high uniformity over a wide area. The stable immobilization of oligomerized proteins such as GroEL and actin filaments to the surfaces can be achieved easily by introducing multiple biotin molecules. The ability of the crystal surfaces to specifically bind to biotinylated proteins (or His-tag conjugated proteins) without nonspecific binding to proteins allows studying dynamic interaction processes between protein molecules, as demonstrated here in the observation of GroES-GroEL binding and actin polymerization.
Supporting Material
A movie is available at http://www.biophysj.org/biophysj/supplemental/S0006-3495(09)01309-5.
Supporting Material
Acknowledgments
This work was supported by the Core Research for Evolutional Science and Technology project and the project of Development of System and Technology for Advanced Measurement and Analysis (Japan Science and Technology Agency, Japan), and a Grant-in-Aid for Basic Research (S) (No. 20221006; Japan Society for the Promotion of Science, Japan).
References
- 1.Binnig G., Quate C.F., Gerber C. Atomic force microscope. Phys. Rev. Lett. 1986;56:930–933. doi: 10.1103/PhysRevLett.56.930. [DOI] [PubMed] [Google Scholar]
- 2.Mou J., Czajkowsky D.M., Sheng S., Ho R., Shao Z. High resolution surface structure of E. coli GroES oligomer by atomic force microscopy. FEBS Lett. 1996;381:161–164. doi: 10.1016/0014-5793(96)00112-3. [DOI] [PubMed] [Google Scholar]
- 3.Müller D.J., Sass H.J., Müller S.A., Büldt G., Engel A. Surface structures of native bacteriorhodopsin depend on the molecular packing arrangement in the membrane. J. Mol. Biol. 1999;285:1903–1909. doi: 10.1006/jmbi.1998.2441. [DOI] [PubMed] [Google Scholar]
- 4.Scheuring S., Seguin J., Marco S., Lévy D., Robert B. Nanodissection and high-resolution imaging of the Rhodopseudomonas viridis photosynthetic core complex in native membranes by AFM. Proc. Natl. Acad. Sci. USA. 2003;100:1690–1693. doi: 10.1073/pnas.0437992100. [DOI] [PMC free article] [PubMed] [Google Scholar]
- 5.Lyubchenko Y., Shlyakhtenko L., Harrington R., Oden P., Lindsay S. Atomic force microscopy of long DNA: imaging in air and under water. Proc. Natl. Acad. Sci. USA. 1993;90:2137–2140. doi: 10.1073/pnas.90.6.2137. [DOI] [PMC free article] [PubMed] [Google Scholar]
- 6.Thomson N.H., Smith B.L., Almqvist N., Schmitt L., Kashlev M. Oriented, active Escherichia coli RNA polymerase: an atomic force microscope study. Biophys. J. 1999;76:1024–1033. doi: 10.1016/S0006-3495(99)77267-X. [DOI] [PMC free article] [PubMed] [Google Scholar]
- 7.El Kirat K., Burton I., Dupres V., Dufrene Y.F. Sample preparation procedures for biological atomic force microscopy. J. Microsc. 2005;218:199–207. doi: 10.1111/j.1365-2818.2005.01480.x. [DOI] [PubMed] [Google Scholar]
- 8.Karrasch S., Dolder M., Schabert F., Ramsden J., Engel A. Covalent binding of biological samples to solid supports for scanning probe microscopy in buffer solution. Biophys. J. 1993;65:2437–2446. doi: 10.1016/S0006-3495(93)81327-4. [DOI] [PMC free article] [PubMed] [Google Scholar]
- 9.Wagner P., Hegner M., Kernen P., Zaugg F., Semenza G. Covalent immobilization of native biomolecules onto Au111 via N-hydroxysuccinimide ester functionalized self-assembled monolayers for scanning probe microscopy. Biophys. J. 1996;70:2052–2066. doi: 10.1016/S0006-3495(96)79810-7. [DOI] [PMC free article] [PubMed] [Google Scholar]
- 10.Kasas S., Thomson N.H., Smith B.L., Hansma H.G., Zhu X. Escherichia coli RNA polymerase activity observed using atomic force microscopy. Biochemistry. 1997;36:461–468. doi: 10.1021/bi9624402. [DOI] [PubMed] [Google Scholar]
- 11.Viani M.B., Pietrasanta L.I., Thompson J.B., Chand A., Gebeshuber I.C. Probing protein-protein interactions in real time. Nat. Struct. Biol. 2000;7:644–647. doi: 10.1038/77936. [DOI] [PubMed] [Google Scholar]
- 12.Yokokawa M., Wada C., Ando T., Sakai N., Yagi A. Fast-scanning atomic force microscopy reveals the ATP/ADP-dependent conformational changes of GroEL. EMBO J. 2006;25:4567–4576. doi: 10.1038/sj.emboj.7601326. [DOI] [PMC free article] [PubMed] [Google Scholar]
- 13.Müller D.J., Engel A. Voltage and pH-induced channel closure of porin OmpF visualized by atomic force microscopy. J. Mol. Biol. 1999;285:1347–1351. doi: 10.1006/jmbi.1998.2359. [DOI] [PubMed] [Google Scholar]
- 14.Ando T., Kodera N., Takai E., Maruyama D., Saito K. A high-speed atomic force microscope for studying biological macromolecules. Proc. Natl. Acad. Sci. USA. 2001;98:12468–12472. doi: 10.1073/pnas.211400898. [DOI] [PMC free article] [PubMed] [Google Scholar]
- 15.Ando T., Uchihashi T., Fukuma T. High-speed atomic force microscopy for nano-visualization of dynamic biomolecular processes. Prog. Surf. Sci. 2008;83:337–437. [Google Scholar]
- 16.Scheuring S., Müller D.J., Ringler P., Heymann J.B., Engel A. Imaging streptavidin 2D crystals on biotinylated lipid monolayers at high resolution with the atomic force microscope. J. Microsc. 1999;193:28–35. doi: 10.1046/j.1365-2818.1999.00434.x. [DOI] [PubMed] [Google Scholar]
- 17.Blankenburg R., Meller P., Ringsdorf H., Salesse C. Interaction between biotin lipids and streptavidin in monolayers: formation of oriented two-dimensional protein domains induced by surface recognition. Biochemistry. 1989;28:8214–8221. doi: 10.1021/bi00446a037. [DOI] [PubMed] [Google Scholar]
- 18.Darst S.A., Ahlers M., Meller P.H., Kubalek E.W., Blankenburg R. Two-dimensional crystals of streptavidin on biotinylated lipid layers and their interactions with biotinylated macromolecules. Biophys. J. 1991;59:387–396. doi: 10.1016/S0006-3495(91)82232-9. [DOI] [PMC free article] [PubMed] [Google Scholar]
- 19.Calvert T.L., Leckband D. Two-dimensional protein crystallization at solid-liquid interfaces. Langmuir. 1997;13:6737–6745. [Google Scholar]
- 20.Reviakine I., Brisson A. Streptavidin 2D crystals on supported phospholipid bilayers: toward constructing anchored phospholipid bilayers. Langmuir. 2001;17:8293–8299. [Google Scholar]
- 21.Green N.M. Avidin and streptavidin. Methods Enzymol. 1990;184:51–67. doi: 10.1016/0076-6879(90)84259-j. [DOI] [PubMed] [Google Scholar]
- 22.Heyes C.D., Kobitski A.Y., Amirgoulova E.V., Nienhaus G.U. Biocompatible surfaces for specific tethering of individual protein molecules. J. Phys. Chem. B. 2004;108:13387–13394. [Google Scholar]
- 23.Wang S.W., Robertson C.R., Gast A.P. Molecular arrangement in two-dimensional streptavidin crystals. Langmuir. 1999;15:1541–1548. [Google Scholar]
- 24.Ratanabanangkoon P., Gast A.P. Effect of ionic strength on two-dimensional streptavidin crystallization. Langmuir. 2003;19:1794–1801. [Google Scholar]
- 25.Yamamoto D., Uchihashi T., Kodera N., Ando T. Anisotropic diffusion of point defects in a two-dimensional crystal of streptavidin observed by high-speed atomic force microscopy. Nanotechnology. 2008;19:384009-1–384009-9. doi: 10.1088/0957-4484/19/38/384009. [DOI] [PubMed] [Google Scholar]
- 26.Koide H., Kinoshita T., Tanaka Y., Tanaka S., Nagura N. Identification of the single specific IQ motif of myosin V from which calmodulin dissociates in the presence of Ca2+ Biochemistry. 2006;45:11598–11604. doi: 10.1021/bi0613877. [DOI] [PubMed] [Google Scholar]
- 27.Kunioka Y., Ando T. Innocuous labeling of the subfragment-2 region of skeletal muscle heavy meromyosin with a fluorescent polyacrylamide nanobead and visualization of individual heavy meromyosin molecules. J. Biochem. 1996;119:1024–1032. doi: 10.1093/oxfordjournals.jbchem.a021343. [DOI] [PubMed] [Google Scholar]
- 28.Taniguchi M., Yoshimi T., Hongo K., Mizobata T., Kawata Y. Stopped-flow fluorescence analysis of the conformational changes in the GroEL apical domain: relationships between movements in the apical domain and the quaternary structure of GroEL. J. Biol. Chem. 2004;279:16368–16376. doi: 10.1074/jbc.M311806200. [DOI] [PubMed] [Google Scholar]
- 29.Sakamoto T., Amitani I., Yokota E., Ando T. Direct observation of processive movement by individual myosin V molecules. Biochem. Biophys. Res. Commun. 2000;272:586–590. doi: 10.1006/bbrc.2000.2819. [DOI] [PubMed] [Google Scholar]
- 30.Wang S.W., Poglitsch C.L., Yatcilla M.T., Robertson C.R., Gast A.P. Solid phase coexistence in chiral domains of two-dimensional streptavidin crystals. Langmuir. 1997;13:5794–5798. [Google Scholar]
- 31.Hemming S.A., Bochkarev A., Darst S.A., Kornberg R.D., Ala P. The mechanism of protein crystal growth from lipid layers. J. Mol. Biol. 1995;246:308–316. doi: 10.1006/jmbi.1994.0086. [DOI] [PubMed] [Google Scholar]
- 32.Fechner P., Boudier T., Mangenot S., Jaroslawski S., Sturgis J.N. Structural information, resolution, and noise in high-resolution atomic force microscopy topographs. Biophys. J. 2009;96:3822–3831. doi: 10.1016/j.bpj.2009.02.011. [DOI] [PMC free article] [PubMed] [Google Scholar]
- 33.Babu Y.S., Bugg C.E., Cook W.J. Structure of calmodulin refined at 2.2 Å resolution. J. Mol. Biol. 1988;204:191–204. doi: 10.1016/0022-2836(88)90608-0. [DOI] [PubMed] [Google Scholar]
- 34.Zhang M., Tanaka T., Ikura M. Calcium-induced conformational transition revealed by the solution structure of apo calmodulin. Nat. Struct. Biol. 1995;2:758–767. doi: 10.1038/nsb0995-758. [DOI] [PubMed] [Google Scholar]
- 35.Ikura M. Calcium binding and conformational response in EF-hand proteins. Trends Biochem. Sci. 1996;21:14–17. [PubMed] [Google Scholar]
- 36.Bukau B., Horwich A.L. The Hsp70 and Hsp60 chaperone machines. Cell. 1998;92:351–366. doi: 10.1016/s0092-8674(00)80928-9. [DOI] [PubMed] [Google Scholar]
- 37.Hartl F.U., Hayer-Hartl M. Molecular chaperones in the cytosol: from nascent chain to folded protein. Science. 2002;295:1852–1858. doi: 10.1126/science.1068408. [DOI] [PubMed] [Google Scholar]
- 38.Braig K., Otwinowski Z., Hegde R., Boisvert D.C., Joachimiak A. The crystal structure of the bacterial chaperonin GroEL at 2.8 Å. Nature. 1994;31:578–586. doi: 10.1038/371578a0. [DOI] [PubMed] [Google Scholar]
- 39.Xu Z., Horwich A.L., Sigler P.B. The crystal structure of the asymmetric GroEL-GroES-(ADP)7 chaperonin complex. Nature. 1997;388:741–750. doi: 10.1038/41944. [DOI] [PubMed] [Google Scholar]
- 40.Horwich A.L., Fenton W.A., Chapman E., Farr G.W. Two families of chaperonin: physiology and mechanism. Annu. Rev. Cell Dev. Biol. 2007;23:115–145. doi: 10.1146/annurev.cellbio.23.090506.123555. [DOI] [PubMed] [Google Scholar]
- 41.Taguchi H., Ueno T., Tadakuma H., Yoshida M., Funatsu T. Single-molecule observation of protein-protein interactions in the chaperonin system. Nat. Biotechnol. 2001;19:861–865. doi: 10.1038/nbt0901-861. [DOI] [PubMed] [Google Scholar]
- 42.Ueno T., Taguchi H., Tadakuma H., Yoshida M., Funatsu T. GroEL mediates protein folding with a two successive timer mechanism. Mol. Cell. 2004;14:423–434. doi: 10.1016/s1097-2765(04)00261-8. [DOI] [PubMed] [Google Scholar]
- 43.Pollard T.D., Borisy G.G. Cellular motility driven by assembly and disassembly of actin filaments. Cell. 2003;112:453–465. doi: 10.1016/s0092-8674(03)00120-x. [DOI] [PubMed] [Google Scholar]
- 44.Fujiwara I., Takahashi S., Tadakuma H., Funatsu T., Ishiwata S. Microscopic analysis of polymerization dynamics with individual actin filaments. Nat. Cell Biol. 2002;4:666–673. doi: 10.1038/ncb841. [DOI] [PubMed] [Google Scholar]
- 45.Kuhn J.R., Pollard T.D. Real-time measurements of actin filament polymerization by total internal reflection fluorescence microscopy. Biophys. J. 2005;88:1387–1402. doi: 10.1529/biophysj.104.047399. [DOI] [PMC free article] [PubMed] [Google Scholar]
- 46.Murphy D.B., Gray R.O., Grasser W.A., Pollard T.D. Direct demonstration of actin filament annealing in vitro. J. Cell Biol. 1988;106:1947–1954. doi: 10.1083/jcb.106.6.1947. [DOI] [PMC free article] [PubMed] [Google Scholar]
Associated Data
This section collects any data citations, data availability statements, or supplementary materials included in this article.