

Abstract
This study shows that environmental confinement strongly affects the activation of nonlinear reaction networks, such as blood coagulation (clotting), by small quantities of activators. Blood coagulation is sensitive to the local concentration of soluble activators, initiating only when the activators surpass a threshold concentration, and therefore is regulated by mass transport phenomena such as flow and diffusion. Here, diffusion was limited by decreasing the size of microfluidic chambers, and it was found that microparticles carrying either the classical stimulus, tissue factor, or a bacterial stimulus, Bacillus cereus, initiated coagulation of human platelet-poor plasma only when confined. A simple analytical argument and numerical model were used to describe the mechanism for this phenomenon: confinement causes diffusible activators to accumulate locally and surpass the threshold concentration. To interpret the results, a dimensionless confinement number, Cn, was used to describe whether a stimulus was confined, and a Damköhler number, Da2, was used to describe whether a subthreshold stimulus could initiate coagulation. In the context of initiation of coagulation by bacteria, this mechanism can be thought of as “diffusion acting”, which is distinct from “diffusion sensing”. The ability of confinement and diffusion acting to change the outcome of coagulation suggests that confinement should also regulate other biological “on” and “off” processes that are controlled by thresholds.
Introduction
This work demonstrates that the reactivity of a nonlinear complex biological system, blood coagulation, can be regulated in the absence of convection by confining the diffusion of active factors. Confinement has been considered in many contexts, including chemical synthesis (1,2), enzymatic reactions (3), restricted diffusion through complex media (4,5), protein folding (6), cell culturing (7,8), cell motion (9), and quorum sensing (10–14). Here, we investigate the hypothesis that environmental confinement of a subthreshold patch can cause activated factors to accumulate locally above a threshold value and initiate a threshold-limited process (Fig. 1), whereas for a subthreshold patch in an unconfined condition, no response is generated.
Figure 1.

Confinement of activator-producing stimuli turns on initiation of blood coagulation. The schematic drawing shows that confinement locally concentrates activators (pink) released by a stimulus (red). In the more confined channel, the local concentration of activators is above a threshold concentration, so the signal is amplified and the system presents a response (blue). In the less-confined large channel, diffusion outcompetes accumulation of activators, and no response is generated.
We utilized the reaction network of coagulation (blood clotting) to test the effect of confinement because initiation of coagulation shows a number of spatial effects, such as sensitivity to size and shape of an initiating surface patch (15–17) and sensitivity to diffusion and flow (18–22) of blood near the patch. These effects are expected based on the nonlinearity of the network—specifically, the threshold that regulates initiation of coagulation (23,24). One example of such a spatial effect is the recent discovery that coagulation can be initiated by several species of bacteria in the Bacillus genus via a “quorum acting” mechanism (16). The quorum acting mechanism is parallel to quorum sensing but without a change in bacterial gene expression (16).
We hypothesized that bacteria also could initiate coagulation by a second mechanism that we refer to as “diffusion acting”, which is parallel to diffusion sensing. Bacteria use diffusion sensing to detect conditions in the environment of limited mass transfer of secreted signaling molecules suitable for the onset of gene expression (11). In diffusion acting, a sufficiently limited mass transfer of active factors, such as those produced by bacteria, leads directly to coagulation without requiring a change in gene expression. Confinement (i.e., enclosing the source of diffusing molecules within a boundary that these molecules cannot cross) is a simple way to limit mass transfer. Diffusion acting by bacteria is a specific example of the more general effect of environmental confinement on nonlinear systems with threshold kinetics.
First, we tested in general whether confinement could affect the outcome of coagulation, by using microfluidics to confine microparticles carrying a classical stimulus, tissue factor (TF). Next, we specifically tested whether diffusion acting could affect the outcome of coagulation, by using microfluidics to confine gel microdroplets (GMDs) containing bacteria. In both cases, stimuli in a confined environment induced coagulation in human plasma, whereas no response was observed in an unconfined condition. We present a simple analytical model based on attaining a threshold concentration of activator to describe this effect. This model uses a dimensionless confinement number, Cn, to describe whether a stimulus is confined, and a Damköhler number, Da2, to describe whether a subthreshold stimulus can initiate coagulation. We tested the model by using numerical simulations of blood coagulation to assess the outcome and timescale of coagulation over a subthreshold stimulus in confined environments.
Materials and Methods
Details about the materials and methods used in this study can be found in the Supporting Material.
Results
Confinement regulates initiation of coagulation by TF-carrying beads
First, we tested whether confinement of activators produced by a well-understood trigger of coagulation, TF (25,26), could initiate clotting of human normal pooled plasma (Fig. 2). Corn trypsin inhibitor was added to the platelet poor plasma to inhibit the factor XII pathway of coagulation. TF-coated magnetic silica microparticles (“TF-carrying beads”) were loaded into a microfluidic system containing channels of different sizes (Fig. 2 A), and then plasma was loaded. In the absence of flow, initiation of coagulation was monitored by using a fluorogenic substrate for thrombin (15) (see Materials and Methods in the Supporting Material) and confirmed by using bright-field illumination to observe formation of fibrin under a confocal microscope.
Figure 2.
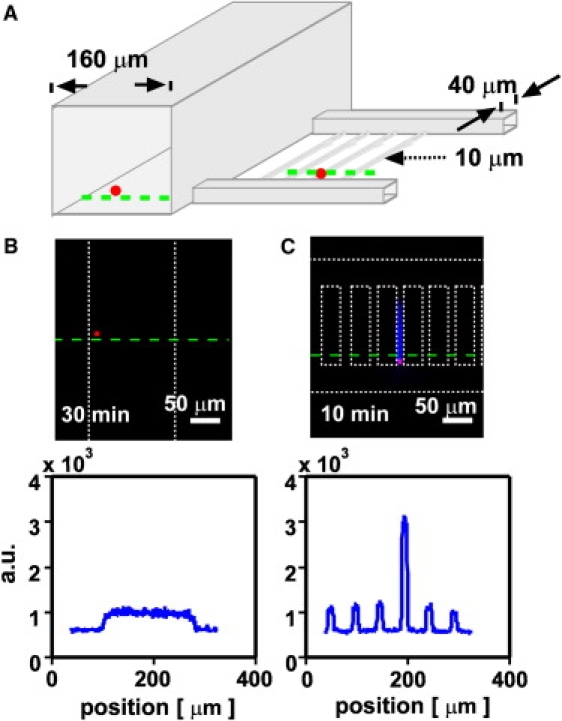
Initiation of blood coagulation by TF-carrying beads is regulated by environmental confinement. (A) A schematic drawing shows the geometry of the experimental device containing channels of different sizes (cross sections of 160 × 160 μm2, 40 × 40 μm2, and 10 × 10 μm2) and TF-carrying beads (red). (B and C) Initiation of coagulation by TF-carrying beads (red fluorescence) was monitored with the use of a fluorogenic substrate for thrombin. White dotted lines indicate channel walls of the microfluidic device. (B) A representative TF-carrying bead did not initiate coagulation in a less-confining channel (160 × 160 μm2). (C) A representative TF-carrying bead did initiate coagulation (blue) in a more-confining channel (10 × 10 μm2). Linescans of fluorescent intensity along the green dashed line are given below the images.
We found that small TF-carrying beads did not initiate clotting of human normal pooled plasma for >40 min when they were in a less confining space (160 × 160 μm2 channels; Fig. 2 B), even when the beads were located close to a wall. However, equal-sized or even slightly smaller TF-carrying beads initiated clotting in <10 min when trapped in a tightly confining space (10 × 10 μm2 channels, N = 5 beads in two separate experiments, p < 0.001; Fig. 2 C and Fig. S1). This result indicates that TF-carrying beads smaller than threshold size did not initiate coagulation in a less confined environment, but did initiate coagulation when they were highly confined in a space with limited diffusion.
Coagulation of human plasma is a complex process that has been shown to exhibit a threshold response (on and off) to the concentration of soluble active coagulation factors such as thrombin (24). We hypothesized that the observed response to confinement was due to accumulation of soluble active factors, but it was possible that unknown interactions between the plasma and the device also played a role. To exclude this possibility, we tested whether the response to confinement could be predicted by a numerical simulation of TF-initiated blood clotting, using a set of 40 rate equations describing enzyme kinetics and stoichiometric inhibition in blood coagulation without surface interactions (16,27,28) (see Materials and Methods in the Supporting Material). We used a simulation with geometry similar to that of the experimental microfluidic device and simulated the response of plasma to small regions, or patches, of 1 nM TF in either 10 μm or 160 μm wide channels (Fig. 3). This simulation was conducted in two-dimensional (2D) space to reduce computational demands. The clot time was defined as the time at which fibrin reached half of its maximum concentration (i.e., at 4.15 μM fibrin). As predicted, patches of TF initiated the coagulation network quickly (∼8 min) in confining channels, but not in the less confining channels (>60 min; see Supporting Material). This finding agrees with the experimental results (Fig. 2) and confirms that coagulation kinetics and spatial constraints alone are sufficient to achieve the confinement effect.
Figure 3.
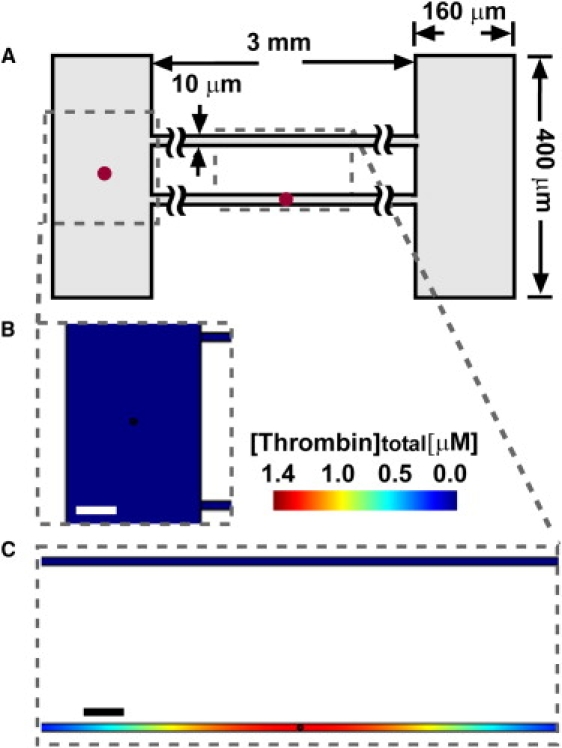
In 2D simulations of subthreshold patches of TF (1 nM; radius r = 3 μm) placed in either confining or less-confining channels of plasma, clotting initiated only in the confined space. (A) A schematic drawing shows the device design. (B and C) Plots show [thrombin]total, the sum of [thrombin] and [meizothrombin], including both free and bound species, at t = 10 min. (B) In the less-confining (160 μm) channel, no coagulation was initiated at 10 min, and [thrombin]total remained at a low level (blue). (C) In confining space (10 μm) containing a patch, clotting was initiated and [thrombin]total increased to a high concentration (red). No clotting was initiated in the top channel (blue), which did not contain a patch of TF. Scale bars = 50 μm. The red dots in the schematic indicate patches of TF, and they are not drawn to scale.
A simple analytical model describes the response of initiation of coagulation to confinement of activators in numerical simulations
To understand the role of confinement, we considered the competition between production and diffusion of coagulation factors over a TF-carrying bead. In a previous study (15) using patches of TF patterned on an inert surface, we showed that for all patches above a critical size, Pcrit ∼ (D × TR)0.5, the rate of production exceeds the rate of diffusion, and clotting occurs because coagulation factors accumulate above a threshold concentration, Ccrit [mol/L]. Here, D [m2/s] is the diffusion coefficient of the active factor (such as thrombin), and TR [s] is the observed clot time of blood over a uniform surface of TF. Competition between production by reaction and removal by diffusion or flow is described by the dimensionless Damköhler number, Da = τremove / τrxn. τrxn is the timescale [s] of reaction in a uniform system, and for blood clotting it is given by CT [s], the observed clot time in a uniform system containing a stimulus such as TF. CT decreases as the concentration of stimulus increases. τremove is the timescale of removal of activator from the patch, which is obtained by adding in parallel the timescales of diffusion from the center to the edge of the patch, τdiff = (l/2)2/2nfD, and convection past the patch, τconv. Here, l [m] is the length of the patch or bead (“patch size”); and nf is the number of dimensions in which diffusion occurs freely, i.e., without running into a wall. Clotting occurs when the reaction is faster than the removal, i.e., when Da > 1. We define the specific case of the Damköhler number, Da1, for an unconfined patch as follows:
For a patch of TF on a surface, as the patch size increases past Pcrit, the observed clot time converges quickly to TR (15), which may be slightly greater than CT due to diffusive loss of activator upward and away from the surface. The exact form of τconv depends on the geometry and characteristics of the system, but τconv describes the residence time of the activator over the patch and thus increases with l. For example, for activators distributed throughout the solution, τconv ∼ l/U, where U [m/s] is the average rate of fluid flow through the channel. For activators emanating from the surface of a large channel (diameter > 100 μm), a more appropriate description may be τconv ∼ l/kc, where kc [m/s] is the local mass transfer coefficient in a thin reactive boundary layer atop the surface and depends on the shear rate at the wall (18,19,23). In this study, all experiments and most simulations were conducted without flow (U = 0) to focus on the simplest case of the Damköhler number. The potential effects of convective flow are considered in the Discussion.
For patches below the critical size (“subthreshold” patches), clotting does not occur in unconfined systems because diffusion rapidly removes the activated factors (Da1 < 1). However, in a confined volume, the factors may accumulate quickly without being inhibited and eventually reach the threshold concentration (Fig. 1). Because plasma definitely clots if the average concentration of activator throughout its volume is greater than Ccrit (24), the clot time, tclot [s], was defined as the time required for the average concentration of activator (thrombin) to reach Ccrit. We treated a patch or bead containing a stimulus as a continuous and constant source of activator in a chamber of finite volume Vc [m3]. For example, we assumed that TF serves as a continuous source of factor Xa (29), and that bacteria serve as a continuous source of factors Xa and thrombin (factor IIa) (16). The patch, or bead, contains the stimulus (TF) and produces activator in a volume Vp [m3], where Vc > Vp, at a constant net rate, 1/CT. We assumed that all activators are diffusible and do not bind to surfaces. The potential effects of surface binding are considered in the Discussion. The amount of activator required to reach the threshold concentration in the chamber was divided by its net rate of production by the patch to obtain tclot for the confined patch:
| (1) |
More information about this equation and its derivation are included in the Supporting Material. In the special case of radially symmetric chambers and patches with radii R and r, respectively, the volume ratio Vc/Vp can be simplified to the ratio (R/r)3 for spheres, or (R/r)2 for long cylinders and 2D circles. The simple expression in Eq. 1 reveals that for subthreshold patches in confining chambers, the activator created by the patch is essentially diluted by a factor of Vc/Vp, which slows accumulation toward the critical concentration.
To test whether Eq. 1 holds for blood coagulation, we used the numerical simulation for coagulation described above to examine the relationship between tclot, the volume ratio Vc/Vp, and CT in quasi-3D space. A spherical patch of TF, with radius r, was centered inside a spherical chamber of plasma, with radius R (Fig. 4). We systematically varied each term in Eq. 1 (see Materials and Methods) and measured the clot time tclot for each simulation (Table S1). tclot was defined as the time when the average concentration of thrombin reached Ccrit. For this numerical model, Ccrit = 10.6 nM thrombin (see Materials and Methods). The results of the simulations were plotted as the ratio tclot/CT, which scaled linearly with the volume ratio R3/r3 in the tested range, as predicted by the equation (Fig. 4). A single point did not fall on the scaling line for the quasi-3D simulation; this point had the lowest tested concentration of TF (5 pM; see Discussion). This experiment was also conducted in a 2D space (circular patch in circular chamber) and it again showed a linear relationship between tclot/CT and R2/r2 (Table S2 and Fig. S2), with all points falling on the line in the tested range. These results confirm that the coagulation time over a well-confined “subthreshold” patch of TF can be predicted from the clot time of an above-threshold patch scaled by a dilution factor.
Figure 4.

Numerical simulations of a spherical patch of TF of radius r centered in a spherical chamber of plasma of radius R show that the observed time to reach the critical concentration of free thrombin plus meizothrombin (tclot) scales linearly with R3/r3 and with CT, as predicted by Eq. 1. The black line shows a linear fit to the data (slope = 0.70, goodness of fit = 0.999). The red triangles, blue circles, and green stars represent simulations in which R, r, and CT, respectively, were varied. The quasi-3D geometry is drawn schematically on the left.
Dimensionless numbers Cn and Da2 describe confinement and the outcome of coagulation over subthreshold patches when tested by numerical simulations
Equation 1 describes the scaling of the clot time when a subthreshold patch is confined in all three dimensions, such as inside a spherical chamber. In this case there is no removal of activators from the chamber, so accumulating factors must eventually reach the threshold concentration and initiate clotting (assuming the net reaction is for production, not consumption, of activators). A more realistic scenario is of a patch that is confined in fewer than three dimensions, such as inside an open cylinder or between two parallel plates. In this case, some activator may be removed by diffusion or convective flow. We expect that confinement can still play a role in open systems, provided that 1), the walls are close enough to cause local accumulation of activators around the patch; and 2), this accumulation occurs faster than removal in the unconfined dimensions.
A patch is considered confined if the activators accumulate locally. To determine whether this accumulation occurs for a particular geometry and rate of removal, we compare the timescale of diffusion to the wall in one dimension, τwall = (x2/2D), to the timescale of removal in the free (wall-less) dimensions by diffusion or convective flow, τremove. Here, x [m] is the distance from the edge of the patch to the wall; for radially symmetric systems, x = R − r. We refer to the dimensionless ratio τwall /τremove as the confinement number, Cn, where . The system is confined for Cn < 1, i.e., if diffusible activators accumulate because they reach the wall in much less time than it takes to remove them (τwall < τremove). Cn can be determined separately for each dimension that has a wall. For a closed chamber, nf = 0 and convective loss is prevented, so activators cannot be removed from the chamber (i.e., τremove → infinity) and Cn = 0. This is complete confinement (see Supporting Material). For an open chamber with negligible flow, removal occurs purely by diffusion (τdiff << τconv), and Cn = τwall/τdiff = 4nf (x2/l2). For an open chamber in which removal occurs much more rapidly by flow than by diffusion (τdiff >> τconv), Cn reduces to the Graetz number, Gz = τwall/τconv = Pe x/l (30). Gz < 1 predicts that activators can diffuse to the wall before flowing past the patch; thus, the concentration profile over the patch is not limited to a boundary layer and is referred to as “fully developed”. Confinement in one or more dimensions is necessary but not sufficient for a subthreshold patch to initiate clotting.
A subthreshold patch (Da1 < 1) that is confined (Cn << 1) in at least one dimension will initiate clotting if (and only if) accumulating activators reach the threshold concentration inside the chamber. To determine whether the threshold is reached over a subthreshold patch for a particular geometry, rate of removal, and rate of reaction, we compare the timescale of removal, τremove, to the combined timescales of accumulation due to reaction and spatial confinement, τaccum + τwall. τaccum = CT × (Vc/Vp)nw is the time needed for activators that are released by the patch and diluted into the chamber to reach the threshold concentration. The term (Vc/Vp)nw describes the volume ratio of the chamber to the patch with respect to nw, the number of dimensions in which diffusion is bounded by a confining wall (a wall having Cn < 1). The dimensionless ratio τremove/(τaccum + τwall) predicts whether a subthreshold patch can initiate clotting, and is a specific case of the Damköhler number, Da2, where . Clotting should occur for Da2 > 1, i.e., if diffusible activators reach the wall and accumulate to the threshold in less time than it takes to remove them. Da2 is defined only for patches that are subthreshold (Da1 < 1). A system of diffusible activators with Da2 >> 1 is expected to clot with tclot ∼ τaccum + τwall. For all conditions that were simulated in this work, which used CT > 30 s, the diffusible activators reached the wall much more quickly than they accumulated to the threshold (τwall ≤ 1% of τaccum); however, for a fast reaction, such as CT ∼ 2 s, this relationship could reverse. Regardless, τwall and τaccum always occur sequentially, because significant accumulation cannot begin over a subthreshold patch until the activators have reached the confining walls. A subthreshold patch with Cn >>1 has Da2 << 1; simply stated, a subthreshold patch cannot initiate coagulation when it is unconfined.
We tested whether the Damköhler number Da2 could accurately predict the outcome of confined subthreshold patches of tissue factor in open chambers by using a numerical simulation. The simulations described in Fig. 4, which used a spherical chamber (nw = 3, nf = 0), fall into the category of Cn = 0 (complete confinement) and Da2 = infinity (guaranteed to clot, assuming constant net production of factors). To examine whether there is a critical Da2 below which clotting does not occur, we used a quasi-3D geometry consisting of a long cylindrical patch of radius r centered inside an open-ended cylindrical chamber of radius R, with no flow (i.e., τremove = τdiff). Parameters were chosen to maintain Cn << 1, i.e., the patch was well-confined in every case. In this geometry, nw = 2, nf = 1, and (Vc/Vp)nw = R2/r2, the ratio of the cross-sectional areas of the chamber and the patch. For simplicity, we varied R and r, held constant l = 500 μm and CT = 152 s ([TF] = 20 pM), and measured the clot time for each case (Table S3). As stated above, these experimental conditions give τwall << τaccum, so Da2 was simplified to Da2 = (l2/8nfD)/(CT(R/r)2). As predicted, clotting occurred only for Da2 greater than a critical value, Da2∗ (Fig. 5). In these simulations, we found that 0.142 < Da2∗ < 0.149 (Fig. 5). These results demonstrate that Da2 describes whether or not clotting will occur over a confined subthreshold patch.
Figure 5.

Numerical simulations of a cylindrical patch of TF of radius r centered in a cylindrical chamber of plasma of radius R show that the outcome, in terms of coagulation, of confinement of simulated subthreshold patches of TF depends on the Damköhler number Da2, as defined in the text. Da2 was varied by varying R and r. An outcome of one indicates clotting, and an outcome of zero indicates no clotting for >30,000 s. The critical Da2 was ∼0.145 for this system. The dotted line between points is a guide to the eye. The quasi-3D geometry is drawn schematically on the left.
Confinement can induce clotting in the presence of slow flow
Fluid flow increases the rate of removal of activators from the region over the patch (decreasing τremove). We tested whether confinement could induce clotting on subthreshold patches in the presence of flow by using a numerical simulation. We used a quasi-3D geometry consisting of two parallel plates separated by a distance R, with a linear patch of TF on the bottom plate perpendicular to the direction of flow (Fig. 6). The patch was 200 μm wide and contained 300 pM TF. Simulated plasma flowed between plates with a low shear rate of 1 s−1 at the wall. At this shear rate in a large chamber with R = 100 μm, the patch did not initiate clotting within 1 h (Fig. 6, C). When confined at the same shear rate in a chamber with R = 10 μm, the patch rapidly initiated clotting (Fig. 6, D). The maximum concentration of active thrombin in the chamber reached Ccrit in 132 s, after which the total (free and bound) thrombin concentration increased to its steady-state value, 1.4 μM. This result demonstrates that confinement can induce clotting over subthreshold patches in the presence of flow, as predicted by the analysis above. However, confinement should play a role only if the timescales τwall and τconv are similar, i.e., Gz = τwall/τconv ∼1 or less. Because Gz = Pe x/l (30), this suggests that the flow rates and Pe must be low for confinement to have an effect. Here, the confining chamber had Pe = 0.17 and Gz = 0.01.
Figure 6.
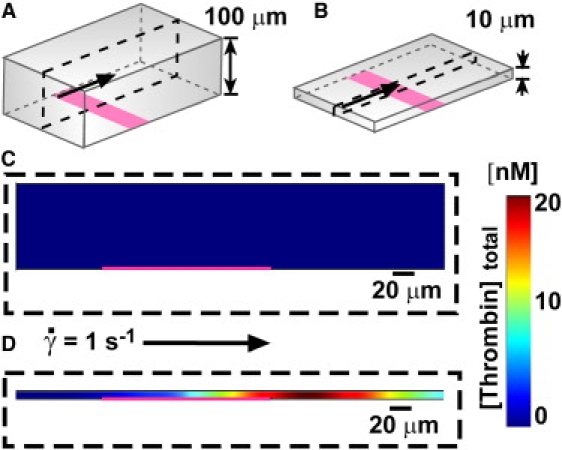
Confinement can induce clotting of a subthreshold patch in the presence of flow. (A and B) Numerical simulations were conducted of plasma flowing between two parallel plates, with a low shear rate at the wall of 1 s−1. A 200 μm wide patch of 300 pM TF (pink) crossed the bottom plate. The quasi-3D geometries are drawn schematically. (C and D) Plots below show [thrombin]total, the sum of [thrombin] and [meizothrombin], including both free and bound species. The pink line shows the location of the TF patch. (C) With plates separated by 100 μm (shown schematically in A), the patch did not initiate clotting, and [thrombin]total remained at a low level (blue). Plot shows t = 20 min. (D) With plates separated by 10 μm (shown schematically in B), the patch rapidly initiated clotting and [thrombin]total increased to a high concentration (red). Plot shows t = 135 s.
Confinement regulates the initiation of blood coagulation by bacteria GMDs
Having tested and described the initiation of coagulation by TF in confined volumes, we then tested the hypothesis that confinement of bacteria could lead to coagulation of plasma in vitro. In a previous work (16) we showed that Bacillus cereus releases proteases that activate both prothrombin and factor X, and that coagulation is initiated when the size of the patches of B. cereus is above threshold. Here, we tested whether a subthreshold cluster of B. cereus could also initiate coagulation by limiting the mass transfer of active factors using confinement. In these experiments, we placed human platelet-poor plasma with subthreshold-sized GMDs carrying B. cereus (“bacteria GMDs”) in large microfluidic chambers (diameter: 9 mm; height: 1 mm) and in small microfluidic channels (40 × 40 μm2; Fig. 7) (see Materials and Methods for details). In the less-confining microfluidic chambers, active factors generated by individual bacteria GMDs were constantly removed by diffusion, and bacteria GMDs did not initiate coagulation for >20 min (Fig. 7 A); however, placing similarly-sized individual bacteria GMDs in confining microfluidic channels decreased the clot time to <10 min (N = 3 beads in three separate experiments, p < 0.05; Fig. 7 B). This result indicates that confining microfluidic channels limit the mass transfer of active factors generated by bacteria GMDs and allow active factors to accumulate locally above the threshold concentration to initiate blood coagulation.
Figure 7.
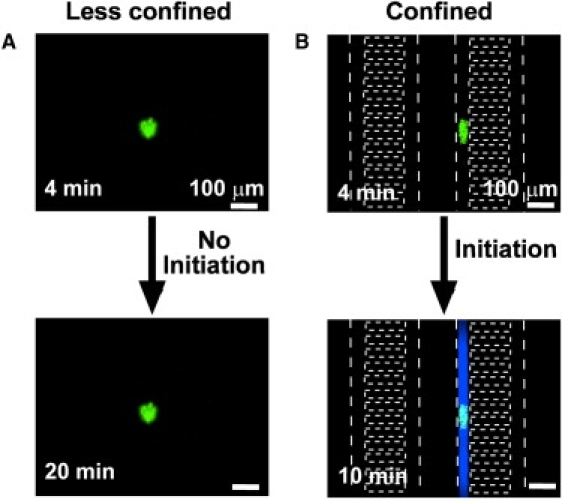
Bacteria GMDs initiate clotting rapidly only when confined. Initiation of coagulation by bacteria GMDs (green fluorescence) was monitored by using a fluorogenic substrate for thrombin. White dotted lines indicate channel walls of the microfluidic device. (A) A cluster of B. cereus on a GMD did not initiate clotting in a less-confining microfluidic chamber (9 mm diameter × 1 mm height) for 20 min. (B) A cluster of B. cereus on a GMD did initiate clotting (blue) in a confining channel in 10 min (40 × 40 μm2 channels).
Discussion
These results show that local confinement of a small amount of stimulus, such as TF or clot-inducing bacteria, can dramatically alter the outcome of coagulation, a nonlinear reaction network with threshold kinetics. Small beads carrying the stimulus rapidly initiated coagulation when confined, whereas there was no response to the unconfined beads. In the context of coagulation, the stimuli interact with the blood plasma to produce diffusible activators such as thrombin. These results demonstrate that a simple physical phenomenon, accumulation of activators due to environmental confinement, can have nontrivial consequences when applied to a reaction system with threshold kinetics. We used simple analytical arguments to predict the timescale of reaction in a completely confined system, and defined dimensionless ratios that described whether a patch of stimulus was confined, Cn, and whether a subthreshold patch could initiate clotting, Da2. These arguments were supported by numerical simulations of blood coagulation, in which the effects of confinement were robust to geometry, dimensionality, and the presence of flow. The arguments are general enough to apply to any system that is regulated by a threshold concentration of diffusible or transportable activators. Furthermore, this mechanism of local accumulation in a confining environment can specifically describe a means by which small quantities of bacteria can initiate clotting, which we refer to as “diffusion acting”. Diffusion acting is distinct from “diffusion sensing” as previously described (10), because it does not require a change in gene expression.
The experimental results presented here were characterized in the absence of shear flow or mixing. It was previously demonstrated that shear flow and mixing can affect the outcome of nonlinear networks (31), including blood coagulation (20,21,24), by regulating the Damköhler number. This occurs because shear flow, mixing, and confinement all affect the concentration profile of activators, and coagulation occurs only if the local concentration of active factors is above a threshold value. Shear flow and mixing decrease the local concentration of factors by diluting them away, whereas confinement increases the local concentration. In capillaries where the Peclet number (Pe) can be considerably low (Pe < 10) (32), and in pathological conditions of blood stasis (negligible flow) (33), confinement is expected to have a more significant effect on blood coagulation. The equation for Da2 derived here predicts that clotting can occur on a subthreshold patch in the presence of flow, as long as the geometry is sufficiently confined that the activators will accumulate locally above the threshold level. This prediction was upheld by numerical simulations using a low shear rate (Fig. 6). Experiments to test this prediction for blood coagulation and for other threshold-controlled systems would be informative but are beyond the scope of this study. Accumulation during flow requires a Gz (which is equal to τwall/τconv) of ∼1 or less, leading to a requirement of low Pe for confinement to have an effect.
In the context of blood coagulation, it remains to be tested in vivo whether small clusters of bacteria can induce coagulation (e.g., as in microvascular thrombosis in sepsis and associated disseminated intravascular coagulation (34)) via “diffusion acting” as they move from larger vessels into confined spaces such as capillaries or venous valves, and whether this mechanism plays a role in bacterial virulence. This mechanism would be rapid, as it relies on molecules already being presented on the surface of or being secreted by the bacteria, and it does not require induction of protein synthesis or secretion. It also remains to be tested whether coagulation can be initiated in vivo by confinement of other stimuli as well, such as soluble TF (35), microparticles carrying tissue factor (26), or blood-borne objects producing activators of clotting (e.g., clusters of platelets). In some cases, local accumulation of active factors could be further enhanced if particles or clusters in confined spaces manage to obstruct the flow of fluid through that space.
In coagulation, surface-bound inhibitors are more effective in capillaries and smaller blood vessels than in large vessels (36) because of the increased surface/volume ratio. Although surface-bound inhibitors were not included in this study, we predict that confinement may affect the initiation of reaction networks, such as coagulation, even in the presence of surface-bound inhibitors. As the radius, R, of a vessel decreases, the rate of inhibition should increase with the surface/volume ratio (∼1/R) while the rate of accumulation of factors due to confinement of a cluster or particle of constant size increases with 1/volume (∼1/R3 for a 3D volume and ∼1/R2 for a long cylinder). Therefore, at least in this simplistic analysis, as the volume decreases, the effect of confinement should increase more rapidly than the effect of surface-bound inhibitors. This prediction remains to be tested.
The analytical arguments presented in Eq. 1 and in the equations for Cn and Da2 describe any event that is regulated by a threshold concentration. To generalize, the term tclot may be replaced by tcrit, defined as the time to reach the critical concentration of the appropriate activator in a confined system. Similarly, CT may be replaced by tcrit,uniform, the time required to reach the critical concentration in a uniform system. Uniformity refers to any scenario in which the patch fills an infinite volume or the patch is the same size as the surrounding chamber (Vp = Vc). If necessary, a surface patch that is above the critical size (l >> Pcrit) may be used, although CT may be slightly extended by diffusion away from the surface. Thus the general case of Eq. 1 is tcrit = tcrit,uniform Vc/Vp; Cn remains unchanged, and Da1 and Da2 change only by replacing the term CT with tcrit,uniform. Restricting diffusion by confinement should affect any biological process that depends on soluble activators or signals, as long as their source is below the system's critical size.
There are limitations to the predictions one can make by using these analytical arguments, and the analytical model used here is too simplistic to capture all of the nuanced behavior of the complex network of blood coagulation. For example, Eq. 1 predicts a line of slope 1 for the plot of tclot/CT versus Vc/Vp, but the data from the 3D numerical simulation fell on a line of slope 0.70, indicating that clotting occurred more rapidly than predicted (Fig. 4). Similarly, the critical Da2∗ is predicted to be 1, but the simulated critical value was ∼0.14, indicating that clotting occurred at slightly less confined geometries than predicted (Fig. 5). One assumption in the model is that all activators are uniformly distributed throughout the chamber by the time clotting occurs. This does not accurately describe systems that include surface binding of species that are involved in positive feedback loops, or systems in which the time to reach the wall (τwall) is comparable to the time to accumulate to the threshold (τaccum). In the numerical model for blood coagulation used here, the primary autocatalytic species, thrombin, is indeed uniformly distributed on the timescale of clotting in chambers with R < 100 μm (Fig. S3 and Supporting Material). However, another factor involved in the feedback loop, factor Xa, spends some time bound to TF instead of freely diffusing. Factor Xa thus remains more concentrated over the patch (Fig. S3) and may be better able to catalyze the clotting process because of the spatial nonuniformity of the system (24).
An additional assumption is that the patch produces activators at a constant net rate, 1/CT, which incorporates the rates of both production and inhibition. One limitation of this assumption is that it cannot describe systems in which the rate of production of activator by the patch (averaged over the chamber volume) is less than the rate of inhibition of activator by the plasma. Specifically, the analytical model does not accommodate a critical volume ratio Vc/Vp above which clotting does not occur. A critical volume ratio is likely to exist, since large chambers (large Vc/Vp) and slow rates of production (low [TF]) are unlikely to initiate clotting. A full description of this phenomenon would require separation of the timescales of production and inhibition, which is beyond the scope of this study. Previous work with unconfined patches has shown that the clot time, tclot, increases nonlinearly as the patch size approaches a critical value. We expect that confined subthreshold patches should behave similarly, with tclot increasing nonlinearly as Vc/Vp approaches a critical value. This may have occurred for the point that did not fall on the line in Fig. 4, which with 5 pM TF had the slowest tested rate of production of activators and thus should have the lowest critical value of Vc/Vp. This hypothesis remains untested.
In vitro experiments are commonly used to reproduce or understand in vivo phenomena. Microfluidic experiments using droplets (37–43) or small chambers (7–9,14,44,45) are increasingly being used to recreate confining environments for cells in vitro. An in vitro system can make better predictions if it replicates the degree of cellular confinement that is found in vivo, to maintain the local concentration of activators or signaling molecules (7,8) The arguments presented here may be extended to such systems, with the most significant effects expected for systems that are controlled by thresholds. For example, Eq. 1 predicts that the in vitro reaction time (tcrit) can match the in vivo reaction time (tcrit,uniform) only if the ratio of the volume of the patch of stimulus to the volume of the chamber, Vc/Vp, is the same both in vivo and in vitro. In vivo, the “confining” environment consists of the interior of small vessels or the space between neighboring cells in the tissue. For confluent (touching) cells in vivo, Vc/Vp is ∼1. Recreating this 3D confined environment in cell culture requires a modification of traditional culture methods, such as by capping the culture environment to prevent loss of signals to the bulk medium over the cells (46). Of course, surface-driven processes, such as active uptake of signaling molecules, would require further modification of the cell culture system. Microfluidic tools may become useful for understanding the effects of confinement in these systems.
Environmental confinement is an important aspect to understand when considering the regulation of biological reactions. Confinement and thus “diffusion acting” may arise for a source of diffusing molecules when 1), the environment around the source is reduced in dimension; or 2), the source moves from an open environment to a confined environment. Systems with responses that are more nonlinear, such as those with thresholds, should be more drastically affected by confinement. Thresholds abound in physiology, including those seen in blood coagulation (23,47) and activation thresholds in the immune system (48), so we expect confinement to play a role in many contexts.
Supporting Material
Materials and Methods, three figures and three tables are available at http://www.biophysj.org/biophysj/supplemental/S0006-3495(09)1354-X.
Supporting Material
References
- 1.Han W.Q., Fan S.S., Li Q.Q., Hu Y.D. Synthesis of gallium nitride nanorods through a carbon nanotube-confined reaction. Science. 1997;277:1287–1289. [Google Scholar]
- 2.Ajami D., Rebek J. Adaptations of guest and host in expanded self-assembled capsules. Proc. Natl. Acad. Sci. USA. 2007;104:16000–16003. doi: 10.1073/pnas.0707759104. [DOI] [PMC free article] [PubMed] [Google Scholar]
- 3.Kreft O., Prevot M., Mohwald H., Sukhorukov G.B. Shell-in-shell microcapsules: a novel tool for integrated, spatially confined enzymatic reactions. Angew. Chem. Int. Ed. 2007;46:5605–5608. doi: 10.1002/anie.200701173. [DOI] [PubMed] [Google Scholar]
- 4.Nicholson C. Factors governing diffusing molecular signals in brain extracellular space. J. Neural Transm. 2005;112:29–44. doi: 10.1007/s00702-004-0204-1. [DOI] [PubMed] [Google Scholar]
- 5.Verkman A.S. Solute and macromolecule diffusion in cellular aqueous compartments. Trends Biochem. Sci. 2002;27:27–33. doi: 10.1016/s0968-0004(01)02003-5. [DOI] [PubMed] [Google Scholar]
- 6.Brinker A., Pfeifer G., Kerner M.J., Naylor D.J., Hartl F.U. Dual function of protein confinement in chaperonin-assisted protein folding. Cell. 2001;107:223–233. doi: 10.1016/s0092-8674(01)00517-7. [DOI] [PubMed] [Google Scholar]
- 7.Yu H.M., Meyvantsson I., Shkel I.A., Beebe D.J. Diffusion dependent cell behavior in microenvironments. Lab Chip. 2005;5:1089–1095. doi: 10.1039/b504403k. [DOI] [PubMed] [Google Scholar]
- 8.Yu H.M., Alexander C.M., Beebe D.J. Understanding microchannel culture: parameters involved in soluble factor signaling. Lab Chip. 2007;7:726–730. doi: 10.1039/b618793e. [DOI] [PubMed] [Google Scholar]
- 9.Park S., Wolanin P.M., Yuzbashyan E.A., Lin H., Darnton N.C. Influence of topology on bacterial social interaction. Proc. Natl. Acad. Sci. USA. 2003;100:13910–13915. doi: 10.1073/pnas.1935975100. [DOI] [PMC free article] [PubMed] [Google Scholar]
- 10.Redfield R.J. Is quorum sensing a side effect of diffusion sensing? Trends Microbiol. 2002;10:365–370. doi: 10.1016/s0966-842x(02)02400-9. [DOI] [PubMed] [Google Scholar]
- 11.Hense B.A., Kuttler C., Mueller J., Rothballer M., Hartmann A. Opinion—does efficiency sensing unify diffusion and quorum sensing? Nat. Rev. Microbiol. 2007;5:230–239. doi: 10.1038/nrmicro1600. [DOI] [PubMed] [Google Scholar]
- 12.Horswill A.R., Stoodley P., Stewart P.S., Parsek M.R. The effect of the chemical, biological, and physical environment on quorum sensing in structured microbial communities. Anal. Bioanal. Chem. 2007;387:371–380. doi: 10.1007/s00216-006-0720-y. [DOI] [PMC free article] [PubMed] [Google Scholar]
- 13.Dulla G., Lindow S.E. Quorum size of Pseudomonas syringae is small and dictated by water availability on the leaf surface. Proc. Natl. Acad. Sci. USA. 2008;105:3082–3087. doi: 10.1073/pnas.0711723105. [DOI] [PMC free article] [PubMed] [Google Scholar]
- 14.Boedicker J.Q., Vincent M.E., Ismagilov R.F. Microfluidic confinement of single cells of bacteria in small volumes initiates high-density behavior of quorum sensing and growth and reveals its variability. Angew. Chem. 2009;48:5908–5911. doi: 10.1002/anie.200901550. [DOI] [PMC free article] [PubMed] [Google Scholar]
- 15.Kastrup C.J., Runyon M.K., Shen F., Ismagilov R.F. Modular chemical mechanism predicts spatiotemporal dynamics of initiation in the complex network of hemostasis. Proc. Natl. Acad. Sci. USA. 2006;103:15747–15752. doi: 10.1073/pnas.0605560103. [DOI] [PMC free article] [PubMed] [Google Scholar]
- 16.Kastrup C.J., Boedicker J.Q., Pomerantsev A.P., Moayeri M., Bian Y. Spatial localization of bacteria controls coagulation of human blood by “quorum acting”. Nat. Chem. Biol. 2008;4:742–750. doi: 10.1038/nchembio.124. [DOI] [PMC free article] [PubMed] [Google Scholar]
- 17.Shen F., Kastrup C.J., Ismagilov R.F. Using microfluidics to understand the effect of spatial distribution of tissue factor on blood coagulation. Thromb. Res. 2008;122:S27–S30. doi: 10.1016/S0049-3848(08)70015-X. [DOI] [PubMed] [Google Scholar]
- 18.Basmadjian D. The effect of flow and mass-transport in thrombogenesis. Ann. Biomed. Eng. 1990;18:685–709. doi: 10.1007/BF02368455. [DOI] [PubMed] [Google Scholar]
- 19.Basmadjian D., Sefton M.V., Baldwin S.A. Coagulation on biomaterials in flowing blood: some theoretical considerations. Biomaterials. 1997;18:1511–1522. doi: 10.1016/s0142-9612(97)80002-6. [DOI] [PubMed] [Google Scholar]
- 20.Okorie U.M., Denney W.S., Chatterjee M.S., Neeves K.B., Diamond S.L. Determination of surface tissue factor thresholds that trigger coagulation at venous and arterial shear rates: amplification of 100 fM circulating tissue factor requires flow. Blood. 2008;111:3507–3513. doi: 10.1182/blood-2007-08-106229. [DOI] [PMC free article] [PubMed] [Google Scholar]
- 21.Shen F., Kastrup C.J., Liu Y., Ismagilov R.F. Threshold response of initiation of blood coagulation by tissue factor in patterned microfluidic capillaries is controlled by shear rate. Arterioscler. Thromb. Vasc. Biol. 2008;28:2035–2041. doi: 10.1161/ATVBAHA.108.173930. [DOI] [PubMed] [Google Scholar]
- 22.Runyon M.K., Johnson-Kerner B.L., Kastrup C.J., Van Ha T.G., Ismagilov R.F. Propagation of blood clotting in the complex biochemical network of hemostasis is described by a simple mechanism. J. Am. Chem. Soc. 2007;129:7014–7015. doi: 10.1021/ja072602p. [DOI] [PubMed] [Google Scholar]
- 23.Jesty J., Beltrami E. Positive feedbacks of coagulation—their role in threshold regulation. Arterioscler. Thromb. Vasc. Biol. 2005;25:2463–2469. doi: 10.1161/01.ATV.0000187463.91403.b2. [DOI] [PubMed] [Google Scholar]
- 24.Pompano R.R., Li H.W., Ismagilov R.F. Rate of mixing controls rate and outcome of autocatalytic processes: theory and microfluidic experiments with chemical reactions and blood coagulation. Biophys. J. 2008;95:1531–1543. doi: 10.1529/biophysj.108.129486. [DOI] [PMC free article] [PubMed] [Google Scholar]
- 25.Morrissey J.H. Tissue factor: an enzyme cofactor and a true receptor. Thromb. Haemost. 2001;86:66–74. [PubMed] [Google Scholar]
- 26.Mackman N., Tilley R.E., Key N.S. Role of the extrinsic pathway of blood coagulation in hemostasis and thrombosis. Arterioscler. Thromb. Vasc. Biol. 2007;27:1687–1693. doi: 10.1161/ATVBAHA.107.141911. [DOI] [PubMed] [Google Scholar]
- 27.Hockin M.F., Jones K.C., Everse S.J., Mann K.G. A model for the stoichiometric regulation of blood coagulation. J. Biol. Chem. 2002;277:18322–18333. doi: 10.1074/jbc.M201173200. [DOI] [PubMed] [Google Scholar]
- 28.Kogan A.E., Kardakov D.V., Khanin M.A. Analysis of the activated partial thromboplastin time test using mathematical modeling. Thromb. Res. 2001;101:299–310. doi: 10.1016/s0049-3848(00)00405-9. [DOI] [PubMed] [Google Scholar]
- 29.Jones K.C., Mann K.G. A model for the tissue factor pathway to thrombin. 2. A mathematical simulation. J. Biol. Chem. 1994;269:23367–23373. [PubMed] [Google Scholar]
- 30.Kockmann N. Springer; Berlin/Heidelberg: 2008. Transport Phenomena in Micro Process Engineering. [Google Scholar]
- 31.Epstein I.R. The consequences of imperfect mixing in autocatalytic chemical and biological systems. Nature. 1995;374:321–327. doi: 10.1038/374321a0. [DOI] [PubMed] [Google Scholar]
- 32.Aroesty J., Gross J.F. Convection and diffusion in the micro circulation. Microvasc. Res. 1970;2:247–267. doi: 10.1016/0026-2862(70)90016-6. [DOI] [PubMed] [Google Scholar]
- 33.Hinshaw L.B. Sepsis/septic shock: participation of the microcirculation: an abbreviated review. Crit. Care Med. 1996;24:1072–1078. doi: 10.1097/00003246-199606000-00031. [DOI] [PubMed] [Google Scholar]
- 34.Zeerleder S., Hack C.E., Wuillemin W.A. Disseminated intravascular coagulation in sepsis. Chest. 2005;128:2864–2875. doi: 10.1378/chest.128.4.2864. [DOI] [PubMed] [Google Scholar]
- 35.Bogdanov V.Y., Balasubramanian V., Hathcock J., Vele O., Lieb M. Alternatively spliced human tissue factor: a circulating, soluble, thrombogenic protein. Nat. Med. 2003;9:458–462. doi: 10.1038/nm841. [DOI] [PubMed] [Google Scholar]
- 36.Esmon C.T. The roles of protein-C and thrombomodulin in the regulation of blood-coagulation. J. Biol. Chem. 1989;264:4743–4746. [PubMed] [Google Scholar]
- 37.Dittrich P.S., Jahnz M., Schwille P. A new embedded process for compartmentalized cell-free protein expression and on-line detection in microfluidic devices. ChemBioChem. 2005;6:811–814. doi: 10.1002/cbic.200400321. [DOI] [PubMed] [Google Scholar]
- 38.He M.Y., Edgar J.S., Jeffries G.D.M., Lorenz R.M., Shelby J.P. Selective encapsulation of single cells and subcellular organelles into picoliter- and femtoliter-volume droplets. Anal. Chem. 2005;77:1539–1544. doi: 10.1021/ac0480850. [DOI] [PubMed] [Google Scholar]
- 39.Um E., Lee D.S., Pyo H.B., Park J.K. Continuous generation of hydrogel beads and encapsulation of biological materials using a microfluidic droplet-merging channel. Microfluid. Nanofluidics. 2008;5:541–549. [Google Scholar]
- 40.Huebner A., Olguin L.F., Bratton D., Whyte G., Huck W.T.S. Development of quantitative cell-based enzyme assays in microdroplets. Anal. Chem. 2008;80:3890–3896. doi: 10.1021/ac800338z. [DOI] [PubMed] [Google Scholar]
- 41.Koster S., Angile F.E., Duan H., Agresti J.J., Wintner A. Drop-based microfluidic devices for encapsulation of single cells. Lab Chip. 2008;8:1110–1115. doi: 10.1039/b802941e. [DOI] [PubMed] [Google Scholar]
- 42.Clausell-Tormos J., Lieber D., Baret J.C., El-Harrak A., Miller O.J. Droplet-based microfluidic platforms for the encapsulation and screening of mammalian cells and multicellular organisms. Chem. Biol. 2008;15:427–437. doi: 10.1016/j.chembiol.2008.04.004. [DOI] [PubMed] [Google Scholar]
- 43.Boedicker J.Q., Li L., Kline T.R., Ismagilov R.F. Detecting bacteria and determining their susceptibility to antibiotics by stochastic confinement in nanoliter droplets using plug-based microfluidics. Lab Chip. 2008;8:1265–1272. doi: 10.1039/b804911d. [DOI] [PMC free article] [PubMed] [Google Scholar]
- 44.Wu L.Y., Di Carlo D., Lee L.P. Microfluidic self-assembly of tumor spheroids for anticancer drug discovery. Biomed. Microdevices. 2008;10:197–202. doi: 10.1007/s10544-007-9125-8. [DOI] [PubMed] [Google Scholar]
- 45.Bradshaw E.M., Kent S.C., Tripuraneni V., Orban T., Ploegh H.L. Concurrent detection of secreted products from human lymphocytes by microengraving: cytokines and antigen-reactive antibodies. Clin. Immunol. 2008;129:10–18. doi: 10.1016/j.clim.2008.06.009. [DOI] [PMC free article] [PubMed] [Google Scholar]
- 46.Ramunas J., Illman M., Kam A., Farn K., Kelly L. True monolayer cell culture in a confined 3D microenvironment enables lineage informatics. Cytometry A. 2006;69A:1202–1211. doi: 10.1002/cyto.a.20341. [DOI] [PubMed] [Google Scholar]
- 47.Mann K.G., Brummel K., Butenas S. What is all that thrombin for? J. Thromb. Haemost. 2003;1:1504–1514. doi: 10.1046/j.1538-7836.2003.00298.x. [DOI] [PubMed] [Google Scholar]
- 48.Grossman Z., Paul W.E. Adaptive cellular interactions in the immune-system—the tunable activation threshold and the significance of subthreshold responses. Proc. Natl. Acad. Sci. USA. 1992;89:10365–10369. doi: 10.1073/pnas.89.21.10365. [DOI] [PMC free article] [PubMed] [Google Scholar]
Associated Data
This section collects any data citations, data availability statements, or supplementary materials included in this article.