

Abstract
The fluorescent-protein based fluorescence resonance energy transfer (FRET) approach is a powerful method for quantifying protein-protein interactions in living cells, especially when combined with fluorescence lifetime imaging microscopy (FLIM). To compare the performance of different FRET couples for FRET-FLIM experiments, we first tested enhanced green fluorescent protein (EGFP) linked to different red acceptors (mRFP1-EGFP, mStrawberry-EGFP, HaloTag (TMR)-EGFP, and mCherry-EGFP). We obtained a fraction of donor engaged in FRET (fD) that was far from the ideal case of one, using different mathematical models assuming a double species model (i.e., discrete double exponential fixing the donor lifetime and double exponential stretched for the FRET lifetime). We show that the relatively low fD percentages obtained with these models may be due to spectroscopic heterogeneity of the acceptor population, which is partially caused by different maturation rates for the donor and the acceptor. In an attempt to improve the amount of donor protein engaged in FRET, we tested mTFP1 as a donor coupled to mOrange and EYFP, respectively. mTFP1 turned out to be at least as good as EGFP for donor FRET-FLIM experiments because 1), its lifetime remained constant during light-induced fluorescent changes; 2), its fluorescence decay profile was best fitted with a single exponential model; and 3), no photoconversion was detected. The fD value when combined with EYFP as an acceptor was the highest of all tandems tested (0.7). Moreover, in the context of fast acquisitions, we obtained a minimal fD (mfD) for mTFP1-EYFP that was almost two times greater than that for mCherry-EGFP (0.65 vs. 0.35). Finally, we compared EGFP and mTFP1 in a biological situation in which the fusion proteins were highly immobile, and EGFP and mTFP1 were linked to the histone H4 (EGFP-H4 and mTFP1-H4) in fast FLIM acquisitions. In this particular case, the fluorescence intensity was more stable for EGFP-H4 than for mTFP1-H4. Nevertheless, we show that mTFP1/EYFP stands alone as the best FRET-FLIM couple in terms of fD analysis.
Introduction
Quantitative microscopy techniques are performed in live cells to elucidate the spatial and temporal dynamics of protein interactions. Imaging of fluorescence resonance energy transfer (FRET) (1) using fluorescent proteins (FPs) (2) in living cells helps to detect and quantify protein-protein interactions to reveal the spatiotemporal dynamics of different biological systems (3). A suitable technique for detecting FRET is fluorescence lifetime imaging microscopy (FLIM). By using FLIM to quantify FRET, one can determine the fraction of donor in the interaction (fD) (4–7). This parameter is related to the relative concentration of interacting protein and is particularly interesting in relation to biology. In the last few years, FLIM has emerged as a powerful tool to detect and quantify the dynamics of protein interactions. Different approaches have been developed that reduce acquisition times (8,9), provide a map of the molecular environment of a fluorophore in a rapid manner, and allow the related interaction to be followed as a function of time.
The sensitivity of a FRET experiment depends on the FP couple used. Frequently, comparisons between different FRET couples are performed using tandems with a mean determination of the FRET efficiency, E (10,11). However, when considering intermolecular interactions, the main parameter to compare for every FRET pair is the fD value, which is only accessible with the use of FLIM. Additionally, in FRET-FLIM experiments, it is important to use a donor with the right photophysical properties, i.e., high photostability, absence of photoconversion, and single exponential behavior of its fluorescence decay profile. Enhanced green fluorescent protein (EGFP) is known to fulfill these requirements (12) and is frequently combined with red acceptors for FLIM experiments (9,13–17). However, red acceptors (e.g., mRFP1 (18) and mCherry (19)) exhibit relatively low fD values that can lead to misinterpretation of quantitative data (14,20). This implies that when intermolecular interactions in a particular biological system are being considered, a mathematical fD correction should be done (9,14).
In an attempt to determine the best FRET couple for quantitative FRET-FLIM, we analyzed a set of different FRET standards formed by two FPs (donor and acceptor) linked by a polypeptide chain. We used FLIM to find the best couple of fluorophores for quantitative experiments based on fD calculation. mTFP1-EYFP and mTFP1-mOrange were previously proposed as attractive FRET couples by Ai and co-workers (21). They also reported that the mTFP1 fluorescence decay was best described with a single exponential model; however, they did not perform a quantitative FRET-FLIM analysis in live cells in that study. We first tested mTFP1's photophysical properties to consider it as a donor for FLIM. Tandems formed by EGFP linked to different red acceptors, and mTFP1 linked to mOrange and EYFP were tested using a time-correlated single photon counting (TCSPC) device (6,12). We show that mTFP1 is a good donor FLIM fluorophore and together with EYFP forms the best FRET couple in terms of fD. We then tested the use of tandem mTFP1-EYFP in the context of fast acquisition times using a time-gated charge-coupled device (CCD) camera. We also verified the validity of mfD in comparison with other approaches such as double stretched exponential or double discrete exponential fitting. Finally, to gain insight into a biological context in which the fused protein is highly immobile (chromatin), we compared EGFP and mTFP1 behaviors when fused to histone H4 in live HEK293 cells.
Materials and Methods
Plasmid constructs and cell culture
The plasmids coding the mCherry-EGFP and EGFP-EGFP tandems have been described elsewhere (12). The mTFP1-mOrange tandem was a generous gift from Dr. O. Albagli (IGR, Villejuif, France). The constructions coding for the two tandems between EGFP and tdimer2 (12) or mRFP1 (18), named TdRed-EGFP and mRFP1-EGFP, respectively, were generous gifts from Dr. S. Ahmed (Center for Molecular Medicine, Biopolis, Singapore). The cloning of mStrawberry-EGFP, mTFP1-EYFP, HaloTag-EGFP, EGFP-H4, and mTFP1-H4 is described in detail in the Supporting Material. The cloning strategy enabled us to maintain the same peptide linker (SGLRSRGDPPVAT) between the FRET partners for the mCherry-EGFP, mStrawberry-EGFP, mTFP1-EYFP, and HaloTag-EGFP tandems.
He-La and HEK293 cells were cultured in Dulbecco's modified Eagle's medium (DMEM) containing 10% fetal bovine serum (PAA Laboratories, Pasching, Austria). The cultures were incubated at 37°C in a humidified atmosphere of 5% CO2. He-La cells were seeded on 32 mm round glass coverslips at a density of 2 × 10⁵ cells. When the cells reached ∼50–70% of confluence, they were transfected with a total amount of 1 μg of expression vectors using Nanofectin I (PAA Laboratories). Finally, 24 h after transfection, the coverslips were mounted in an open observation chamber with special DMEM-F12 to prevent fluorescence from the medium (DMEM-F12 without Phenol red, vitamin B12, or riboflavin, and supplemented with 20 mM Hepes and L-Glutamine from PAA Laboratories).
Wide-field fluorescence microscopy
An inverted microscope (Leica DMIRE2; Manheim, Germany) equipped with piezo scanning technology and optics using as excitation source (EL6000, Manheim, Germany) and an oil immersion objective with a numerical aperture (NA) 1.4 was used to test mTFP1 and EGFP photostability. A high-resolution camera (CoolSnap HQ; Photometrics, Tucson, AZ) was used to acquire image stacks in which the time delay between each acquisition was set to 10 s. All instrumentation was controlled using Metamorph 6 (Universal Imaging, West Chester, PA).
Time-domain picosecond FLIM and data analysis
Space-resolved fluorescence lifetimes were obtained by simultaneously acquiring time and space information with the use of a time- and space-correlated single-photon counting (TSCSPC) detector (quadrant anode detector; EuroPhoton, Berlin, Germany), as described previously (9,22). The mode-locked titanium sapphire laser (Millennia 5W/Tsunami 3960-M3BB-UPG kit; Spectra-Physics, Les Ulis, France) was tuned to 960 nm and 880 nm to obtain wavelengths of 480 nm and 440 nm, respectively, after frequency doubling for EGFP and mTFP1 excitation, and 535AF45 and 480/30 emission filters were used.
The acquired fluorescence decays were deconvoluted with the instrument response function and fitted by a Marquardt nonlinear least-square algorithm using Globals Unlimited software (Laboratory for Fluorescence Dynamics, University of California, Irvine, CA). To perform the fits, three different approaches were considered: 1), a two-species model in which two populations are taken into consideration (an interacting fraction corresponding to a population that relaxes through FRET, and a noninteracting fraction in which the donor lifetime remains undisturbed); 2), a stretched exponential approach (23,24) (considering that instead of a discrete FRET lifetime, a distribution of lifetimes could arise from the different orientations between the donor and acceptors); 3), a discrete double exponential for the tandem, which leaves both lifetimes free. All of these models are described in detail in the Supporting Material.
Multifocal multiphoton FLIM and data analysis
The two-photon picosecond FLIM system (TriM-FLIM) is equipped with a multifocal multiphoton excitation (TriMscope; LaVisionBiotec, Bielefeld, Germany) and a fast-gated CCD camera (Picostar; LaVisionBiotec) as described elsewhere (9,25). Two-photon multifocal excitation was performed with the TriMScope connected to an inverted microscope (IX 71; Olympus, Tokyo, Japan). In this method, a mode-locked Ti:Sa laser (Spectra Physics, Les Ulis, France) at 770, 800, 830, and 940 nm for the excitation of mTFP1 and EGFP, respectively, is split into 4 and 16 beams for the EGFP and mTFP1, respectively, by means of a 50/50 beam splitter and mirrors. The set of beams passes through a 2000 Hz scanner before illuminating the back aperture of a ×60 NA 1.2 infrared water immersion objective (Olympus). A line of foci is then created at the focal plane. A filter wheel of spectral filters (535AF45 for EGFP and 480AF30 for mTFP1) is used to select the fluorescence imaged onto a fast-gated light intensifier connected to a CCD camera (Picostar). The gate of the intensifier (adjusted at 2 ns) is triggered by an electronic signal coming from the laser, and a programmable delay box is used to acquire a stack of five time-correlated images. All instrumentation is controlled by ImSpector software developed by LaVisionBiotec.
The mathematical approach used to recover the minimal fraction of interacting donor (mfD) from the diminution of the donor mean lifetime alone and in the presence of the acceptor is described elsewhere (9) and details are provided in the Supporting Material.
Results and Discussion
mTFP1 shows adequate fluorescence properties for quantitative FRET-FLIM
The use of mTFP1 as a donor for FRET experiments was previously suggested by Ai et al. (21). However, we were interested in testing whether mTFP1 can be compared with EGFP in the context of quantitative FRET-FLIM assays. EGFP is known to be a good donor because it has photostability, its fluorescence decay can be best fitted with a single exponential, and photobleaching has no effect on its lifetime (12). Consequently, we verify that mTFP1 can be used as donor for quantitative FRET-FLIM.
Live He-La cells expressing mTFP1 and EGFP were constantly exposed to mercury lamp wide-field illumination using 440 ± 10 nm and 475 ± 20 nm band-pass filters (1.65 mW and 1.93 mW at the exit of the objective), respectively, and images were acquired every 10 s until at least 50% of the initial intensity disappeared. Different cells were selected to have similar initial intensity values, and two representative intensity time profiles are shown in Fig. 1. The intensity profile of both proteins presents a similar timescale. We calculated the mean half-time of photobleaching (t1/2, time in which a diminution of 50% intensity is observed) and obtained a t1/2(mTFP1) = 136 s ± 5 s (n = 6) and t1/2(EGFP) = 213 s ± 18 s (n = 6). Our results are in agreement with those of Ai et al. (19). The photostability of mTFP1 can be satisfactorily compared with that of EGFP.
Figure 1.
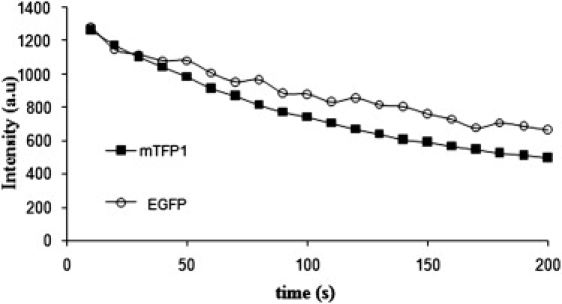
Photostability comparison between EGFP and mTFP1. EGFP (white circles) and mTFP1 (black squares) intensity profile measured in two monotransfected cells as a function of illumination time under the microscope are presented. The time delay between each acquisition was set to 10 s. The system was equipped with 440 nm ± 10 and 475 nm ± 20 band-pass filters, and we calculated an average power of 1.65 mW and 1.93 mW at the exit of the objective for mTFP1 and EGFP, respectively. We obtained similar half-life times of photobleaching for both proteins (in this case, we recovered t1/2(mTFP1) = 132 s and t1/2(EGFP) = 205 s).
As previously observed in vitro, mTFP1 fluorescence decay is well fitted with the use of a single exponential model (19). Using time-domain picosecond FLIM, we found identical results when mTFP1 was expressed in live He-La cells with a lifetime of 2.83 ± 0.02 ns (n = 10) in contrast to other cyan FPs (ECFP and mCerulean) were multiexponential decays are described (15,22,26,27). Amcyan (BD Biosciences, Franklin Lakes, New Jersey) decay can be successfully fitted with a single exponential model (data not shown), but the formation of tetramers and aggregates in the context of living cells makes this protein unattractive for fluorescence microscopy. Again, the fluorescence lifetime behavior of mTFP1 was comparable to that of EGFP.
In a previous work we showed that the lifetime of EGFP is insensitive to photobleaching (12). To test whether the mTFP1 lifetime is also insensitive to photobleaching, we exposed cells expressing mTFP1 to mercury lamp wide-field illumination (3.5 W/cm2 at 440 nm), and mTFP1 fluorescence decays were successively measured after 0, 90, 180, 270, 360, and 450 s of exposure time. Fluorescence decay acquisitions were performed using time-domain FLIM at very low excitation levels (30 mW/cm2 or less at the focal plane) to avoid photodamage. The corresponding mTFP1 fluorescence decays for each illumination exposure time are shown in Fig. 2 A. Since the decays were measured during the same acquisition time, the decay amplitudes are proportional to steady-state intensity measurements, showing a decrease after the illumination time. As shown by the similar slope of all the decays, the lifetime remained more or less constant. For all curves, the decays are well fitted by the single lifetime model. Results are presented in Fig. 2 B, which shows a slight lifetime decrease from 2.77 to 2.62 ns. This decrease is equivalent to what was observed for EGFP and can be considered minor in comparison with other proteins, such as CFP, that present photoconversion and thus a complex fluorescence decay profile (12). Here, we show that photobleaching has no significant effect on the mTFP1 lifetime. Taken together, these results show that mTFP1 as donor is a good candidate for FRET-FLIM experiments.
Figure 2.
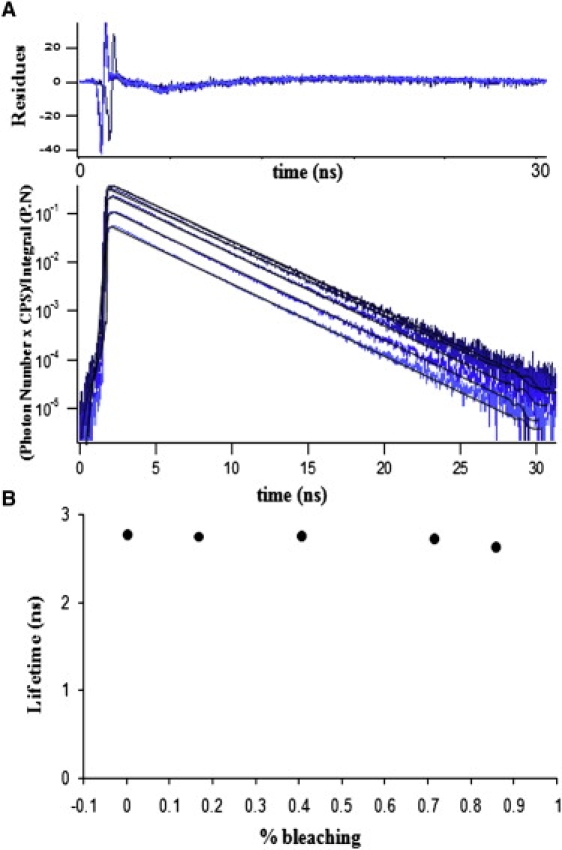
Fluorescence lifetime stability of mTFP1 in the presence of photobleaching. (A) Five mTFP1 fluorescent decay profiles acquired after different exposure times using the TSCSPC method. All fluorescent decays (blue curves) correspond to the same He-La cell exposed to Hg lamp illumination (3.5 W/cm2 at 440 nm) successively acquired after 0, 90, 180, 270, 360, and 450 s of exposure time. All curves present a similar slope regardless of the exposure time to the Hg lamp. The fits were obtained by using a discrete single exponential model (black lines corresponding to 2.77, 2.75, 2.72 and 2.62 ns), and the residues are also presented in the upper panel. (B) Calculated mTFP1 lifetimes for each fluorescent decay depicted in Fig. 2 A using a single exponential fit as a function of percent of photobleaching are presented.
Characterization of the fraction of donor in interaction for different FP tandems
FP tandems are usually used as FRET standards (10–12). Theoretically, all donors should interact with their corresponding acceptors. The measured FRET efficiency would then vary only as a result of different Förster distances, R0 values, and/or orientations between electronic transition moments of donor and acceptor. However, by using the FRET-FLIM technique, which allows simultaneous calculation of the fraction of donor in interaction, fD, and transfer efficiency, E, previous studies have shown that the fraction of donor FP in these tandems is far from being one (9,14,20). Hence, a characterization of the best FRET couple should be based on a careful fD determination.
To determine fD for a set of different tandem constructs, we performed FRET experiments using time-domain picosecond FLIM. All tandems were constructed using the same peptide linker between donor and acceptor FPs. EGFP and mTFP1 were chosen as donors. As acceptors we used mCherry, mStrawberry, mRFP1, TdRed, and HaloTag (TMR) for EGFP, and mOrange and EYFP for mTFP1. As a result of FRET, all tandems show faster donor fluorescence decays than the corresponding donor alone. The fluorescence decay of tandems did not exhibit monoexponential decay, which means that the donors did not transfer their energy to the acceptors in identical ways. First, we analyzed the donor fluorescence decay profile using a discrete double exponential model (see Eq. S1 in the Supporting Material). In the double exponential model, the long lifetime was fixed to the lifetime of the donor alone, τD (τD = 2.49 ± 0.02 ns (n = 10) for EGFP, and 2.83 ± 0.02 ns (n = 10) for mTFP1), and the short lifetime corresponds to the FRET lifetime, τF. The transfer efficiency (E) was calculated from previous knowledge of τF and τD (Eq. S4 in the Supporting Material). The fD and E values for all tandems analyzed are presented in Table 1. Of interest, as expected by the weak variation of different R0 values obtained using different FPs and the same peptide linker, all tandems analyzed exhibited similar E values (Table 1). In contrast, fD values differed from tandem to tandem. Tandems formed by EGFP linked to monomeric red acceptors (e.g., mCherry-EGFP tandem; Fig. 3 A) showed fD values no higher than 0.45 (Table 1). We also tested a tandem formed by HaloTag-EGFP, using trimethyl rhodamine (TMR) as a ligand, in an attempt to increase fD, since TMR is an organic fluorophore and HaloTag protein maturation differs from that of FPs. We could only obtain fD values of 0.27 with short ligand incubation times (15 min) and 0.45 with longer times (24 h). It was previously shown that multimeric red acceptors increase FRET efficiency (28). Here, we were able to increase fD up to 0.77 when we used a tandem formed by EGFP linked to two red acceptors (TdRed-EGFP). This increase is related to the higher probability of transferring either the first or second acceptor into the same tandem. However, the steric hindrance of a twofold larger FP is less convenient for biological applications, and the strategy of increasing the number of acceptors to increase the fD does not seem to be a good choice. Fluorescence decay profiles obtained from tandems using mTFP1-mOrange and mTFP1-EYFP in comparison with mTFP1 alone are shown in Fig. 3 B. Even though the fluorescence decay of mTFP1-mOrange is faster than that of mTFP1 alone, one can see a remarkable difference for mTFP1-EYFP. In fact, similar fD values were found for mTFP1-mOrange in comparison with monomeric red acceptor-EGFP tandems, and although E values were the highest (E = 0.68), this had no effect on fD. Only mTFP1-EYFP showed a big increase in fD (0.70) and is by far the best tandem in terms of fD (if we exclude multimeric acceptors). It is possible that the use of Venus and mCitrine combined with mTFP1 could improve our results, since these variants present a lower pKa and hence are more pH-resistant than EYFP (29).
Table 1.
Fraction of interacting donor (fD) and FRET efficiency (E) for tandems using a discrete double exponential model with fixed donor
| Tandem | fD | E |
|---|---|---|
| TdRed-EGFP | 0.77 ± 0.14 | 0.64 ± 0.01 |
| mRFP1-EGFP | 0.26 ± 0.08 | 0.56 ± 0.02 |
| HaloTag(TMR)-EGFP | 0.23 ± 0.09 | 0.56 ± 0.04 |
| HaloTag(TMR)-EGFP∗ | 0.39 ± 0.06 | 0.51 ± 0.05 |
| mStrawberry-EGFP | 0.37 ± 0.07 | 0.58 ± 0.02 |
| mCherry-EGFP | 0.45 ± 0.02 | 0.58 ± 0.03 |
| mTFP1-mOrange | 0.37 ± 0.01 | 0.68 ± 0.02 |
| mTFP1-EYFP | 0.71 ± 0.01 | 0.61 ± 0.08 |
Standard deviation was calculated for a population of five different cells for each tandem. HaloTag(TMR)-EGFP experiments were obtained with ligand (TMR) incubation of 15 min, whereas for HaloTag(TMR)-EGFP∗ the incubation time was 24 h.
Figure 3.

Donor fluorescence decay and fit using a discrete double exponential with fixed donor for different tandems. (A) Fluorescence decay of mCherry-EGFP tandem is better described with a double exponential model. Fluorescence decay profile for EGFP alone (green) using TSCSPC extracted from the whole cell is fitted with a single exponential (black line). Fluorescence decay profile for mCherry-EGFP (red) is fitted with a single and a double discrete double exponential (black lines). The residues of the fit are presented in the upper panel. (B) Comparison of the effect of EYFP and mOrange on the donor fluorescence decay for mTFP1 tandems. Fluorescence decay profiles for mTFP1 (blue), mTFP1-mOrange (orange) and mTFP1-EYFP (yellow) using TSCSPC extracted from the whole cell are fitted using a single exponential model (for mTFP1 alone) and a double exponential model (for tandems). The residues are shown in the upper panel.
fD determination depends on the spectroscopic heterogeneity of the acceptor population
The relatively low fD values found for all tandems, particularly for red acceptors, could be a result of 1), photo-induced processes; 2), a possible proteolysis phenomenon; 3), the maturation time (30) and/or overexpression of the FP (11,31) leading to misfolded proteins; and 4), an intrinsic spectroscopic heterogeneity of the acceptor population. In the first case, previous studies have revealed the existence of photo-induced dark states in different FPs (14,32,33). In our case, this situation is unlikely because of the small ratio of the donor's cross section to the acceptor's cross section of the excitation spectra, the small extinction coefficient of the different acceptors used, and the low light excitation used to avoid cytotoxicity. In addition, the same fD ratio was found for different power excitations, as well as in one photon and two photon excitations. Another reason for the low fD values could be proteolysis of the linker. We conducted several experiments using Western blot analysis (data not shown) and found no evidence of cleavage. Moreover, it was previously shown by others (20) that dual-color photon-counting histogram analysis of a tandem EGFP-red acceptor tandem (EGFP-mRFP) gave a fraction of interacting donor of ∼0.40. They also found that all red acceptors were associated with EGFP, excluding the possibility of proteolysis. The fact that fD was increased by a factor of 2 when fD was quantified for the tandem EGFP-TdRed (using two red acceptors) also points to the absence of cleavage. As for the third case, in which different maturation rates for donor and acceptor were considered, we found that different maturation rates had a minor effect on fD quantification by stopping protein production using cycloheximide (Fig. S1). The maturation process involves folding of the protein, cyclization of a tripeptide motif, and oxidation of the cyclized motif (34). These chemical processes are strongly dependent on the FP family, and EGFP-like proteins may have faster and more effective maturation rates than other red FPs. This explains why the mTFP1-EYFP couple is by far the most effective one in terms of fD. Since EYFP belongs to the EGFP family, we believe it may have a faster and more efficient maturation rate than FPs belonging to the mFruit family (35). Therefore, the heterogeneity of the acceptor population is smaller in the mTFP1-EYFP tandem. Finally, it is likely that an intrinsic spectroscopic heterogeneity exists, since the maturation time by itself cannot explain this phenomenon. We hypothesize that our model contains two homogeneous populations of donors: one that is engaged in FRET and one that is not. It is worth noting that this model does not consider a hypothetical distribution of FRET efficiencies. In the case of having a distribution of FRET efficiencies, which would be the common situation when considering an intrinsic spectroscopic heterogeneity of the acceptor, the model cannot take into account this distribution, and the result, as mentioned above, will be two subpopulations: 1) one corresponding to the fraction of donor engaged in FRET, which would be the distribution with high E; and 2) a population in which FRET does not occur and therefore remains undisturbed, which would correspond to the population with a very low E.
Comparative analysis using discrete and stretched exponential models
The above-described discrete double exponential approach, in which the donor lifetime is fixed to a previously known or calculated value, implies that there is only one possible FRET lifetime and hence one population of interacting proteins. If instead of having a fixed donor value, both lifetimes are left free to vary, it is considered a model in which the two exponentials account for different FRET lifetimes corresponding to different interacting populations (Eq. S3 in the Supporting Material). We compared the different fitting models from a representative decay of mCherry-EGFP and mTFP1-EYFP (Table 2). For mCherry-EGFP, we found a long lifetime of 2.44 ns instead of the fixed value of 2.50 ns and a short lifetime of 1.03 ns instead of 1.10 ns. The normalized preexponential factors remained very similar. For mTFP1-EYFP, we found a long lifetime of 2.51 ns instead of the fixed value of 2.80 ns and a short lifetime of 0.91 ns instead of 1.14 ns. Here, the normalized preexponential factors are slightly different, with the long lifetime contribution being 0.39 instead of 0.27. In this model, for the two tandems, the fluorescence transfer rates from the donor to the two possible acceptor states would result in two FRET lifetimes: one very close to what was previously considered the donor lifetime (τ1), and a shorter one (τ2) that gives rise to two FRET efficiencies (E1 and E2), in accordance with the work of Wu et al. (36) for mCherry-EGFP. We note, however, that the difference between fixing the donor lifetime or leaving it free is not statistically significant (for example, the difference in χ2 for both models using the mCherry-EGFP tandem was only ∼2%).
Table 2.
Comparison of different fitting models for FRET determination using tandems
| Bi-exp. τD fixed |
Bi-exp. |
Bi-exp. τF stretched |
mfD approach |
|||||||||||||
|---|---|---|---|---|---|---|---|---|---|---|---|---|---|---|---|---|
| Tandem | A1 | τD | A2 | τF | A1 | τ1 | A2 | τ2 | A1 | τD | A2 | τF | β | 〈τ〉 | τD | mfD |
| mCherry-EGFP | 0.49 | 2.50F | 0.51 | 1.10 | 0.52 | 2.44 | 0.48 | 1.03 | 0.45 | 2.49 | 0.55 | 1.01 | 0.90 | 2.20 | 2.45 | 0.33 |
| mTFP1-EYFP | 0.27 | 2.80F | 0.73 | 1.14 | 0.39 | 2.51 | 0.61 | 0.91 | 0.07 | 2.83 | 0.93 | 1.02 | 0.74 | 2.05 | 2.77 | 0.65 |
Fit values obtained by applying different double exponential models and mfD for two single cells expressing the tandems mCherry-EGFP and mTFP1-EYFP, respectively. The first model is used with a discrete fixed donor lifetime. The second model is used with free discrete lifetimes. The third model is used with a discrete fixed lifetime for the donor and a stretched approach for the FRET lifetime. The fourth model is mfD calculated from the mean lifetime (see Materials and Methods).
The analysis of the fluorescence decay profile utilizing discrete exponential components can be enlarged by considering different orientations for donor and acceptor, and thus a continuous distribution of possible τF values (Eq. S2 in the Supporting Material). The stretched exponential model takes into consideration a range of possible fluorophore environments that result in different intensity decays (37), or even different protein conformations that can produce a range of different lifetimes (24,38). We used a two-species model in which the donor lifetime was considered discrete (when using the stretched exponential, we found that β = 1, not fixed), whereas the FRET lifetime was “stretched” (13,37) corresponding to the distribution of the possible orientations for the FRET phenomenon. Fitting of the representative decays of mCherry-EGFP and mTFP1-EYFP was carried out using the stretched model (Table 2). For mCherry-EGFP, we found a long lifetime of 2.49 ns instead of the fixed value of 2.50 ns and a short lifetime of 1.01 ns instead of 1.10 ns. The normalized preexponential factors increased from 0.51 to 0.55. For mTFP1-EYFP, we found a long lifetime of 2.83 ns instead of the fixed value of 2.80 ns and a short lifetime of 1.02 ns instead of 1.14 ns. Here, the normalized preexponential factors increased dramatically, with a short lifetime contribution up to 0.93. A confidence-plot analysis of these two tandems shows that only mTFP1-EYFP presents a minimal χ2 as a function of β (the stretched exponent), which is not the case for mCherry-EGFP (Fig. S2). This suggests that the stretched analysis is an alternative only for mTFP1-EYFP. In this case, high fD values (close to one) are found using the stretched exponential approach, which raises questions regarding the occurrence and extent of a spectroscopic heterogeneity of the acceptor population and/or a certain distribution of the orientation between donors and acceptors.
Quantitative FRET by fast FLIM acquisition is improved by using mTFP1 as a donor
Fast acquisitions can be performed using the TriM-FLIM system. In a previous work (9), we were able to obtain quantitative information from the decrease in the donor mean lifetime by collecting only a few photons in very fast acquisition times. For comparison, fast acquisitions were performed in He-La cells expressing 1), mTFP1 alone or mTFP1-EYFP in tandem; or 2), EGFP alone or mCherry-EGFP in tandem. When multifocal multiphoton microscopy (TriMScope) is used, the choice of the parameters (e.g., the degree of parallelization and number of foci) depends on the saturation, photodamage, and available laser power (39). With EGFP used as a donor, the TriMScope was optimized using four beams at 940 nm (with a laser pulse of ∼100 fs and pulse frequency of 80 MHz). The average power at the exit of the objective was 150 mW. With these values, no photodamage or significant photobleaching was observed and a good signal/noise ratio was obtained, allowing acquisition of the five sequentially gated images in 15 s. Similarly, when mTFP1 was used as a donor, no photodamage or significant photobleaching was obtained with 16 beams at 830 nm (average power at the exit of the objective: 240 mW), and a signal/noise ratio comparable to that obtained with EGFP was measured. mTFP1 FLIM images were also measured in 15 s, and the results indicate that this donor can be used with the same reliability as EGFP in terms of fast acquisition.
Under the same conditions, we calculated the mean lifetime as a function of time for each experiment; a representative result is shown in Fig. 4. The time curves present the average mean lifetime obtained from identically sized regions of interest in each corresponding cell. The average mean lifetime diminution for mTFP1 alone compared to mTFP1-EYFP goes from 2.77 ± 0.03 ns (n = 5; each experiment is a time lapse of 20 acquisitions) for mTFP1 alone to 2.05 ± 0.05 ns (n = 5), whereas for EGFP alone compared to mCherry-EGFP, it goes from 2.45 ± 0.05 ns to 2.20 ± 0.04 ns (n = 5). The average mean lifetime diminution for the mTFP1-EYFP tandem corresponds to a minimal mean fraction of donor in interaction (mfD) of 0.65 ± 0.05 (n = 5), in accordance with an fD value of 0.71 ± 0.01 (n = 5; Table 1). This mean mfD value is two times larger than the mean mfD for the mCherry-EGFP tandem (0.33 ± 0.06, n = 5), as expected. Together, these results show that mTFP1 combined with EYFP is more suitable in terms of fD than the commonly used EGFP and red FP acceptor for quantitative FRET by fast FLIM acquisition.
Figure 4.

Stability of the mean lifetime during time-lapse measurement of the mCherry/EGFP and mTFP1/EYFP couple. Representative fast acquisitions of 15 s using the TriM-FLIM system are presented for the two couples. Identical regions of interest were chosen to calculate the average mean lifetime for each image of a time lapse of 20 acquisitions. The average mean lifetime for EGFP alone and mCherry-EGFP tandem was 2.45 and 2.23 ns, respectively (this decrease is stressed by the small arrow on the left-hand side of the graph). The average mean lifetime for the mTFP1alone and mTFP1-EYFP tandem was 2.71 and 2.08 ns, respectively (this decrease is stressed by the big arrow on the right-hand side of the graph).
To test the performance of mTFP1 in comparison with EGFP using fast FLIM with fusion proteins, we attached mTFP1 and EGFP to the histone H4. Using these constructs (EGFP-H4 and mTFP1-H4), separately expressed in live HEK293 cells, we performed very fast acquisitions (3 s for each stack of five time-gated images), and we observed that in the case of mTFP1-H4 there was some bleaching (Fig. 5 A). Fig. 5 A shows the intensity values for the first time-gated image of two representative and independent time-lapse experiments for EGFP-H4 and mTFP1-H4, respectively. Both intensity profiles began with similar intensity values (900 gray levels) and one can see that there is an intensity diminution as a function of time associated with the mTFP1-H4 experiment (intensity decreases from 900 gray levels to 780). In the case of EGFP-H4, no intensity diminution was observed. The experimental conditions for these experiments were the same as for the experiments with EGFP alone and mTFP1 alone. In the case of chromatin constituent protein (H4), an immobile protein, the diffusion is restricted and mTFP1 appears to have less-robust photostability than EGFP. We also calculated the mean lifetimes for each of the 100 acquisitions obtained in the previous time-lapse experiments (Fig. 5 B). A small decrease in the mean lifetime was seen for the mTFP1-H4 construct (from 2.63 to 2.53 ns), which may have been caused by the change in the signal/noise ratio produced by the small diminution in the intensity values as a function of time. This is because when the last time-gated images are too noisy and their intensity is close to zero, the calculated mean lifetime diminishes (according to the mathematical definition (9)).
Figure 5.

Photostability comparison between EGFP-H4 and mTFP1-H4. Upper panel: Intensity profile of EGFP-H4 and mTFP1-H4 determined in monotransfected cells using the TriM-FLIM. A 300 s time-lapse intensity profile (five time-gated images taken in 3 s) shows the photostability for mTFP1-H4 and EGFP-H4. Intensity values for mTFP1-H4 decrease as a function of time from 900 to 780 gray levels while EGFP-H4 remains constant. Lower panel: Mean lifetime values as a function of time for EGFP-H4 and mTFP1-H4. A small decrease in the mean lifetime is observed for mTFP1-H4 (from 2.63 to 2.53 ns) due to the diminution in the signal/noise ratio.
We have seen that fD determination is highly dependent on the model chosen. Therefore, the minimal fraction of donor in interaction (mfD) (9) is a reliable parameter for quantifying protein-protein interaction in living cells. This is especially relevant for studying spatiotemporal biological processes, since the mfD variation is directly related to the absolute variation in protein-protein interaction. Of interest, when the stretch model was used, fD was always minimal for β = 1, corresponding to a discrete exponential (data not shown). Since mfD is defined assuming a discrete double exponential model, this supports the use of a minimal fraction of donor in interaction. This is especially important in the context of fast acquisitions in which only a limited number of photons are collected (e.g., 100 per pixel) and therefore analyses based on fit are no longer possible. In this respect, we truly believe that mfD stands alone as a robust parameter for quantitative analysis.
Conclusions
We have shown that in quantitative FRET-FLIM experiments, the fraction of interacting donor is far from being one, even for ideal cases (e.g., intramolecular interactions with FRET standards). We have also proposed what to our knowledge is a new fluorophore couple (mTFP1-EYFP) for quantitative experiments and compared it with the most commonly used couple, EGFP-mCherry. We found that for highly dynamic systems, mTFP1-EYFP is the best couple—at least for highly mobile proteins, since no photo-induced changes are observed even during fast acquisitions and the mTFP1-EYFP couple gives higher fD values. However, when we compared H4-EGP with H4-mTFP1 (a biological example in which the fusion proteins are more immobile compared to EGFP and mTFP1 alone), we found that the fluorescence intensity of EGFP-H4 was more stable thorough time than that of mTFP1-H4. Together, these results indicate that mTFP1/EYFP is an attractive couple for quantitative FRET-FLIM experiments, but attention should be paid depending on the biological example under investigation. Finally, we stress the convenience of using mfD in biological applications because 1), it is more reliable than other fitting approaches; and 2), the relative mfD change as a function of time is equivalent to the absolute variation of protein-protein interaction as a function of time.
Supporting Material
Materials and methods, six equations, results, two figures, and references are available at http://www.biophysj.org/biophysj/supplemental/S0006-3495(09)01307-1.
Supporting Material
Acknowledgments
We thank Matthieu Sanial and Dr. Marie Jo Masse for technical assistance with the plasmid constructs. We also thank Aude Jobart-Malfait for technical assistance with the Leica DMIRE2, and Dr. Olivier Albagli and Dr. Sohail Ahmed for providing the plasmids mTFP1-mOrange and TdRed-EGFP, respectively. This work was performed at the Imaging Facilities Center of the Institut Jacques Monod.
This work was supported by the Fondation pour la Recherche Médicale, the Région Ile de France (Soutien aux Équipes Scientifiques pour l'Acquisition de Moyens Expérimentaux), the Groupement Entreprises Françaises Lutte Contre Cancer, the Centre National de la Recherche Scientifique (Action Concertée Incitative Biologie Cellulaire, Moléculaire et Structurale), the Association pour la Recherche sur le Cancer, and the Association Nationale pour le Recherche. S.P.-P. received a European Union predoctoral fellowship (Marie-Curie grant MRTN-CT-2005-019481).
Contributor Information
Sergi Padilla-Parra, Email: sergi_padilla@hotmail.com.
Maïté Coppey-Moisan, Email: coppey.maite@ijm.univ-paris-diderot.fr.
References
- 1.Förster T. Intermolecular energy migration and fluorescence. Ann. Phys. 1948;6:55–75. [Google Scholar]
- 2.Miyawaki A., Tsien R.Y. Monitoring protein conformations and interactions by fluorescence resonance energy transfer between mutants of green fluorescent protein. Methods Enzymol. 2000;327:472–500. doi: 10.1016/s0076-6879(00)27297-2. [DOI] [PubMed] [Google Scholar]
- 3.Verveer P.J., Wouters F.S., Reynolds A.R., Bastiaens P.I.H. Quantitative imaging of lateral ErbB1 receptor signal propagation in the plasma membrane. Science. 2000;290:1567–1570. doi: 10.1126/science.290.5496.1567. [DOI] [PubMed] [Google Scholar]
- 4.Wouters F.S., Verveer P.J., Bastiaens P.I. Imaging biochemistry inside cells. Trends Cell Biol. 2001;11:203–211. doi: 10.1016/s0962-8924(01)01982-1. [DOI] [PubMed] [Google Scholar]
- 5.Hope A., Christensen K., Swanson J.A. Fluorescence resonance energy transfer-based stoichiometry in living cells. Biophys. J. 2002;83:3652–3664. doi: 10.1016/S0006-3495(02)75365-4. [DOI] [PMC free article] [PubMed] [Google Scholar]
- 6.Emiliani V., Sanvitto D., Tramier M., Piolot T., Petrasek Z. Low intensity two-dimensional imaging of fluorescence lifetimes in living cells. Appl. Phys. Lett. 2003;83:2471–2473. [Google Scholar]
- 7.Neher R.A., Neher E. Applying spectral fingerprinting to the analysis of FRET images. Microsc. Res. Tech. 2004;64:185–195. doi: 10.1002/jemt.20078. [DOI] [PubMed] [Google Scholar]
- 8.Grant D.M., Elson D.S., Schimpf D., Dunsby C., Requejo-Isidro J. Optically sectioned fluorescence lifetime imaging using a Nipkow disc microscope and a tunable ultrafast continuum excitation source. Opt. Lett. 2005;30:3353–3355. doi: 10.1364/ol.30.003353. [DOI] [PubMed] [Google Scholar]
- 9.Padilla-Parra S., Audugé N., Coppey-Moisan M., Tramier M. Quantitative FRET analysis by fast acquisition time domain FLIM at high spatial resolution in living cells. Biophys. J. 2008;95:2976–2988. doi: 10.1529/biophysj.108.131276. [DOI] [PMC free article] [PubMed] [Google Scholar]
- 10.Domingo B., Sabariegos R., Picazo F., Llopis J. Imaging FRET standards by steady-state fluorescence and lifetime methods. Microsc. Res. Tech. 2007;70:1010–1021. doi: 10.1002/jemt.20509. [DOI] [PubMed] [Google Scholar]
- 11.Goedhart J., Vermeer J.E., Adjobo-Hermans M.J., van Weeren L., Gadella T.W. Sensitive detection of p65 homodimers using red-shifted and fluorescent protein-based FRET couples. PLoS One. 2007;2:e1011. doi: 10.1371/journal.pone.0001011. [DOI] [PMC free article] [PubMed] [Google Scholar]
- 12.Tramier M., Zahid M., Mevel J.C., Masse M.J., Coppey-Moisan M. Sensitivity of CFP/YFP and GFP/mCherry pairs to donor photobleaching on FRET determination by fluorescence lifetime imaging microscopy in living cells. Microsc. Res. Tech. 2006;11:933–942. doi: 10.1002/jemt.20370. [DOI] [PubMed] [Google Scholar]
- 13.Albertazzi L., Arosio D., Marchetti L., Ricci F., Beltram F. Quantitative FRET analysis with the EGFP-mCherry fluorescent pair. Photochem. Photobiol. 2009;85:287–297. doi: 10.1111/j.1751-1097.2008.00435.x. [DOI] [PubMed] [Google Scholar]
- 14.Yasuda R., Harvey C.D., Zhong H.N., Sobczyk A., van Aelst L. Supersensitive Ras activation in dendrites and spines revealed by two-photon fluorescence lifetime imaging. Nat. Neurosci. 2006;9:283–291. doi: 10.1038/nn1635. [DOI] [PubMed] [Google Scholar]
- 15.Peter M., Ameer-Beg S.M., Hughes M.K.Y., Keppler M.D., Prag S. Multiphoton-FLIM quantification of the EGFP-mRFP1 FRET pair for localization of membrane receptor-kinase interactions. Biophys. J. 2005;88:1224–1237. doi: 10.1529/biophysj.104.050153. [DOI] [PMC free article] [PubMed] [Google Scholar]
- 16.Delbarre E., Tramier M., Coppey-Moisan M., Gaillard C., Courvalin J.C. The truncated prelamin A in Hutchinson-Gilford progeria syndrome alters segregation of A-type and B-type lamin. Hum. Mol. Genet. 2006;15:1113–1122. doi: 10.1093/hmg/ddl026. [DOI] [PubMed] [Google Scholar]
- 17.Angelier N., Tramier M., Louvet E., Coppey-Moisan M., Savino T.M. Tracking the interactions of rRNA processing proteins during nucleolar assembly in living cells. Mol. Biol. Cell. 2005;16:2862–2871. doi: 10.1091/mbc.E05-01-0041. [DOI] [PMC free article] [PubMed] [Google Scholar]
- 18.Campbell R.E., Tour O., Palmer A.E., Steinbach P.A., Baird G.S. A monomeric red fluorescent protein. Proc. Natl. Acad. Sci. USA. 2002;99:7877–7882. doi: 10.1073/pnas.082243699. [DOI] [PMC free article] [PubMed] [Google Scholar]
- 19.Shaner N.C., Campbell R.E., Steinbach P.A., Giepmans B.N., Palmer A.E. Improved monomeric red, orange and yellow fluorescent proteins derived from Discosoma sp. red fluorescent protein. Nat. Biotechnol. 2004;22:1567–1572. doi: 10.1038/nbt1037. [DOI] [PubMed] [Google Scholar]
- 20.Hilesheim L.N., Chen Y., Muller J.D. Dual-color photon counting histogram analysis of mRFP1 and EGFP in living cells. Biophys. J. 2005;91:4273–4284. doi: 10.1529/biophysj.106.085845. [DOI] [PMC free article] [PubMed] [Google Scholar]
- 21.Ai H.W., Henderson J.N., Remington S.J., Campbell R.E. Directed evolution of a monomeric, bright and photostable version of Clavularia cyan fluorescent protein: structural characterization and applications in fluorescence imaging. Biochem. J. 2006;400:531–540. doi: 10.1042/BJ20060874. [DOI] [PMC free article] [PubMed] [Google Scholar]
- 22.Tramier M., Gautier I., Piolot T., Ravalet S., Kemnitz K. Picosecond-hetero-FRET microscopy to probe protein-protein interactions in live cells. Biophys. J. 2002;83:3570–3577. doi: 10.1016/S0006-3495(02)75357-5. [DOI] [PMC free article] [PubMed] [Google Scholar]
- 23.Kuwana E., Sevick-Muraca E.M. Fluorescence lifetime spectroscopy in multiply scattering media with dyes exhibiting multiexponential decay kinetics. Biophys. J. 2002;83:1165–1176. doi: 10.1016/S0006-3495(02)75240-5. [DOI] [PMC free article] [PubMed] [Google Scholar]
- 24.Lee K.C., Siegel J., Webb S.E., Lévêque-Fort S., Cole M.J. Application of the stretched exponential function to fluorescence lifetime imaging. Biophys. J. 2001;81:1265–1274. doi: 10.1016/S0006-3495(01)75784-0. [DOI] [PMC free article] [PubMed] [Google Scholar]
- 25.Benninger R.K.P., Hofmann O., McGinty J., Requejo-Isidro J., Munro I. Time-resolved fluorescence imaging of solving interactions in microfluidic devices. Opt. Express. 2005;13:6275–6285. doi: 10.1364/opex.13.006275. [DOI] [PubMed] [Google Scholar]
- 26.Villoing A., Ridhoir M., Cinquin B., Erard M., Alvarez L. Complex fluorescence of the cyan fluorescent protein: comparisons with the H148D variant and consequences for quantitative cell imaging. Biochemistry. 2008;47:12483–12492. doi: 10.1021/bi801400d. [DOI] [PubMed] [Google Scholar]
- 27.Becker W., Bergmann A., Hink M.A., König K., Benndorf K. Fluorescence lifetime imaging by time-correlated single-photon counting. Microsc. Res. Tech. 2004;63:58–66. doi: 10.1002/jemt.10421. [DOI] [PubMed] [Google Scholar]
- 28.Peyker A., Rocks O., Bastiaens P.I. Imaging activation of two Ras isoforms simultaneously in a single cell. ChemBioChem. 2005;6:78–85. doi: 10.1002/cbic.200400280. [DOI] [PubMed] [Google Scholar]
- 29.Palmer A.E., Giacomello M., Kortemme T., Hires S.A., Lev-Ram V. Ca2+ indicators based on computationally redesigned calmodulin-peptide pairs. Chem. Biol. 2004;13:521–530. doi: 10.1016/j.chembiol.2006.03.007. [DOI] [PubMed] [Google Scholar]
- 30.Subach F.V., Subach O.M., Gundorov I.S., Morozova K.S., Piatkevich K.D. Monomeric fluorescent timers that change color from blue to red report on celluar trafficking. Nat. Chem. Biol. 2009;5:118–126. doi: 10.1038/nchembio.138. [DOI] [PMC free article] [PubMed] [Google Scholar]
- 31.Los G.V., Encell L.P., McDougall M.G., Hartzell D.D., Karassina N. HaloTag: a novel labeling protein technology for cell imaging and protein analysis. ACS Chem. Biol. 2008;3:373–382. doi: 10.1021/cb800025k. [DOI] [PubMed] [Google Scholar]
- 32.Hendrix J., Flors C., Dedecker P., Hofkens J., Engelborghs Y. Dark states in monomeric red fluorescent proteins studied by fluorescence correlation and single molecule spectroscopy. Biophys. J. 2008;94:4103–4113. doi: 10.1529/biophysj.107.123596. [DOI] [PMC free article] [PubMed] [Google Scholar]
- 33.Eggeling C., Widengren J., Brand L., Schaffer J., Felekyan S. Analysis of photobleaching in single-molecule multicolor excitation and Förster resonance energy transfer measurements. J. Phys. Chem. A. 2006;110:2979–2995. doi: 10.1021/jp054581w. [DOI] [PubMed] [Google Scholar]
- 34.Qiang Dong G., McMillen D.R. Effects of protein maturation on the noise in gene expression. Phys. Rev. E. 2008;77:021908. doi: 10.1103/PhysRevE.77.021908. [DOI] [PubMed] [Google Scholar]
- 35.Shu X., Shaner N.C., Yarbrough C.A., Tsien R.Y., Remington S.J. Novel chromophores and buried charges control color in mFruits. Biochemistry. 2006;45:9639–9647. doi: 10.1021/bi060773l. [DOI] [PubMed] [Google Scholar]
- 36.Wu B., Chen Y., Müller J.D. Fluorescence fluctuation spectroscopy of mCherry in living cells. Biophys. J. 2009;96:2391–2404. doi: 10.1016/j.bpj.2008.12.3902. [DOI] [PMC free article] [PubMed] [Google Scholar]
- 37.Maliwal B.P., Kusba J., Lakowicz J.R. Fluorescence energy transfer in one dimension: frequency-domain fluorescence study of DNA-fluorophore complexes. Biopolymers. 1995;35:245–255. doi: 10.1002/bip.360350213. [DOI] [PubMed] [Google Scholar]
- 38.Alcala J.R. The effect of harmonic conformational trajectories on protein fluorescence and lifetime distributions. J. Chem. Phys. 1994;101:4578–4584. [Google Scholar]
- 39.Bewersdorf J., Pick R., Hell S.W. Multifocal multiphoton microscopy. Opt. Lett. 1998;23:655–657. doi: 10.1364/ol.23.000655. [DOI] [PubMed] [Google Scholar]
Associated Data
This section collects any data citations, data availability statements, or supplementary materials included in this article.