

Abstract
Although many membrane additives are known to modulate the activities of membrane proteins via perturbing the properties of lipid membrane, the underlying mechanism is often not precisely understood. In this study, we investigate the impact of asymmetrically incorporating single-tailed lysophosphatidylcholine (LPC) into a membrane bilayer using coarse-grained molecular dynamics simulations. Using a simple computational protocol designed to approximately mimic a micropipette setting, we show that asymmetric incorporation of LPC can lead to significant curvature in a bilayer. Detailed analysis of geometrical and mechanical properties (pressure profile) of the resulting mound structure indicates that the degree of pressure profile perturbation is determined not by the local curvature per se but by the packing of lipid headgroups (i.e., area-per-lipid). The findings help provide a concrete basis for understanding the activation mechanism of mechanosensitive channels by asymmetric incorporation of LPC into membrane patches in patch-clamp experiments. The calculated local pressure profiles are valuable to the construction of realistic membrane models for the analysis of mechanosensation in a continuum mechanics framework.
Introduction
It is increasingly realized that the function of membrane proteins can be modulated by physical properties of the membrane environment (1,2). In addition to striking examples of mechanosensitive channels (3–5), the activation properties of even a voltage-dependent potassium channel can vary greatly as functions of lipid composition and mechanical state of the membrane (6). As summarized in several recent review articles (1,2), such dependence can be semiquantitatively understood in terms of various membrane deformations coupled to the functional transitions in the membrane protein structure.
One interesting way to alter the physical properties of membrane is to introduce membrane additives. Unlike protein/peptide-based toxins, which often bind specifically to certain membrane proteins, most membrane additives are believed to function through modulating the mechanical (7) and/or geometrical properties of the membrane. For example, cholesterol and capsaicin are known to increase (8) and decrease, respectively, the bending modulus of lipid bilayer, which can be used to explain their concentration-dependent effects on sodium channel (9) and TRPV1 channel (10), respectively. As another set of remarkable examples, asymmetric incorporation of cone-shaped lipids (such as lysophosphatidylcholine (LPC)), into a membrane patch was shown to activate mechanosensitive channels in the absence of external surface tension (11); as shown in Fig. 1, depending on the shape of the channel, LPC needs to be incorporated into different leaflets of the membrane (12–14). Based on the pioneering studies of Cantor (15) and more recent analysis of pressure profile in a lipid bilayer (16), it has been speculated that the effects of LPC can be explained by the induced curvature and shifted pressure profile in the membrane. The precise form of the pressure profile after the asymmetric incorporation of LPC, however, is not known. Indeed, whether a locally high curvature is necessarily correlated to a large shift in the pressure profile that favors the gating transition of mechanosensitive channels is not clear and warrants an explicit analysis.
Figure 1.
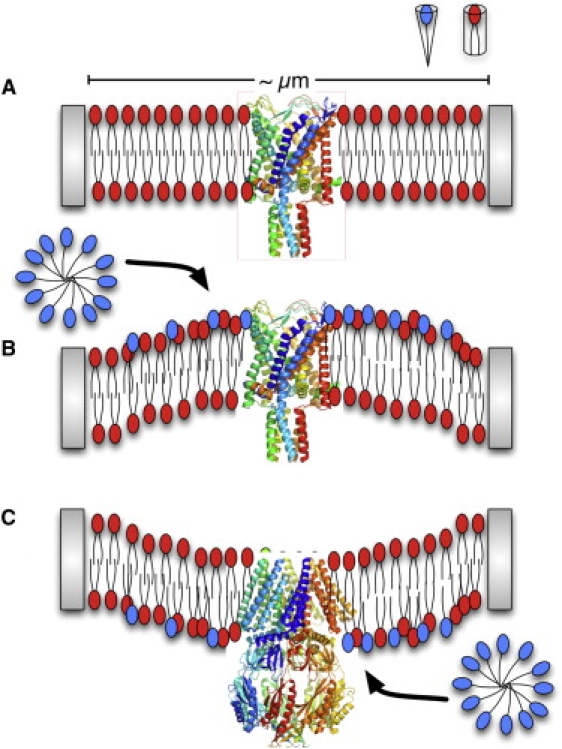
Schematic illustration of activation of mechanosensitive channels by asymmetric LPC incorporation into a membrane patch in a patch-clamp experiment. (A) A membrane-patch before LPC incorporation. (B and C) Asymmetric incorporations of LPC into different leaflets lead to activation of MscL (13) and MscS (13,14) due to the different locations of gate in the two channels.
Since the pressure profile varies significantly inside the bilayer, it is not straightforward to measure experimentally; this highlights the importance of computational studies. On the other hand, due to the collective nature of pressure tensor, computations of pressure profile require long simulations and a large system size. Therefore, there has only been a limited number of simulation studies on the subject (16), and the first study that explicitly considers nonplanar geometry of the membrane only appeared very recently (17), in which lipid vesicles are represented with the MARTINI force field at a coarse-grained level (18). Pressure profile analysis for a locally curved membrane due to membrane additives incorporation, however, has not been carried out. This is due in part to the difficulty of maintaining a stable curvature in the membrane using the typical system size of 10 nm with periodic boundary condition (PBC). For example, Meyer et al. (19) constructed a moundlike membrane structure surrounding MscL (20) in an all-atom MD simulation, which is the only simulation study that attempted to induce the gating of MscL by curvature. During the relatively short (∼10 ns) trajectory, however, they failed to introduce significant stress by curvature and did not observe any significant mechanical response in either MscL or the membrane. Moreover, the curvature constructed in their study should be considered transient because the curved membrane was built with a somewhat arbitrary shape that satisfies periodic boundary condition and LPC was inserted into both leaflets. In fact, activation of MscL by membrane curvature was not straightforward to describe even with continuum mechanics models (21–23). It is possible that some of the characteristics found in the continuum studies, such as the lack of activation due to membrane bending (22), reflect the oversimplified treatment of mechanical properties (pressure profile) of a curved membrane.
Here we report, to the best of our knowledge, the first explicit analysis of membrane curvature generation and pressure profile modulation by asymmetric incorporation of LPC into a bilayer. Specifically, we carry out molecular simulations using the MARTINI force field, which makes it possible to treat a sufficiently large system with extensive sampling. Similar to experimental studies, it is assumed that the timescale of flip-flop motion of lipids is slower than that of LPC-micelle incorporation, and therefore the level of asymmetry in the LPC distribution across the bilayer remains constant during the simulation. By confining the LPC molecules in a circular region (see Computational Methods), we circumvent the limitation of PBC and the simulations successfully lead to a stable curvature in the membrane. Analyses of pressure profiles in different locations of the curved membrane suggest that, somewhat unexpectedly, the highest degree of surface tension across the bilayer does not occur in the region of the highest local curvature. This result can be explained by the heterogeneous lipid distribution, especially headgroups, which highlights the importance of area-per-lipid, rather than the local curvature per se, to the local pressure profile. These findings provide a concrete basis for understanding the activation mechanism of mechanosensitive channels by asymmetric incorporation of lysolipids. The calculated local pressure profiles are valuable to the construction of more realistic models of membrane for continuum mechanics-based analysis of mechanosensation (22,24).
Computational Methods
In this section, we first summarize the key simulation parameters. Then, we describe the algorithms used to analyze the curvature and pressure profiles of the membrane.
Simulation setup
Coarse-grained molecular dynamics simulations at the coarse-grained level using the MARTINI force field (18,25) with different numbers of LPC molecules are prepared as summarized in Table S1 in the Supporting Material. A membrane patch large enough for observing a stable curvature (∼40 nm × 40 nm × 9 nm) is prepared by duplicating a preequilibrated 288 dipalmitoylphosphatidylcholine (DOPC) bilayer system. A specific number of DOPC lipids are randomly selected within a radius of 13 nm from the center in the upper monolayer and converted to 1-palmitoyl-deoxylysophosphatidylcholine by deleting a hydrocarbon tail; the same number of DOPC molecules are randomly chosen and removed from the lower monolayer to keep the same number of DOPC molecules in each monolayer. The final systems contain 144–480 LPC molecules in the upper monolayer, 1824 DOPC molecules in each monolayer, and 54,784 coarse-grained water beads. For reference, it has been reported (19) that the LPC/PC ratio in the experimental study of Perozo et al. (12) is close to be 1:3, although a precise measurement of LPC in the membrane patch in the micropipette was not available.
In the beginning of simulations, the area-per-lipid is ∼25% larger than the expected value because ∼20% lipid molecules are deleted during system setup. However, as soon as constant temperature-constant surface tension (NPγT with 300 K and 0 dyne/cm) simulations are initiated using the Berendsen scheme (26), the membrane shrinks in size and the expected area-per-lipid values are recovered within 10 ns of simulation without any damage in the membrane structure. The simulation box size converges to ∼35 nm × 35 nm × 10 nm in all cases except the LPC480 system, in which bilayer structure becomes metastable only after ∼150 ns. Thus a constant temperature-constant area (NPAT) simulation is carried out for the LPC480 system from 150 ns. Keeping a constant area is important in order to mimic the micropipette setting. An integration time step of 40 fs is used. Simulation time reported in this study has not been scaled by any factor, although a factor of ∼4 has been suggested in the literature (18).
To circumvent the limitation of PBC that inhibits curvature generation in a system of this size, LPC molecules are confined within a circle of 13 nm radius with a soft wall of harmonic potential (force constant of 10 kJ/mol/nm2) applied to their phosphate groups,
| (1) |
where r is the distance from the center projected onto the xy-plane and rc is 13 nm throughout the study. Another motivation of imposing this restraint is that we hope to simulate the situation of a patch-clamp experiment where a membrane patch is confined in a micropipette; the restraining potential approximately mimics the wall of the micropipette (see Results and Discussions for additional remarks). The wall potential is implemented into the pull module of the mdrun program in GROMACS 3.3.3 (27). With this algorithm, moundlike structures are formed (for a snapshot, see Fig. 2) within ∼50 ns and remain stable for the rest of ∼300 ns. To investigate whether the mound structure remains stable in the absence of the wall potential with PBC, the system that exhibits the highest degree of local curvature (LPC480, which contains 480 LPC molecules in the upper leaflet) is extended for an additional 1 μs of simulation with the wall potential turned off.
Figure 2.
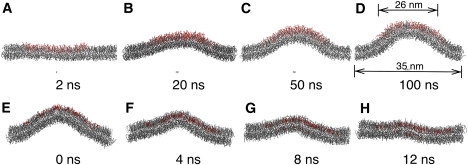
Snapshots from coarse-grained simulations that illustrate different impacts of LPC and cholesterol on the structure of a lipid bilayer. (A–D) Curvature generation observed for the LPC480 system. LPC and DOPC are colored in red and gray, respectively. In panel D, arrows at the top indicates the width of the cylindrical wall potential applied to the LPC lipids (Eq. 1); arrows at the bottom indicate the size of the simulation box. (E–H) Replacement of LPC with cholesterol (red) in the last frame of the LPC384 simulation leads to quick collapse of the membrane mound within 10 ns.
Finally, to compare the effect of LPC and cholesterol addition, the last snapshot of the LPC384 simulation is modified by replacing all LPC molecules with cholesterol. The system is then energy-minimized and simulated for 20 ns. As shown below, the mound structure quickly collapses within this relatively short period of time, highlighting the difference between LPC and cholesterol.
Monge representation of membrane surface
To describe the shape of the membrane, the Monge representation (28) of membrane surface is used. In general, any three-dimensional surface with single-valued height can be expressed by the Monge representation, h = h(x, y), from which geometric properties can be derived conveniently. For example, the mean (H) and Gaussian (K) curvatures are defined as
| (2) |
| (3) |
where subscripts indicate spatial derivatives (28–30). The area of a three-dimensional surface can also be calculated by scaling the area element in the xy-plane, dxdy, by the square root of the metric of the surface, ,
| (4) |
The membrane surfaces (or the membrane/water interfaces) are defined by the average position of phosphate groups in the two leaflets. In each saved frame phosphate groups are first grouped into a small cell (∼1 nm cube) in space. Then the cubes in direct contact are grouped as a surface. Two interfaces of a bilayer can be successfully defined using this method and the positions of phosphate groups that form each interface are stored in a separate file. Next, the interfaces in every frame are mapped to equally spaced grid points by choosing the nearest atom in the stored phosphate groups; the grid data are averaged over time to obtain a smooth surface. Finally, to obtain a surface with well-defined second derivatives, the three-dimensional surface is mapped to r-z space by binning along the radius r, where is the distance from the center of the restraining potential (Eq. 1). The value h = h(r) is then obtained by averaging z values in each bin. The curve is fitted to polynomials by using the Chebyshev approximation so that derivatives, dh/dr and d2h/dr2, are well defined (31). Given dh/dr and d2h/dr2, required derivatives in the Monge representation (Eqs. 2–4) can be calculated straightforwardly using chain rules.
Local pressure calculation
Since Hardy formulated the connection between atomistic simulation and stress/heat flow (32) based on the work of Irvin and Kirkwood (33), many researchers applied his formulation to systems (34) including biological membranes (16,35). After the division of the simulation system into cubic blocks, the local stress tensor can be calculated as
| (5) |
where (l, m, n) specifies a block, Vblock the volume of the block, mi mass of particle i, vi velocity of particle i, ⊗ a tensor product, Fij force on particle i due to particle j, rij = ri – rj and fl,m,n the localization function. The localization function is defined by the portion of the inter-particle (i, j) vector that overlaps with a specific block (Fig. 3). It does not change the total virial of the system, but simply provides a way to distributing a virial component from a pairwise interaction to each block. The local stress tensors can then be properly integrated to give the desired pressure profile along certain direction(s). When the membrane is significantly distorted from a planar geometry (e.g., in the presence of lysolipids; see Results and Discussion below), transformation of the local stress tensors in a lab frame to a local frame is needed to identify the locally lateral and normal pressure tensor components. For example, an arbitrary plane in Cartesian coordinates can be transformed to the local xy-plane by applying two rotations, first with respect to the z axis, R1, followed by another rotation along the azimuthal angle, R2. The total transformation matrix becomes
| (6) |
Figure 3.
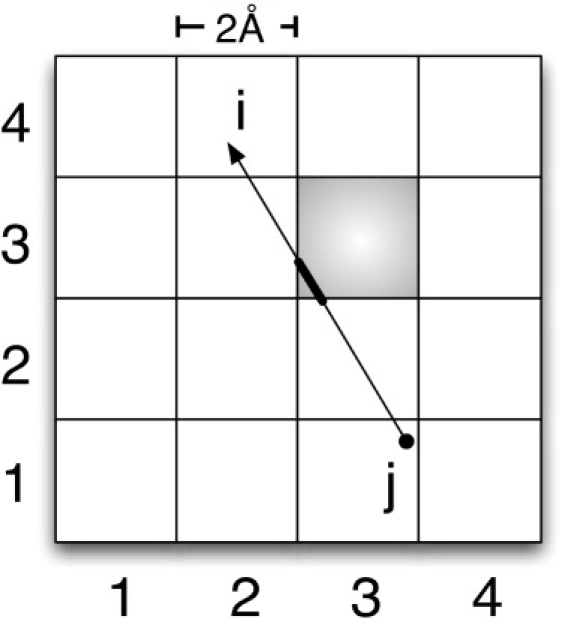
Schematic illustration of the localization function (fl,m,n in Eq. 5) used in the computation of local pressure tensor. The arrow denotes rij = ri – rj between particles i, j. Ratio of the thick line length to the total length rij defines the localization function for the shaded block.
Accordingly, the pressure tensor can be transformed as
| (7) |
For a locally planar membrane, the lateral pressure profile is defined by (36,37)
| (8) |
and the surface tension, τ, is given by
| (9) |
Local stress in a block is obtained by recalculating kinetic and virial components from saved velocities and positions every five steps, as given in Eq. 5. The system is divided into 150 × 150 × 50 blocks with the dimension of each block equal to ∼0.23 nm × 0.23 nm × 0.20 nm. The same nonbond (shift) scheme as in the MD simulations is used in the pressure tensor calculations. In calculating the local stress as a function of r, averages in four quadrants are calculated and their standard deviation is used to estimate the statistical error. Because of slight asymmetry of the mound structure (see below), pressure profiles from four quadrants are shifted so that positions of peaks coincide; such a shift does not change integrated quantities such as the surface tension.
Results and Discussions
In most of the following discussions, we focus on two sets of simulations with large numbers (384, 480) of LPC molecules incorporated into the upper leaflet. For comparison, a flat bilayer system with pure DOPC is used as the reference.
Geometrical properties: membrane curvature generation
As alluded to above, moundlike structures are formed (for a snapshot, see Fig. 2; see Fig. 4, B and C, for shape in the Monge representation) due to the asymmetric incorporation of LPC within ∼50 ns and remain stable for the rest of simulation. As shown in Fig. S1, the degree of curvature generation and therefore height and steepness of the mound increase as more LPC molecules are incorporated. These are qualitatively expected results and confirm the effectiveness of our simulation protocol. With 144 LPC molecules, which corresponds to ∼4% of total lipid molecules, the height is ∼1 nm; with 480 LPC, ∼12%, the height increases substantially to ∼7 nm. The thickness of the bilayer remains approximately constant throughout all simulations.
Figure 4.
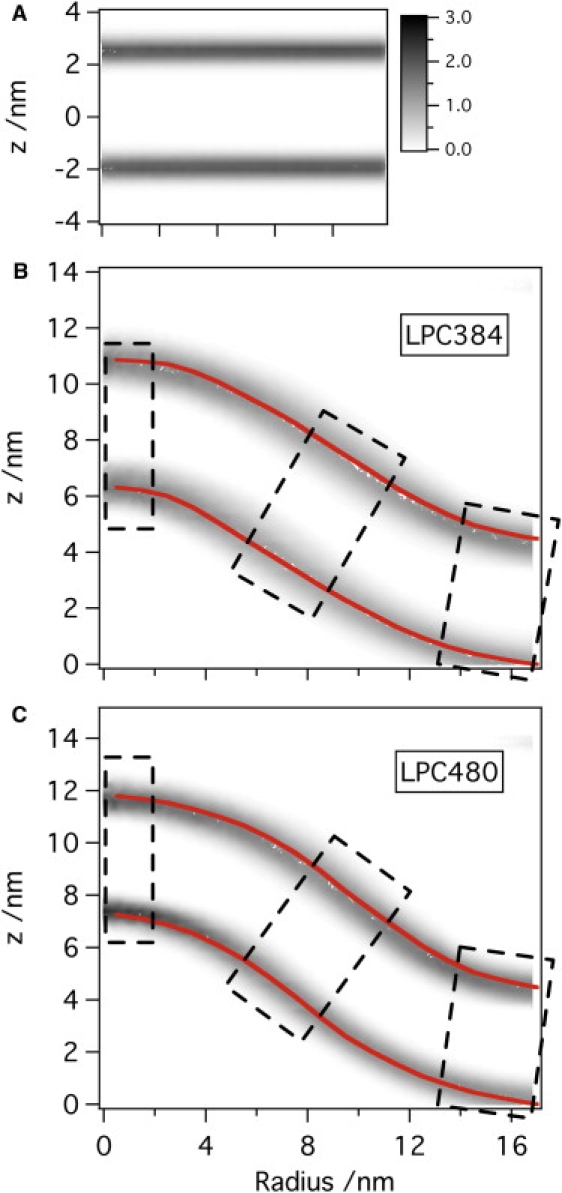
Number density of phosphate groups (number per nm3) from the last 100-ns simulations of (A) a flat bilayer containing 1152 DOPC molecules and (B) LPC384 and (C) LPC480 systems. For panels B and C, the shape of the mound is represented with h(r) in the cylindrical coordinate (for the shape of other LPC concentrations, see Fig. S1). The width of the distributions reflects thermal fluctuation of the membrane as well as axial asymmetry of the mound structure in panels B and C. The dotted boxes indicate locations at which local pressure profiles are calculated (see Fig. 6).
Additional geometrical properties for the mound are calculated based on Eqs. 2–4 and shown for two cases (LPC384 and LPC480) in Fig. S2. The results indicate that the mounds approximately satisfy the expected boundary conditions as r approaches the onset of the wall potential (rc = 13 nm); i.e., all geometric factors approach those for a flat bilayer at r > 16 nm. This is the expected behavior of a membrane patch inside a micropipette in which the membrane boundary is nearly perpendicular to the pipette wall. Note that the concentration of LPC actually drops to zero only at r ∼16 nm due to the relatively weak force constant for the wall potential (see below).
Area of leaflets and the number of lipid molecules in a unit area are key determinants of mechanics in the membrane. Increases in area of the upper and lower interfaces relative to a flat bilayer can be obtained by integration following Eq. 4 (Fig. S2, B and F). Integration up to r = 16 nm gives 895 and 881 nm2 for the upper and lower monolayers of the LPC384 system, respectively, which corresponds to an increase by 91 nm2 (∼11%) and 74 nm2 (∼9%), respectively, compared to a flat bilayer. For LPC480, the corresponding increases are 113 nm2 (∼14%) and 102 (∼13%) nm2, respectively. In addition, the assumption that the number of double-tailed lipids in both leaflets remain constant in the micropipette even after the asymmetric introduction of LPC can be tested by counting the number of DOPC lipids within r = 16 nm. Integration of phosphate number density (shown in Fig. 5) up to 16 nm gives 1230 and 1333 DOPC lipids in the upper and lower monolayers, respectively, for the LPC384 system, and 1228 and 1337, respectively, for the LPC480 system. Therefore, the lower leaflet in both cases contains ∼8% more DOPC lipids than the upper one and this discrepancy reflects limitation of a simple wall potential that applies only to LPC. In this simulation, the region with extra DOPC lipids, r > 16 nm, acts as a lipid reservoir that can relieve stress in the upper leaflet by making it less dense. A more realistic solid wall can help simulate the micropipette environment more faithfully, although the precise nature of membrane-micropipette interface is not well understood; this is being investigated using atomistic simulations (J. Yoo, unpublished).
Figure 5.
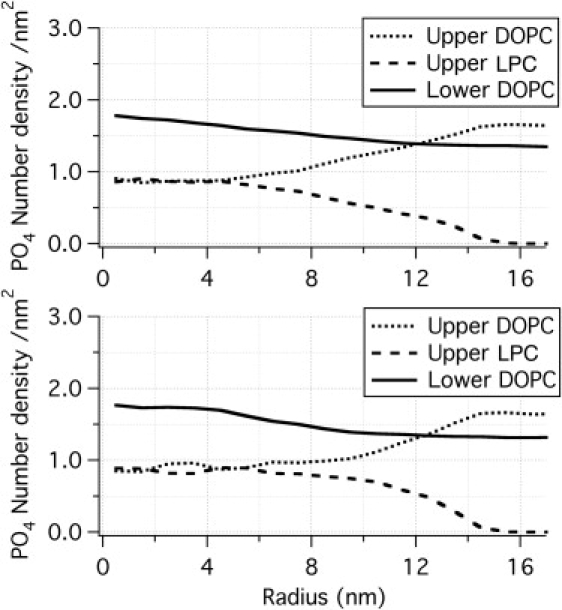
Number densities of various phosphate groups (averaged over last 100 ns and over z for each leaflet surface) in LPC384 (top) and LPC480 (bottom) systems as functions of r. Note that the LPC and DOPC densities in the upper leaflet converge to similar values at small r regardless of the number of inserted LPC molecules.
As shown in Fig. S2, C and G, the mean curvature reaches maximum (∼–0.10) near the top of the mound at r ∼0 in both LPC384 and LPC480 systems and decreases largely in a monotonic fashion as r increases. Similar trends are observed for the Gaussian curvature (Fig. S2, D and H), which becomes only slightly negative at large r values. We expect that the magnitude of curvature is closely related to the local concentration of LPC (Fig. 5); the higher the local LPC concentration, the higher the local curvature. Phosphate number density shows a plateau at ∼0.9/nm2 near the top of the mound structure for both DOPC and LPC in both LPC384 and LPC480 systems. The plateau region is broader in the LPC480 system than that in LPC384 while the maximum local LPC concentration is approximately the same. This observation indicates that the local DOPC/LPC ratio is saturated to 1:1 and membranes with higher local LPC concentration might be unstable (otherwise higher local density variation is expected between LPC480 and LPC384).
Thermal fluctuation and axial asymmetry of the curved membrane
In Fig. 4, B and C, the number density (number/nm3) of phosphate group in the r-z space is shown for the LPC384 and LPC480 systems. For comparison, the number density from a flat bilayer consisting of 1152 DOPC lipids is shown in Fig. 4 A with the same grayscale. The phosphate group density of the curved membrane is notably more broadly distributed than that of a flat bilayer, which should not be interpreted as implying that a curved membrane has higher flexibility in the direction of local surface normal. The broader distribution has significant contribution from the thermal fluctuation of the mound structure in the r direction (see Movie S1 in the Supporting Material) and the instantaneous axial asymmetry of the mound. The magnitude of these contributions can be qualitatively witnessed by error bars associated with the r-z profile, which are shown for the LPC480 system in Fig. S1. These variations in the mound structure have notable impact on the calculated pressure profiles, which we turn to next.
Pressure profile and surface tension variations
To investigate variation of pressure profiles with respect to location in the mound structure, local pressure profile as a function of the local membrane normal is calculated in three regions indicated by the dotted boxes in Fig. 4, B and C. As shown in Fig. 6, the local pressure profile is asymmetric for all three locations in the mounds, including the region with a low degree of local curvature (e.g., r ∼ rc). In general, pressure profiles in the lower leaflets are shifted downward relative to those in the upper leaflets, which is indicative of a larger surface tension in the lower leaflet than in the upper one. As noted above, pressure profiles are sensitive to both axial asymmetry and thermal fluctuations of the mound structure (Fig. 4). As a result, the pressure profiles at r = 8 and 15 nm in both LPC384 and LPC480 systems show significant contractions in both negative peaks by headgroups and positive peaks by hydrocarbon groups. Therefore, instead of discussing the magnitude of shifts in the pressure profile in detail, we compare local surface tension, which is not sensitive to these structural features of the membrane.
Figure 6.
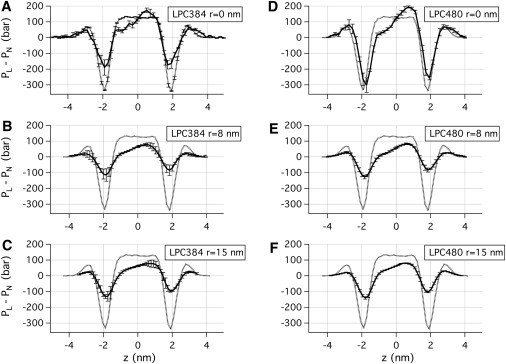
Local pressure profiles calculated at three different locations (indicated by dotted boxes in Fig. 4) for the last 30 ns of LPC384 (A–C) and LPC480 (D–F) systems. For comparison, the pressure profile for a flat bilayer (1152 DOPC lipids) is overlaid as a dotted line. Note that the pressure profiles are affected by the thermal fluctuation and axial asymmetry of the mound structure, thus surface tensions (Table 1) are more useful for quantitative discussions. The error bars are based on differences between calculated pressure profiles in four quadrants. Also see the Supporting Material for a comparison to flat bilayers with symmetric and asymmetric LPC incorporations.
Surface tension in each monolayer can be calculated from the pressure profiles (Eq. 9), and are summarized for the LPC384 and LPC480 systems in Table 1. Overall, both total, τtotal, and monolayer surface tension, τmono, increase as r increases. For the LPC480 system, for example, the largest surface tension is observed at r = 15 nm, which is 6.0 dyne/cm for the lower leaflet and 0.7 dyne/cm across the bilayer. At r = 0 nm, where a high degree of local curvature is observed, surface tension in the lower leaflet and across the bilayer is 7.5 and −5.3 dyne/cm, respectively. The most interesting feature is that everywhere in both the LPC384 and LPC480 systems the monolayer surface tensions, τmono, are positive (i.e., indicating dilation) for the lower leaflet and negative (i.e., indicating compression) for the upper one; the only exception is the slightly negative value of –0.1 dyne/cm observed at r = 0 nm in the lower leaflet of the LPC384 system. Significant dependence of surface tension on the number of LPC is observed only at r = 0 nm. As shown in Table 1, both total and lower-leaflet surface tensions are larger than those in LPC384 by ∼6–7 dyne/cm at r = 0 nm.
Table 1.
Key local properties (mean curvature, area-per-lipid, and surface tension) of a curved bilayer at different locations (r) after asymmetric LPC incorporation into the upper leaflet
| System | LPC384 | LPC480 | |||||||||||
|---|---|---|---|---|---|---|---|---|---|---|---|---|---|
| r(nm) | 0 | 8 | 15 | 0 | 8 | 15 | |||||||
| Hmono(nm−1) (Eq. 2) | −0.09 | −0.15 | −0.04 | −0.02 | 0.03 | 0.01 | −0.06 | −0.09 | −0.06 | −0.03 | 0.03 | 0.01 | |
| −0.01 | −0.11 | −0.02 | −0.01 | −0.07 | 0.06 | 0.01 | −0.10 | −0.02 | 0.01 | −0.07 | 0.08 | ||
| τmono (dyne/cm) | −11.1 | −0.1 | −3.9 | 3.2 | −4.1 | 4.7 | −12.8 | 7.5 | −5.6 | 5.1 | −4.2 | 6.0 | |
| τtotal (dyne/cm) | −11.2 | −0.8 | 0.6 | −5.3 | −0.5 | 0.7 | |||||||
The value r = 0 corresponds to the top of the mound structure. In the case of monolayer properties, the two numbers are for the upper and lower leaflets, respectively. Area-per-lipid is measured relative to corresponding values of a flat bilayer.
Because the pressure profile is expected to be closely related to the lipid density, variation of area-per-lipid (based on the phosphate group) and hydrocarbon number density along r for the upper/lower leaflets are calculated and shown in Figs. 7 and 8, respectively. It is clear that the area-per-lipid variation is different between the two leaflets. For the upper leaflet, the area-per-lipid (averaged over both DOPC and LPC) is always smaller than that in a flat bilayer (i.e., indicating compression). For the lower leaflet, on the other hand, although the area-per-lipid is also smaller than that in a flat bilayer at r < 8 nm, the value becomes larger at r > 8 nm; in fact, for r ∼ rc, the area-per-lipid is almost 0.1 nm2 larger than the value for a flat bilayer (i.e., indicating dilation), which corresponds to a relative increase of ∼(0.1:0.67) ∼15%! In other words, the distributions of phosphate groups in the lower leaflet at r ∼0 nm and r ∼16 nm differ by as much as (0.2:0.67) ∼30%. This significant asymmetry in the area-per-lipid for the two leaflets explains the observation that slightly positive net surface tension occurs at large r instead of at large curvature (r ∼0). Although the observed area-per-lipid predicts positive net surface tension at large r, the calculated values are only marginally larger than zero, due presumably to the axial asymmetry and thermal fluctuations discussed above; e.g., the results can be compared to those for a flat bilayer with asymmetric LPC incorporation (see Fig. S3, which shows similar trends but the asymmetry in the pressure profile is more distinct due to the lack of shape inhomogeneity).
Figure 7.
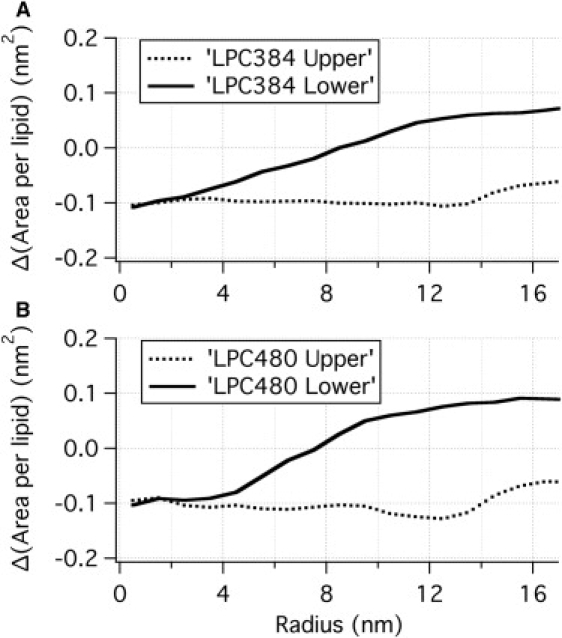
Deviation of area-per-lipid (based on phosphate group) from that of a flat DOPC bilayer (0.67 nm2) for the (A) LPC384 and (B) LPC480 systems. Note that a positive value indicates dilation and a negative value indicates compression. The results are consistent with the large pressure-profile mismatch observed at large r (Fig. 6 and Table 1).
Figure 8.
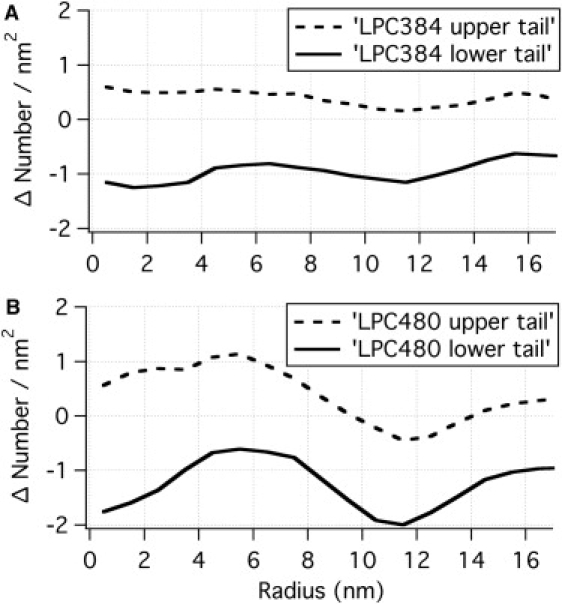
Deviation of hydrocarbon number density from that of a flat DOPC bilayer (14.9/nm2). Here a positive value indicates compression and a negative value indicates dilation (opposite to Fig. 7). Note that the hydrocarbon number density appears much more uniform compared to the distribution of phosphate groups shown in Fig. 7.
The distribution of hydrocarbon tails is qualitatively similar to that of the phosphate groups; i.e., hydrocarbon region of the upper leaflet experiences compression at all (r) positions while that of the lower one experiences dilation. However, unlike the significant variation found for the distribution of phosphate groups (especially in the lower leaflet, see Fig. 7), the hydrocarbon packing is more uniform across different regions (r values), even in a highly curved membrane. As shown in Fig. 8, even for the LPC480 case, the variation is only ∼7% for both leaflets. These observations suggest that the headgroups are adjusted according to the local curvature to satisfy the optimal and nearly uniform packing of lipid tails.
Implication to the gating of mechanosensitive channels
The pressure profiles (Fig. 6) and surface tensions (Table 1) from the current study reveal that upon asymmetric LPC incorporation, a high degree of compression occurs in the upper leaflet while a high degree of dilation occurs in the lower leaflet. This pattern is consistent with the experimental observation that asymmetric LPC incorporation is capable of activating MscL (13), in which the gate(s) lies in the lower half of the channel where hydrophobic residues from transmembrane helices are tightly packed against each other (5). For MscS, due to the different packing pattern of the transmembrane helices, the gate occurs in the upper half of the channel, thus LPC needs to be incorporated to the lower (cytoplasmic) leaflet (14). Patterns in the calculated pressure profile from our study are consistent with this difference between MscL and MscS activation.
Recently Ollila et al. reported calculated pressure profile in a pure DOPC vesicle system (17) using the same MARTINI force field. Similar to the results reported above, an asymmetric local pressure profile across the bilayer and a negative mean curvature was also observed. However, the directionality for the asymmetry is opposite to that found here: compression in the lower (inner) leaflet and dilation in the upper (outer) leaflet. This pattern would imply that MscL activation is difficult in the vesicle system studied by Ollila's group (17), which, in fact, is qualitatively consistent with experimental observation (13). On the other hand, we note that the pressure profile is sensitive to the number of lipid molecules in each leaflet relative to a flat bilayer. The results found in Ollila et al. (17) might be a result of using more lipids in the inner leaflet than a fully equilibrated (in terms of lipid exchange between leaflets) state. Systematic analysis with different numbers of lipids in each monolayer can be valuable.
Experimentally, Farge and Devaux (38) and Traïkia et al. (39) studied asymmetric incorporation of LPC to the outer monolayer of small unilamellar vesicles (SUVs) and large unilamellar vesicles (LUVs) using 31P NMR spectroscopy. It is noteworthy that SUVs and LUVs were found to respond differently to the stress induced by asymmetric incorporation of LPC. Because SUVs tend to maintain spherical geometry due to their small size, their volume and radius were observed to increase to minimize compression in the outer leaflet while the inner leaflet was found to undergo slight dilation; these trends are reminiscent of our results for a bilayer. By contrast, LUVs were found to change their geometry (e.g., elongation) until stress (compression) is equalized in both leaflets. These discussions highlight the importance of membrane geometry (e.g., vesicle versus micropipette) in the context of studying mechanosensation and the unique ease in precisely (at least qualitatively) modulating mechanical properties of membrane with asymmetric LPC incorporation in a patch-clamp setting.
Effect of cholesterol and wall potential
When LPCs are replaced by cholesterol molecules (which are also subjected to the wall potential), the mound structure quickly collapses and the membrane becomes flat again in as short as ∼10 ns (see Fig. 2, E–H, also Movie S2). Even though some of cholesterol molecules are observed to move to the other leaflet during the collapse, which is consistent with the low barrier for cholesterol exchange between lipid leaflets (40,41), the upper leaflets still has significantly more cholesterol than the lower one by the end of simulation. Therefore, the difference between LPC and cholesterol in inducing membrane curvature lies in the difference between their geometrical shape, which is known to be important in determining the local curvature propensity of membranes (1,30).
Regarding the importance of the wall potential, the mound structure in the LPC480 system remains stable for 1 μs after the wall potential is removed. While LPCs at the perimeter are observed to escape to r > 16 nm, no significant collapse of the mound structure is observed. The geometrical properties also remain reasonably similar, although the mound structure becomes more axially asymmetric as reflected by the larger error bars in the r–z profile (Fig. S4). This shows that the wall potential, which is introduced to mimic the micropipette environment, indeed stabilizes the mound structure. Significant changes in the lipid distributions (especially for LPC) over the 1 μs simulation (Fig. S5) indicates that the mound structure is likely to disappear in the absence of the wall potential at very long timescale. The important point for the purpose of this study is that qualitative trends in the geometrical and mechanical properties do not seem to rely sensitively on the magnitude of the restraint once the mound structure is formed.
Conclusions
An emerging theme in the study of membrane proteins is that the membrane environment, once considered only a passive cellular component, can play a highly active role in dictating these proteins' structure and/or activity (1,2). Therefore, it is important to understand how the structural and mechanical properties of membrane are affected by various perturbations; variations in the mechanical properties, such as pressure profile, are expected to have a major impact on the activities of membrane proteins. Although structural perturbations in membrane can often be predicted based on relatively straightforward arguments, it is generally more difficult to predict changes in mechanical properties. This is one of the reasons that the effects of many membrane additives on membrane properties, and therefore on the activity of membrane proteins, remain poorly understood.
The value of molecular simulations in this context is illustrated here with a study of asymmetric LPC incorporation into membrane bilayers. Using a simple computational protocol designed to approximately mimic a micropipette setting, coarse-grained molecular dynamics simulations have successfully generated stable curvature in a DOPC bilayer upon asymmetric LPC incorporation. Although there are limitations in both the accuracy of the coarse-grained force field and the protocol that mimics the micropipette setting, the qualitative trends observed in our work are expected to be valid since the physical principles that govern membrane shape and mechanics (28,30,36) are not sensitive to fine details. The most interesting finding that emerges from detailed analyses of the geometrical and mechanical properties of the mound structures is that large variation in the local pressure profile is dictated not by local curvature per se, but rather by the packing of phosphate groups (i.e., area-per-lipid). Moreover, the asymmetry in the local pressure profiles is qualitatively different from past observations made for lipid vesicles (17,38,39), which further highlights the importance of system geometry when discussing the effects of membrane additives on membrane properties.
The trends in the pressure profiles and surface tensions observed in this study can qualitatively explain experimental observations that asymmetric LPC incorporation into different leaflets of a membrane patch in a patch-clamp setting led to activation of MscL and MscS (12–14). In future studies, it is interesting to investigate whether the qualitative trends in pressure profile are significantly changed by the presence of membrane proteins. Moreover, it is exciting to explore whether incorporating heterogeneous pressure profiles from particle-based simulations into a continuum mechanics framework can lead to qualitative differences in the predicted gating behaviors of mechanosensitive channels compared to previous studies (22,23).
Supporting Material
One table, five figures, and two movies are available at http://www.biophysj.org/biophysj/supplemental/S0006-3495(09)01313-7.
Supporting Material
Acknowledgments
Computational resources from the National Center for Supercomputing Applications at the University of Illinois and the Center of High Throughput Computing at UW-Madison are greatly appreciated.
The research has been supported by the National Institutes of Health (grant No. R01-GM071428).
References
- 1.Andersen O.S., Koeppe R.E. Bilayer thickness and membrane protein function: an energetic perspective. Annu. Rev. Biophys. Biomol. Struct. 2007;36:107–130. doi: 10.1146/annurev.biophys.36.040306.132643. [DOI] [PubMed] [Google Scholar]
- 2.Phillips R., Ursell T., Wiggins P., Sens P. Emerging roles for lipids in shaping membrane-protein function. Nature. 2009;459:379–385. doi: 10.1038/nature08147. [DOI] [PMC free article] [PubMed] [Google Scholar]
- 3.Perozo E. Gating prokaryotic mechanosensitive channels. Nat. Rev. Mol. Cell Biol. 2006;7:109–119. doi: 10.1038/nrm1833. [DOI] [PubMed] [Google Scholar]
- 4.Kung C. A possible unifying principle for mechanosensation. Nature. 2005;436:647–654. doi: 10.1038/nature03896. [DOI] [PubMed] [Google Scholar]
- 5.Anishkin A., Sukharev S. State-stabilizing interactions in the bacterial mechanosensitive channel gating and adaptation. J. Biol. Chem. 2009 doi: 10.1074/jbc.R109.009357. In press. [DOI] [PMC free article] [PubMed] [Google Scholar]
- 6.Schmidt D., MacKinnon R. Voltage-dependent K+ channel gating and voltage sensor toxin sensitivity depend on the mechanical state of the lipid membrane. Proc. Natl. Acad. Sci. USA. 2008;105:19276–19281. doi: 10.1073/pnas.0810187105. [DOI] [PMC free article] [PubMed] [Google Scholar]
- 7.Lundbaek J.A. Regulation of membrane protein function by lipid bilayer elasticity—a single molecule technology to measure the bilayer properties experienced by an embedded protein. J. Phys. Condens. Matter. 2006;18:S1305–S1344. doi: 10.1088/0953-8984/18/28/S13. [DOI] [PubMed] [Google Scholar]
- 8.Needham D., Nunn R.S. Elastic deformation and failure of lipid bilayer membranes containing cholesterol. Biophys. J. 1990;58:997–1009. doi: 10.1016/S0006-3495(90)82444-9. [DOI] [PMC free article] [PubMed] [Google Scholar]
- 9.Lundbaek J.A., Bim P., Hansen A.J., Sogaard R., Nielsen C. Regulation of sodium channel function by bilayer elasticity: the importance of hydrophobic coupling. effects of micelle-forming amphiphiles and cholesterol. J. Gen. Physiol. 2004;123:599–621. doi: 10.1085/jgp.200308996. [DOI] [PMC free article] [PubMed] [Google Scholar]
- 10.Lundbaek J.A., Birn P., Tape S.E., Toombes G.E.S., Sogaard R. Capsaicin regulates voltage-dependent sodium channels by altering lipid bilayer elasticity. Mol. Pharm. 2005;68:680–689. doi: 10.1124/mol.105.013573. [DOI] [PubMed] [Google Scholar]
- 11.Perozo E., Rees D.C. Structure and mechanism in prokaryotic mechanosensitive channels. Curr. Opin. Struct. Biol. 2003;13:432–442. doi: 10.1016/s0959-440x(03)00106-4. [DOI] [PubMed] [Google Scholar]
- 12.Perozo E., Cortes D.M., Sompornpisut P., Kloda A., Martinac B. Open channel structure of MscL and the gating mechanism of mechanosensitive channels. Nature. 2002;418:942–948. doi: 10.1038/nature00992. [DOI] [PubMed] [Google Scholar]
- 13.Perozo E., Kloda A., Cortes D.M., Martinac B. Physical principles underlying the transduction of bilayer deformation forces during mechanosensitive channel gating. Nat. Struct. Biol. 2002;9:696–703. doi: 10.1038/nsb827. [DOI] [PubMed] [Google Scholar]
- 14.Vásquez V., Sotomayor M., Cordero Morales J., Schulten K., Perozo E. A structural mechanism for MscS gating in lipid bilayers. Science. 2008;321:1210–1214. doi: 10.1126/science.1159674. [DOI] [PMC free article] [PubMed] [Google Scholar]
- 15.Cantor R.S. Lateral pressures in cell membranes: a mechanism for modulation of protein function. J. Phys. Chem. B. 1997;101:1723–1725. [Google Scholar]
- 16.Gullingsrud J., Schulten K. Lipid bilayer pressure profiles and mechanosensitive channel gating. Biophys. J. 2004;86:3496–3509. doi: 10.1529/biophysj.103.034322. [DOI] [PMC free article] [PubMed] [Google Scholar]
- 17.Ollila O.H.S., Risselada H.J., Louhivuori M., Lindahl E., Vattulainen I. 3D pressure field in lipid membranes and membrane-protein complexes. Phys. Rev. Lett. 2009;102:078101. doi: 10.1103/PhysRevLett.102.078101. [DOI] [PubMed] [Google Scholar]
- 18.Marrink S.J., Risselada H.J., Yefimov S., Tieleman D.P., de Vries A.H. The MARTINI force field: coarse grained model for biomolecular simulations. J. Phys. Chem. B. 2007;111:7812–7824. doi: 10.1021/jp071097f. [DOI] [PubMed] [Google Scholar]
- 19.Meyer G.R., Gullingsrud J., Schulten K., Martinac B. Molecular dynamics study of MscL interactions with a curved lipid bilayer. Biophys. J. 2006;91:1630–1637. doi: 10.1529/biophysj.106.080721. [DOI] [PMC free article] [PubMed] [Google Scholar]
- 20.Chang G., Spencer R.H., Lee A.T., Barclay M.T., Rees D.C. Structure of the MscL homolog from Mycobacterium tuberculosis: a gated mechanosensitive ion channel. Science. 1998;282:2220–2226. doi: 10.1126/science.282.5397.2220. [DOI] [PubMed] [Google Scholar]
- 21.Wiggins P., Phillips R. Membrane-protein interactions in mechanosensitive channels. Biophys. J. 2005;88:880–902. doi: 10.1529/biophysj.104.047431. [DOI] [PMC free article] [PubMed] [Google Scholar]
- 22.Tang Y., Cao G., Chen X., Yoo J., Yethiraj A. A finite element framework for studying the mechanical response of macromolecules: application to the gating of the mechanosensitive channel MscL. Biophys. J. 2006;91:1248–1263. doi: 10.1529/biophysj.106.085985. [DOI] [PMC free article] [PubMed] [Google Scholar]
- 23.Tang Y., Yoo J., Yethiraj A., Cui Q., Chen X. Gating mechanisms of mechanosensitive channels of large conductance. II. Systematic study of conformational transitions. Biophys. J. 2008;95:581–596. doi: 10.1529/biophysj.107.128496. [DOI] [PMC free article] [PubMed] [Google Scholar]
- 24.Chen X., Cui Q., Tang Y.Y., Yoo J., Yethiraj A. Gating mechanisms of mechanosensitive channels of large conductance. I. A continuum mechanics-based hierarchical framework. Biophys. J. 2008;95:563–580. doi: 10.1529/biophysj.107.128488. [DOI] [PMC free article] [PubMed] [Google Scholar]
- 25.Monticelli L., Kandasamy S., Periole X., Larson R., Tieleman D.P. The MARTINI coarse-grained force field: extension to proteins. J. Chem. Theory Comput. 2008;4:819–834. doi: 10.1021/ct700324x. [DOI] [PubMed] [Google Scholar]
- 26.Berendsen H.J.C., Postma J.P.M., Van Gunsteren W.F., Dinola A., Haak J.R. Molecular dynamics with coupling to an external bath. J. Chem. Phys. 1984;81:3684–3690. [Google Scholar]
- 27.Van Der Spoel D., Lindahl E., Hess B., Groenhof G., Mark A.E. GROMACS: fast, flexible, and free. J. Comput. Chem. 2005;26:1701–1718. doi: 10.1002/jcc.20291. [DOI] [PubMed] [Google Scholar]
- 28.Safran S.A. Addison-Wesley; New York: 1994. Statistical Thermodynamics of Surfaces, Interfaces, and Membranes, Vol. 60. [Google Scholar]
- 29.Kühnel W. American Mathematical Society; Providence, RI: 2006. Differential Geometry: Curves, Surfaces, Manifolds. [Google Scholar]
- 30.Boal D. Cambridge University Press; Cambridge, UK: 2002. Mechanics of the Cell. [Google Scholar]
- 31.Press W.H., Teukolsky S.A., Vetterling W.T., Flannery B.F. 3rd Ed. Cambridge University Press; Cambridge, UK: 2007. Numerical Recipes: The Art of Scientific Computing. [Google Scholar]
- 32.Hardy R.J. Formulas for determining local properties in molecular-dynamics simulations: shock waves. J. Chem. Phys. 1982;76:622–628. [Google Scholar]
- 33.Irving J.H., Kirkwood J.G. The statistical mechanical theory of transport processes. IV. The equations of hydrodynamics. J. Chem. Phys. 1950;18:817–829. [Google Scholar]
- 34.Zimmerman J.A., Webb E.B., Hoyt J.J., Jones R.E., Klein P.A. Calculation of stress in atomistic simulation. Model. Simul. Mater. Sci. Eng. 2004;12:S319–S332. [Google Scholar]
- 35.Lindahl E., Edholm O. Spatial and energetic-entropic decomposition of surface tension in lipid bilayers from molecular dynamics simulations. J. Chem. Phys. 2000;113:3882–3893. [Google Scholar]
- 36.Barrat J.L., Hansen J.-P. Cambridge University Press; Cambridge, UK: 2003. Basic Concepts for Simple and Complex Liquids. [Google Scholar]
- 37.Klauda J.B., Venable R.M., MacKerell A.D., Pastor R.W. Considerations for lipid force field development. Curr. Topics Membr. 2008;60:1–48. [Google Scholar]
- 38.Farge E., Devaux P.F. Size-dependent response of liposomes to phospholipid transmembrane redistribution: from shape change to induced tension. J. Phys. Chem. 1993;97:2958–2961. [Google Scholar]
- 39.Traïkia M., Warschawski D.E., Lambert O., Rigaud J.-L.L., Devaux P.F. Asymmetrical membranes and surface tension. Biophys. J. 2002;83:1443–1454. doi: 10.1016/S0006-3495(02)73915-5. [DOI] [PMC free article] [PubMed] [Google Scholar]
- 40.Harroun T.A., Katsaras J., Wassall S.R. Cholesterol hydroxyl group is found to reside in the center of a polyunsaturated lipid membrane. Biochemistry. 2006;45:1227–1233. doi: 10.1021/bi0520840. [DOI] [PubMed] [Google Scholar]
- 41.Marrink S.J., de Vries A.H., Harroun T.A., Katsaras J., Wassall S.R. Cholesterol shows preference for the interior of polyunsaturated lipid membranes. J. Am. Chem. Soc. 2008;130:10–11. doi: 10.1021/ja076641c. [DOI] [PubMed] [Google Scholar]
Associated Data
This section collects any data citations, data availability statements, or supplementary materials included in this article.