

Abstract
The GTPase Ran is a key regulator of molecular transport through nuclear pore complex (NPC) channels. To analyze the role of Ran in its nuclear transport function, we used several quantitative fluorescence techniques to follow the distribution and dynamics of an enhanced yellow fluorescent protein (EYFP)-Ran in HeLa cells. The diffusion coefficient of the majority of EYFP-Ran molecules throughout the cells corresponded to an unbound state, revealing the remarkably dynamic Ran regulation. Although we observed no significant immobile Ran populations in cells, ∼10% of the cytoplasmic EYFP-Ran and 30% of the nuclear EYFP-Ran exhibited low mobility indicative of molecular interactions. The high fraction of slow nuclear EYFP-Ran reflects the expected numerous interactions of nuclear RanGTP with nuclear transport receptors. However, it is not high enough to support retention mechanisms as the main cause for the observed nuclear accumulation of Ran. The highest cellular concentration of EYFP-Ran was detected at the nuclear envelope, corresponding to ∼200 endogenous Ran molecules for each NPC, and exceeding the currently estimated NPC channel transport capacity. Together with the relatively long residence time of EYFP-Ran at the nuclear envelope (33 ± 14 ms), these observations suggest that only a fraction of the Ran concentrated at NPCs transits through NPC channels.
Introduction
The small Ras-like GTPase Ran is a key regulator of the nuclear transport receptor (NTR)-mediated transport of proteins and certain classes of ribonucleic acids through the nuclear pore complex (NPC) channel. Ran also plays an essential role in several processes during cell division, including mitotic spindle assembly, mitotic checkpoint function, and postmitotic reformation of the nuclear envelope (NE). Many of these roles are thought to depend on the spatial regulation of the GTP/GDP charge on Ran, and on the highly dynamic localization of Ran in cells (1–3). Precise quantitative observation of Ran mobility in live cells is therefore required for an in-depth understanding of nuclear transport and mitotic mechanisms.
The position of the genome in eukaryotes is marked by a high local concentration of RanGTP, the so-called RanGTP gradient (3,4). The existence of this gradient depends on a strikingly asymmetric spatial distribution of Ran regulators. The guanine nucleotide exchange factor for Ran, RCC1, is a DNA- and histone H2A and H2B-binding protein that is actively imported to the nucleus (5–7). In contrast, the only identified Ran GTPase activating protein, RanGAP, is a cytoplasmic protein that concentrates in interphase vertebrate cells at the cytoplasmic side of the NPC through its SUMO-dependent binding to the nucleoporin RanBP2/Nup358 (8,9). The nuclei therefore contain a high concentration of RanGTP, which presumably is quickly converted to RanGDP by RanGAP when it exits from the cytoplasmic face of the NPC channel (3). Also, in cells undergoing open mitosis without NE, RCC1 dynamically interacts with chromosomes, and the majority of RanGAP remains cytoplasmic. A diffusion-limited RanGTP gradient therefore surrounds chromosomes in mitotic and meiotic animal cells (1,2,10).
In cells with an intact NE, the RanGTP gradient directs nuclear transport via the selective binding of RanGTP to NTRs of the importin β/karyopherin superfamily (3,11–13). Nuclear localization signal (NLS)-containing cargos are loaded on nuclear import receptors (importins) in the cytoplasm and transit through NPC channels to the nuclei, where RanGTP binds to the importins and induces NLS cargo-importin complex dissociation. In contrast, nuclear export signal (NES)-containing cargos are loaded on their nuclear export receptors (exportins) in a complex that is stabilized by RanGTP interaction with the exportin. The heterotrimeric RanGTP-exportin-NES cargo complexes exit through NPC channels to the cytoplasm, where they are dissociated upon RanGAP-catalyzed GTP hydrolysis on Ran.
The interphase and mitotic RanGTP gradients are paralleled by gradients of Ran protein concentration: Ran accumulates in interphase nuclei (12,14–18), and a Ran protein gradient surrounds condensed chromosomes in cells undergoing open mitosis (16). How the intracellular Ran protein concentration gradients are maintained and regulated is not completely understood. In interphase cells, RanGDP is imported to nuclei by its dedicated nuclear importer, NTF2 (12,19). In addition, Ran interacts with chromatin directly by binding to histones H3 and H4 (20–22), and indirectly in complex with RCC1 during the guanine nucleotide exchange reaction on Ran (23). Together with the expected engagement of the nuclear RanGTP in numerous complexes with NTRs (20–22), such interactions likely contribute to Ran accumulation in nuclei as well as around chromosomes in cells undergoing open mitosis. However, the extent of this contribution is not known.
Measurements of Ran cellular mobility were recently attempted as part of a study aiming to quantify the mobility of NTRs (18). Several distinct Ran populations were observed, including a significant immobile fraction in the nuclei (in contradiction to earlier photobleaching experiments (12)), and a fraction of molecules that diffused as rapidly as in aqueous solution—an observation that was difficult to reconcile with the high viscosity of the cell. We revisited the question of Ran's cellular mobility using several complementary fluorescence techniques to corroborate our results. To exclude potential artifacts due to heterogeneous and/or leaching fluorescent dye labels, we monitored the behavior of an enhanced yellow fluorescent protein (EYFP)-Ran fusion protein transiently expressed in cells. We observed no significant immobile fraction of Ran throughout the cells, and detected a significantly larger fraction of slowly diffusing Ran in nuclei compared to the cytoplasm. However, the size of the nuclear slowly diffusing Ran fraction (∼30%) was not large enough to explain nuclear accumulation of Ran by retention mechanisms. We observed relatively long residence times for EYFP-Ran at the NE (33 ± 14 ms), consistent with the idea that the population of Ran that is present at NPCs is composed of Ran that is both transported through NPC channels and engaged in the formation or dissociation of transport cargos.
Materials and Methods
Cell culture and transfection
HeLa cells were obtained from ATCC (Manassas, VA). The cells were maintained at 37°C, 5% CO2, and 95% humidity, in α-modified Eagle's medium supplemented with 10% fetal bovine serum and 100 μg/mL Normocin (InvivoGen, San Diego, CA). The pEYFP-C1 plasmid (Clontech, Mountain View, CA) was used to prepare HeLa cell lines stably expressing EYFP. For expression of EYFP-Ran, the EYFP sequence (Clontech) was cloned to the N-terminus of Ran, and then inserted into a pSG8 backbone. Recombinant EYFP-Ran was active in supporting protein import in vitro. HeLa cells were transfected using ExGen500 according to the protocol suggested by the manufacturer (Fermentas, Burlington, Canada). In the case of EYFP, transfected cells were selected by using 0.4 mg/mL neomycin to obtain stably expressing cell lines. For imaging, HeLa cells were plated on 18 × 18 mm glass coverslips for 24 h, washed in phosphate-buffered saline (pH = 7.4) at 37°C, and immediately mounted on a 24 × 40 mm microscope slide with the help of parafilm spacers. The cells were kept in phosphate-buffered saline during the experiments. For fluorescence correlation spectroscopy (FCS) experiments, the cells were kept at 37°C with the help of both a heated stage and an objective heater (Linkam Scientific, Tadworth, UK). Each live cell sample was used for a maximum of 2 h before it was discarded. For detection of endogenous Ran by immunofluorescence, fixed HeLa cells were incubated with mouse monoclonal anti-human Ran antibody (IgG2a; BD Transduction Laboratories, Franklin Lakes, NJ) diluted 1:3000 for 2 h, washed and incubated with anti-mouse goat IgG labeled with Alexa-488 (1:200; Molecular Probes, Eugene, OR) for 1 h.
Live cell confocal imaging
Confocal images (256 × 256 pixels) of live cells were collected at room temperature using a scanning confocal microscope (EZ C1, v.1.7 and v.3.2; Nikon, Melville, NY). Fluorescence was excited using the 488 nm radiation of an Argon laser, with a ∼5 μW power at the sample. An oil-immersion objective lens (100×, NA = 1.3; Nikon) was used with a 61.5 μm diameter pinhole, resulting in a confocal volume with a calculated 1/e2 radius w0 = 0.35 μm. Imaging conditions were optimized to minimize photobleaching, i.e., images were collected with a 10 or 15 μs dwell time and with pixel size, d (defined as the distance between the center of two consecutive pixels), varying between d = 80 nm and d = 310 nm. The detector gain was adjusted for each cell to ensure that the maximum level of signal collected was well below the detector saturation level.
Fluorescence intensity analysis
The level of fluorescence intensity in different cellular compartments was quantified with the use of ImageJ software. We assessed the fluorescence associated with different cellular regions from images by selecting several rectangular areas in each of those regions and taking the average fluorescence intensity in each area. The fluorescence intensity values recorded in different samples were normalized to the pixel dwell time of the corresponding images. The fluorescence at the NE was measured in 1 pixel wide rectangular areas along the NE. The average fluorescence intensity for the row of pixel corresponding to the NE, INE, was compared with the average fluorescence in the nucleus, IN.
To calculate the NE concentration of Ran, cNE, relative to its nuclear concentration, cN, we took into account the fact that the NE is thinner than the diameter of the confocal volume, which in our imaging conditions was 2w0 ∼ 0.7 μm. In contrast, the height of the NPCs is only ∼0.08 μm (24). Thus, signals coming from the nucleus and cytoplasm also contribute to the fluorescence reading at the NE, INE. Assuming that the NE can be thought of as an infinitely thin planar vertical surface passing through the center of the confocal detection volume, such that equal volumes of the cytoplasmic and nuclear compartments contribute to the fluorescence intensity, we can write:
| (1) |
where cNE is the concentration of EYFP-Ran at the NE, ANE is the area of the portion of the NE present in the detection volume, and iNE is the molecular brightness of EYFP-Ran at the NE. Further assuming that the molecular brightness of EYFP is constant throughout the cell, iNE is equal to the molecular brightness of Ran in the nucleus, iN. In turn, iN can be calculated from the measured EYFP-Ran nuclear concentration, cN, the approximated confocal detection volume, V, and the measured nuclear fluorescence intensity, IN: iN = IN/(cNV). Then, the concentration of EYFP-Ran at the NE can be estimated as a function of the NE/nuclear fluorescence intensity ratio, INE/IN, the cytoplasmic/nuclear fluorescence intensity ratio, IC/IN, and the geometrical factor V/ANE:
| (2) |
To obtain the expression on the right-hand side of Eq. 2, we estimated the geometrical factor V/ANE by writing that an elongated object with radius w0 and aspect ratio S, and therefore with half-height Sw0, would have a volume V ∼ πSw03, and that its intersection with a flat vertical surface passing through its center would be ANE ∼ πSw02. Thus, V/ANE ∼ w0 independently of the exact shape of the detection volume. Since INE is calculated as an average fluorescence along a row of pixels corresponding to a length of ∼1 μm, cNE represents an average surface concentration, which takes into account both areas of the NE with high and low fluorescence intensities.
Fluorescence recovery after photobleaching
Fluorescence recovery after photobleaching (FRAP) experiments were performed on a confocal microscope (SP5; Leica, Wetzlar, Germany). Cells were imaged using the 488 nm line of an Argon laser, with the power highly attenuated to eliminate visible photobleaching during imaging. Then, a selected circular region of the cell with radius w ∼ 1.25 μm was photobleached using 50% of the laser's full power for two frames (1.3 s/frame). Finally, a small square region (15.7 μm2) encompassing the photobleached area was imaged to detect fluorescence recovery in and out of the photobleached region of interest. Prebleach, bleach, and postbleach 256 × 256 imaging was carried out at a 700 lines/s scanning speed and with a 15.5 nm pixel size. In principle, the protein diffusion coefficient can be estimated from the half-time of the fluorescence recovery τ1/2, where in the case of a single diffusing species D = 0.224 w2/τ1/2 (25). This analysis, however, is only valid if the photobleaching step is short compared to τ1/2 (26).
Number and brightness analysis
Number and brightness (N&B) analysis is a method that allows one to retrieve the average concentration and molecular brightness of fluorescent particles at each pixel of a time series of confocal images (27,28). The standard deviation from the average fluorescence intensity at each pixel is related to the shot noise and to variation in the number of fluorescent particles. Calculating the second moment of the distribution of fluorescence intensities for a given pixel thus gives access to both the molecular brightness and average number of molecules in the confocal volume. We performed N&B analysis of image stacks using the software SimFCS (obtained from the Laboratory for Fluorescence Dynamics, Irvine, CA). Images were collected with the same laser scanning microscope used for fluorescence quantification but under slightly different scanning conditions, i.e., pixel dwell times varied between 8 and 29 μs, and the pixel size was kept constant at 60 nm. Generally, stacks of 80 images, 256 × 256 pixels each, were collected. The gain of the analog photomultiplier tube used for detection was optimized for each different cell imaged. The molecular brightness obtained from the N&B analysis varied accordingly, and increased as expected with increasing detector gain.
Fluorescence correlation spectroscopy
The in-house-built system used for the FCS experiments is described in detail elsewhere (29). In this case, a water-immersion objective lens (Nikon 60×, NA = 1.2) was used to focus the 514 nm line of an Ar laser and to collect the fluorescence signal. Before each series of experiments, Rhodamine 6G (Sigma) was used to determine the size of the detection volume, assuming a room temperature diffusion coefficient for Rhodamine 6G D = 250 μm2/s. From calibration with Rhodamine 6G, it was found that w0 = 0.3–0.4 μm, depending on the alignment. Experiments were carried out at low laser intensities (I ∼ 2 μW, corresponding to a ∼0.5 kW/cm2 flux at the sample), in which case no reduction in overall fluorescence intensity was observed over the time of a measurement (60–120 s), indicating negligible photobleaching effects. For this excitation flux, the brightness per molecule of YFP in cells was ∼2 kHz. In all of the cells used for FCS measurements, the fluorescent protein concentration was <100 nM.
Individual autocorrelation functions were analyzed using a model that accounts for the possibility of multiple diffusing components and protein blinking:
| (3) |
The characteristic time τD,i is related to the diffusion coefficient of the ith species, Di, and to the half-width of the detection volume, w0: τD,i = w02/4Di. Ai is the amplitude of the term related to the ith species, and N is the average number of fluorescent proteins in the detection volume. For N = 1, A1 = 1. For N = 2, and if both fluorescent species have the same molecular brightness, A1 and A2 are the respective fractions of species 1 and 2. S is the aspect ratio of the detection volume, which was fixed in the analysis to a predetermined value obtained during the calibration step. The exponential term is related to the protein that alternates between a fluorescent and a nonfluorescent state: B is the fraction of proteins found in the dark state, and τB is the relaxation time associated with the blinking. Both EYFP and EYFP-Ran exhibited a clear and consistent fluorescence blinking in the autocorrelation data recorded in HeLa cells, with τB = 0.3 ± 0.1 ms and B = 0.3 ± 0.1. The constant term C was added to account for very slow processes, such as global cellular motions, that result in the autocorrelation function relaxing to a slightly nonzero value at large times. This constant term always represented <5% of the total amplitude of the correlation function. Unless otherwise stated, the fitting of the data was done with the software KaleidaGraph (Synergy Software, Reading, PA). The fit results were stable, meaning that for a wide range of initial guesses the fit converged to the same solution. On a few occasions (<5% of the individual measurements), the fitting routine returned nonsensical values for the photophysical parameters (such as a negative fraction of molecules or a blinking relaxation time shorter than 1 μs), in which case the curve was discarded.
We also used two additional models—the anomalous diffusion model and the stick-and-diffuse model—to analyze the average autocorrelation functions obtained for different cellular compartments. These autocorrelation functions were calculated as the average of all the autocorrelation functions obtained for a particular molecule in a particular compartment, where each of these curves had first been normalized so that it would decay from one to zero, using the values of N and C obtained by performing a fit with Eq. 3. This normalization was done so that each individual autocorrelation function would have exactly the same weight when the average autocorrelation function was calculated.
The anomalous diffusion model takes into account the possibility of a deviation from simple Fickian diffusion, where the mean-squared displacement of particles scales as tα, a power law characterized by the anomalous exponent α. This type of diffusion leads to an autocorrelation function:
| (4) |
Least-square fitting of Eq. 4 to the data was performed using the software Kaleidagraph (Synergy Software). Five independent parameters (N, τD, B, τB, and α) were varied during the fit, whereas S was fixed to the value obtained during the calibration step. The fit results were stable.
The premise of the stick-and-diffuse model is that fluorescent molecules interact with one type of immobile ligands according to a simple exponential kinetics, where the molecules bind to their ligand with a rate kon and unbind with a rate koff. The distribution of binding times is thus exponential with an average value 1/koff. Molecules freely diffuse between two binding events, with a diffusion coefficient D. An expression for the autocorrelation function expected in the case of 2D diffusion was recently derived by Yeung et al. (30). We adapted that expression for 3D diffusion and added a blinking contribution:
| (5) |
Least-square fitting of Eq. 5 to the data was performed using the software Maple (Maplesoft, Waterloo, Canada). Six independent parameters (N, τD, B, τB, kon, and koff) were varied during the fit, whereas S was fixed to the value obtained during the calibration step. The fit results were stable.
Raster-image correlation spectroscopy
Raster-image correlation spectroscopy (RICS) is a mathematical image-processing method that can be applied to time series of confocal raster scanning images collected under carefully selected scanning conditions (31,32). It relies on the analysis of the spatial correlation function calculated from the stack of images, GS(ξ,ψ), where ξ and ψ are the spatial increments in the horizontal and vertical coordinates of the confocal image, respectively. Because the different points in a raster scanning image are recorded at different times, GS(ξ,ψ) is in fact a spatiotemporal correlation function, and it contains information about molecular dynamics.
Images for RICS analysis were collected as for image quantification and N&B analysis, with a constant d = 60 nm pixel size, and with pixel dwell times varying between τp = 8 and τp = 29 μs, which corresponded to line times (time increment between two consecutive lines) between τl = 4 and τl = 12 ms. We used a one-component diffusion model to fit the spatiotemporal autocorrelation function (33):
| (6) |
In this equation, w0 and wz are the radial and axial 1/e2 radii of the laser beam profile, respectively. Note that Eq. 6 is valid only for one-photon excitation, and differs from the original equation introduced by Digman et al. (31). The fit returns a value for the diffusion coefficient of the fluorophore, D. We used SimFCS to both calculate and analyze the spatiotemporal correlations from our data. We consistently used the moving average feature of the software. This means that for each individual image, an average image calculated from the four adjacent images was subtracted, after which a constant value corresponding to the average pixel intensity value of the average image was added to each pixel in the image. It ensures that purely spatial correlations due to the cellular structures do not appear in the autocorrelation function. Also, the first two points of the correlation function along the scanning direction were discarded for the fit, because the analog detector used to collect the fluorescence signal caused spurious correlations on a very short timescale.
Line-scanning FCS
A line-scan analysis was performed on confocal data obtained by repeatedly scanning the same line in the sample. Each line was imaged 30,720 times. A two-dimensional (2D) intensity matrix representing fluorescence intensity as a function of pixel position and time was built, and the temporal autocorrelation function at each pixel of the line was computed using SimFCS. Line-scanning autocorrelation functions were fitted using a simple diffusion model (Eq. 3 with N = 1, B = 0, and C = 0). Note that this analysis did not take into account blinking of the EYFP fluorophore (B = 0), as the temporal resolution of line-scanning FCS (∼1 ms) is much larger than the relaxation time of the EYFP blinking process (∼100 μs). We chose to scan along lines 1–4 μm in length, using 256 pixels, which resulted in pixel sizes of d = 4–16 nm and ensured that many of these pixels were on the NE. We further used a short pixel time, τP = 3.6 μs, which resulted in a total scanning time of 83 s, or a line time of τl = 2.7 ms when the line delay is accounted for.
Results
Spatial distribution of EYFP-Ran in live interphase cells
As a first approach to analyze the EYFP-Ran distribution in cells, we acquired confocal images of live interphase HeLa cells transiently expressing the protein (Fig. 1 A). As expected, the majority of EYFP-Ran concentrated in the nucleus. The average nuclear/cytoplasmic fluorescence ratio was 3.9 ± 0.4 for EYFP-Ran and 1.01 ± 0.04 for the control protein EYFP (Fig. 1, B and C). Unlike EYFP, EYFP-Ran clearly accumulated at the NE, and the ratio of the mean EYFP-Ran fluorescence intensity recorded at the NE compared to the fluorescence intensity in the nucleus in the same cell was 1.28 ± 0.07 (Fig. 1 D). Finally, the fluorescence intensity of both EYFP and EYFP-Ran was slightly lower in nucleoli compared to the rest of the nucleus. The nucleolar/nuclear fluorescence ratio was 0.66 ± 0.02 for EYFP-Ran and 0.52 ± 0.01 for EYFP, an indication that Ran may be actively imported to or retained in nucleoli.
Figure 1.
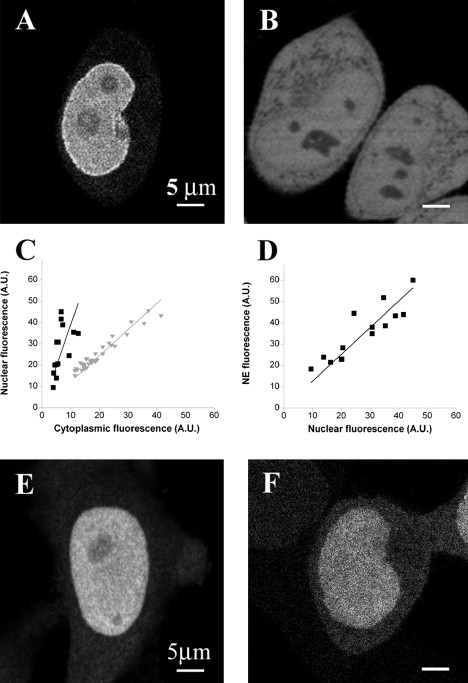
Cellular distribution of EYFP-Ran (A) and EYFP (B) visualized by confocal fluorescence microscopy in live HeLa cells. (C) Nuclear/cytoplasmic fluorescence intensity for EYFP-Ran (black squares) or EYFP (gray triangles). Each point represents a different cell. (D) NE/nuclear fluorescence intensity for EYFP-Ran. (E) The localization of endogenous Ran in an untransfected and fixed HeLa cell as seen by immunofluorescence. (F) Typical fluorescence confocal image of a HeLa cell expressing EYFP-Ran after fixation. All scale bars are 5 μm.
To quantitatively compare the distribution of the EYFP-Ran fusion protein used in our study with that of wild-type Ran (wtRan), we detected endogenous Ran in fixed HeLa cells by immunofluorescence with monoclonal Ran antibody (Fig. 1 E). The typical fluorescence distribution observed in these cells differed from that observed in live cells transfected with EYFP-Ran in two ways: 1), the nuclear/cytoplasmic ratio decreased slightly (3.1 ± 0.5); and 2), there was no visible accumulation of the protein at the NE. To determine whether these differences were due to an actual difference in the localization of the two proteins, we evaluated the effect of cell fixation by imaging fixed cells that had been transfected with EYFP-Ran (Fig. 1 F). We found that in fixed cells the nuclear/cytoplasmic ratio of EYFP-Ran also decreased (to 3.5 ± 0.2), and at the same time the prominent localization of the protein at the NE disappeared.
The fluorescence intensity detected by the fluorescence microscope is the product of the concentration and the specific molecular brightness of the fluorophore. Because the molecular brightness of fluorescent proteins such as EYFP may depend on their cellular localization (34), the fluorescence intensity is not necessarily a direct measure of protein concentration. To compare the concentration of EYFP-Ran in different cellular compartments without the potential bias of differential molecular brightness, we used N&B analysis. In this method, fluctuation of the fluorescence signal of molecules diffusing into and out of a pixel during fast consecutive measurements is statistically analyzed to separately retrieve the average number of mobile fluorophores and their molecular brightness. The method was introduced as a single point measurement (“moment analysis” (35)) and was recently adapted for the analysis of 2D image stacks that may be acquired by conventional confocal microscopes (27,28). Fig. 2 shows a representative example of the N&B analysis in which the average intensity image of a HeLa cell expressing EYFP-Ran was separated into a map of the average number of EYFP-Ran molecules per pixel and a map of their molecular brightness. The N&B analysis demonstrated that the molecular brightness of EYFP-Ran is similar throughout the cells, corroborating the intensity-based analysis.
Figure 2.
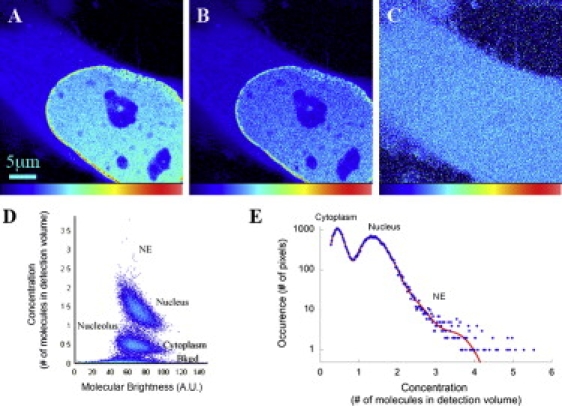
Cellular distribution of EYFP-Ran as seen with N&B analysis. (A) Average intensity map of an interphase HeLa cell expressing EYFP-Ran. (B and C) Corresponding concentration map (B) and molecular brightness map (C). (D) Correlation between the average concentration, N, and the average molecular brightness, B, of the fluorophore at each pixel of the image shown in A. (E) Histogram of the concentration values calculated with N&B analysis and shown in B. The low concentration values, which correspond to pixels outside the cell, were excluded from this plot. The histogram was fit with six Gaussian functions (red line), the first corresponding to pixels in the cytoplasm (maximum for N = 0.44), the second to pixels in the nucleoli (maximum for N = 0.68), the third and fourth to pixels in the nucleus (maxima at N = 1.30 and 1.38), and the fifth and sixth to pixels at the NE (maxima at N = 1.79 and N = 3.50).
When the pixels with background signal from outside of cells were disregarded, the N&B analysis showed that pixels from the cytoplasm contained on average the lowest number of EYFP-Ran molecules, and that, as expected, pixels from nuclei formed a distinct population with significantly higher EYFP-Ran molecule numbers (Fig. 2 D). The ratio of the average number of the EYFP-Ran molecules in nuclear versus cytoplasmic pixels was ∼4, similar to fluorescence intensity measurements. This ratio can be calculated for each cell by considering the histogram of the concentration values obtained at each pixel, in which the cytoplasmic and nuclear pixel populations appear as well-defined peaks (Fig. 2 E). Pixels from nucleoli contained intermediate EYFP-Ran molecule numbers compared to the nucleus and cytoplasm. Also consistent with the fluorescence intensity measurements, the highest numbers of EYFP-Ran molecules per pixel in individual cells were detected in small spot-like clusters along the NE, where the Ran concentration was found to be three to four times higher than in the nucleus (3.2 ± 0.6 on average, as calculated from the concentration histograms). The absolute values of the EYFP-Ran concentration measured by N&B analysis varied significantly from cell to cell (from ∼1 to ∼5 nM for the cell population chosen for imaging), as expected for transiently transfected cells. However, the nuclear/cytoplasmic concentration ratio and NE/nuclear concentration ratios were reproducible, with cell-to-cell variations of only ∼25%. The molecular brightness of the control EYFP protein was uniform throughout the cell, as it was for EYFP-Ran. However, in the case of EYFP the nuclear and cytoplasmic pixel molecular numbers were indistinguishable, as expected (data not shown).
The majority of cytoplasmic and nuclear Ran molecules are mobile
The FRAP method is well suited for detecting potential slow or immobile populations of EYFP-Ran in cells (36). In each experiment, the recovery of fluorescence in a small, photobleached cellular region was observed and compared with the fluorescence immediately outside that region. Selected small nuclear or cytoplasmic regions of cells transfected with EYFP-Ran were photobleached, and then a slightly larger region including the photobleached area was repeatedly imaged to capture the recovery process. The fluorescence in the photobleached area was normalized to the final average fluorescence outside of the photobleached area to account for fluorescence loss due to the continuous imaging (Fig. 3). In both the nucleus and cytoplasm we consistently observed a 100% recovery, with a half-time for recovery τ1/2 = 0.9 ± 0.4 s in the nucleus and τ1/2 = 0.7 ± 0.7 s in the cytoplasm. All EYFP-Ran molecules were therefore completely mobile in both compartments on the ∼1 s timescale corresponding to our FRAP experimental conditions. A naïve estimate of the diffusion coefficient of EYFP-Ran based on the value of τ1/2 and neglecting the finite time necessary to perform the photobleaching step (see Materials and Methods) yields D = 0.4 μm2/s in the nucleus and D = 0.5 μm2/s in the cytoplasm.
Figure 3.
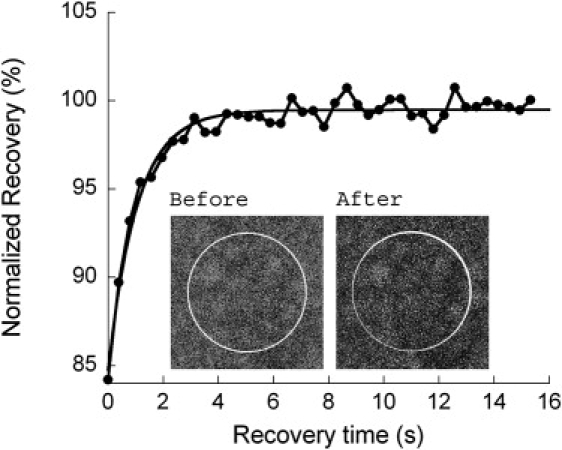
Fluorescence recovery after photobleaching in the nucleus of HeLa cells expressing EYFP-Ran. The plot shows the recovery inside the photobleached area, normalized to the fluorescence measured immediately outside of this area. The line corresponds to a single-exponential fit and returned a recovery time of τ1/2 ∼ 1 s. Inset: Confocal images of the scanned area before fluorescence photobleaching and at t = 16 s after photobleaching, showing a complete fluorescence recovery. The circle indicates the photobleached area (diameter d = 2.5 μm).
Comparison of Ran mobility in nucleus and cytoplasm
To refine our understanding of the dynamic behavior of EYFP-Ran, we performed single-point FCS measurements. Under low excitation intensity conditions that produced no detectable bleaching during the course of the measurement, we performed 174 separate FCS measurements in multiple locations in the nucleus and the cytoplasm of six different HeLa cells expressing EYFP-Ran and compared them with 106 measurements in nine HeLa cells expressing EYFP. The average autocorrelation functions obtained from these experiments are shown in Fig. 4. The autocorrelation functions corresponding to the motion of EYFP in the cytoplasm and nuclei could be fitted with a one-component diffusion model (see Materials and Methods, Eq. 3, n = 1) whereas models that assumed two components (Eq. 3, n = 2) or anomalous diffusion (Eq. 4) did not significantly improve the fit to the data. On the other hand, the autocorrelation functions obtained for EYFP-Ran contained a visible contribution from slower dynamic processes on top of free diffusion, and a dramatically improved fit was obtained with either the two-component model or the anomalous diffusion model (Fig. 4 and Table 1). Note that the oscillations visible above ∼10 ms in the graph of the residuals are due to mechanical vibrations caused by the laser fan, which could not be entirely suppressed (Fig. 4). The fact that the motion of EYFP can be well described by simple diffusion means that nothing in the cellular environment causes anomalous diffusion for average-size proteins such as EYFP. Therefore, the most likely explanation is that the diffusion of EYFP-Ran deviates from single-species simple diffusion because of specific molecular interactions. We consequently limited further analyses of our FCS data to models based on the assumption that Ran was undergoing simple diffusion as EYFP, and in addition was interacting with a single type of binding partner (mobile (the two-component diffusion model) or immobile (the stick-and-diffuse model)).
Figure 4.
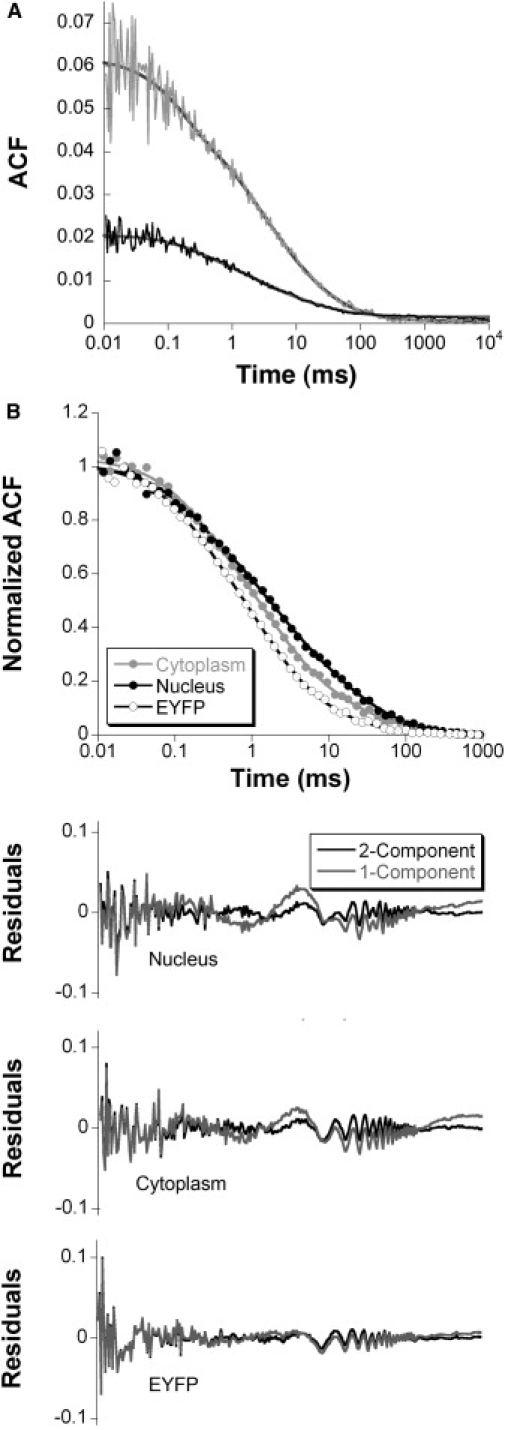
(A) Examples of individual autocorrelation functions obtained for nuclear EYFP-Ran (gray and black thin lines). These curves were fit with a two-component diffusion model (thick lines). (B) Comparison between the average autocorrelation functions obtained for nuclear and cytoplasmic EYFP-Ran (solid black symbols and solid gray symbols, respectively) with the average autocorrelation function obtained for nuclear EYFP (open circles). The lines correspond to the two-component diffusion fit. The residuals for each of these three autocorrelation functions are shown below, for both one-component (gray lines) and two-component (black lines) diffusion fits.
Table 1.
Summary of the results obtained from the four different models used to fit the nuclear EYFP-Ran FCS data
| Model | D1 (μm2/s) | D2 (μm2/s) | α | kon (s−1) | koff (s−1) | A1 (%) | A2 (%) | χ2 |
|---|---|---|---|---|---|---|---|---|
| One-component diffusion | 3.8 | - | - | - | - | 100 | - | 0.063 |
| Anomalous diffusion | 8.7 | - | 0.66 | - | - | 100 | - | 0.038 |
| Two-component diffusion | 17 | 1.3 | - | - | - | 67 | 33 | 0.035 |
| Stick-and-diffuse | 17 | - | - | 12 | 31 | 71 | 28 | 0.058 |
The parameters for the one- and two-component diffusion models are defined in Eq. 3, those for the anomalous diffusion model are defined in Eq. 4, and those for the stick-and-diffuse model are defined in Eq. 5. χ2 is the χ2 value with the weight for all data points set to one, and thus is not a normalized χ2 value.
First, we used the two-component diffusion model to explore the possibility that Ran interacts mainly with other mobile molecules. To account for an eventual spatial heterogeneity of the protein behavior, we analyzed each individual correlation function recorded. From this analysis we obtained two diffusion coefficients for each individual measurement (Fig. 5). These two diffusion coefficients were not significantly linearly correlated (as shown by Pearson's correlation coefficient r = 0.03 calculated for a set of 52 nuclear EYFP-Ran measurements), supporting the idea that two independent molecular processes are responsible for these two observed dynamics. According to this analysis, the majority of the signal from EYFP throughout the cell (∼96%) was contributed by rapidly diffusing molecules (with a diffusion coefficient D = 23 ± 5 μm2/s in the cytoplasm and D = 21 ± 5 μm2/s in the nucleus). Similarly, for cytoplasmic EYFP-Ran, ∼90% of the autocorrelation data corresponded to fast diffusing molecules (with D = 15 ± 6 μm2/s), whereas only ∼10% displayed a much slower motion (D = 0.7 ± 0.4 μm2/s). In contrast, slowly moving nuclear EYFP-Ran molecules (D = 1.3 ± 0.5 μm2/s) contributed 33% of the signal. The remaining 67% of the signal corresponded to nuclear EYFP-Ran that seemed to be diffusing freely, with a diffusion coefficient (D = 17 ± 6 μm2/s) only ∼20% smaller than that of nuclear EYFP. Based on this two-component FCS analysis, we estimate that the average diffusion rate of the entire EYFP-Ran population in the nucleus was ∼12 μm2/s, as compared to ∼14 μm2/s in the cytoplasm. The distribution of diffusion coefficients is slightly broader for EYFP-Ran than for EYFP (as shown by the errors on the average diffusion coefficient, which correspond to the standard deviation of the distributions), suggesting that a spatial heterogeneity of Ran behavior adds some complexity to the motion of this protein. However, all individual autocorrelation functions for EYFP-Ran had a significant slow dynamic contribution, indicating that not only is this complexity due to spatial heterogeneity, it is already present at every single point in the cell.
Figure 5.
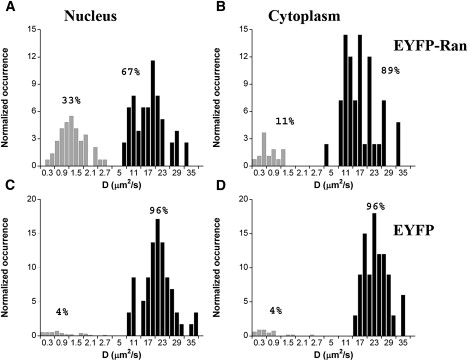
Distribution of diffusion coefficients obtained from analysis of the FCS data with the two-component diffusion model. Black columns correspond to the fast diffusion process, and the gray columns correspond to the slow diffusion process. The total occurrence for each process has been normalized to its average relative weight in the correlation function. (A and B) Diffusion coefficients obtained for EYFP-Ran in the nucleus (A) and cytoplasm (B) of interphase HeLa cells. (C and D) Diffusion coefficients obtained for EYFP in the nucleus (C) and cytoplasm (D) of interphase HeLa cells. Note that the scale for the diffusion coefficients is not linear.
Second, to consider the possibility that the slower fraction of EYFP-Ran was due to transient association of Ran with relatively immobile cellular structures in the cell nuclei, we also analyzed our nuclear data with the stick-and-diffuse model (30). The assumptions in this model are that all EYFP-Ran molecules can interact with one type of evenly distributed immobile targets with a binding rate kon and an unbinding rate koff, and that they diffuse freely between two binding events. The best statistically significant fit of the average autocorrelation function recorded in cell nuclei was found for D = 17 μm2/s, kon = 12 s−1, and koff = 31 s−1, corresponding to 28% of the nuclear EYFP-Ran molecules being bound to nuclear structures at all times (Fig. 6). Each EYFP-Ran molecule is therefore immobilized 28% of the time. Although the statistical significance of the stick-and-diffuse model was not as good as that of the two-component diffusion model (Table 1), both analyses converged on predicting that only ∼1/3 of nuclear EYFP-Ran is dynamically engaged in molecular interactions, which decreases its mobility to D ∼ 12 μm2/s.
Figure 6.
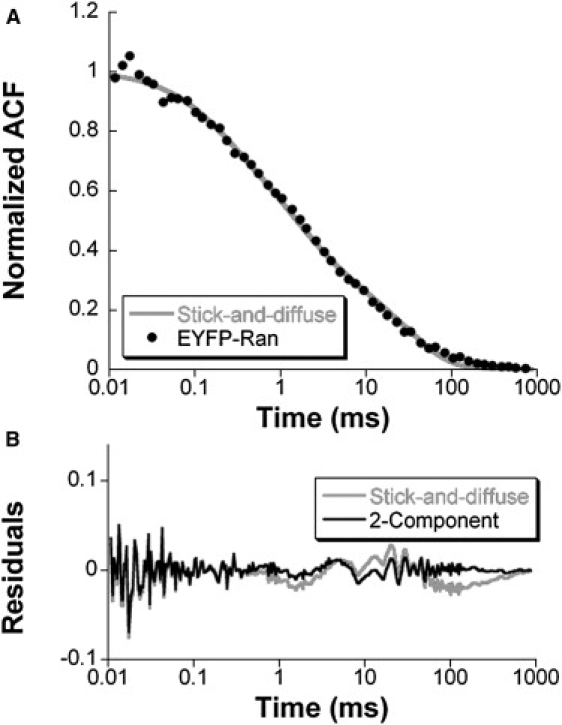
(A) Average autocorrelation function obtained for nuclear EYFP-Ran (solid black symbols, same as in Fig. 4B), and the corresponding stick-and-diffuse fit (gray line). (B) Residuals of the fit shown in A (gray line) compared with those obtained using the two-component diffusion model (black line).
Average apparent diffusion coefficient of Ran
Although FCS is a useful method for determining the concentration, diffusion coefficient, and molecular interactions of mobile fluorescent molecules in living cells, immobile fluorescent molecules may remain invisible to FCS because of photobleaching (37,38). On the other hand, our measurements of Ran mobility with FRAP would not detect fast-diffusing EYFP-Ran due to the relatively long time (2.6 s) needed to photobleach the chosen area. In an attempt to circumvent the limitations of both FCS and FRAP, and to measure the average diffusion coefficient of the entire EYFP-Ran population, we used the RICS method (31,32). In RICS, the analysis of the spatiotemporal pixel-to-pixel and line-to-line correlations in raster-scanned images is used to extract information on a very wide range of diffusion rates. We recorded time series of confocal images of HeLa cells expressing EYFP or EYFP-Ran and calculated the corresponding spatiotemporal autocorrelation functions (Fig. 7). Because the amount of signal needed to obtain statistically significant autocorrelation functions was limiting under our conditions, the EYFP-Ran scans were analyzed over a rectangular region covering the entire nucleus and a small adjacent portion of the cytoplasm. Several pixel dwell times were investigated to verify the stability of this analysis, which proved to be very good for EYFP-Ran (Fig. 7). The average apparent diffusion coefficient of EYFP detected by RICS was 18 ± 2 μm2/s, which is indistinguishable from the FCS measurements. Although RICS measurements of the cytoplasmic EYFP-Ran could not be obtained due to limited signal, the average mobility of the mostly nuclear EYFP-Ran detected by RICS was 5.3 ± 0.3 μm2/s, i.e., significantly slower than EYFP alone and in the lower range of the estimated average diffusion coefficient of EYFP-Ran detected by FCS (∼12–14 μm2/s, with an error of ∼6 μm2/s).
Figure 7.
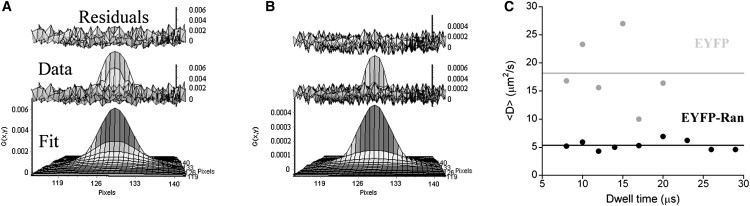
Ran dynamics as observed by RICS. (A) Example of an autocorrelation function obtained by RICS for a cell expressing EYFP-Ran (middle plot: dwell time 10 μs, pixel size 0.06 μm). The corresponding fit (lower plot) and residuals (upper plot) are also shown. The diffusion coefficient recovered from these particular data was D = 5.4 μm2/s. (B) Example of an autocorrelation function obtained by RICS for a cell expressing EYFP (middle plot, dwell time: 8 μs, pixel size: 0.0602 μm). The corresponding fit (lower plot) and residuals (upper plot) are also shown. The diffusion coefficient recovered from this particular data was D = 17 μm2/s. (C) Average diffusion coefficient obtained by RICS for EYFP-Ran and EYFP in interphase HeLa cells as a function of dwell time (black and gray symbols). The solid lines indicate the average value over all dwell times, <D> = 5 μm2/s for EYFP-Ran and <D> = 18 μm2/s for EYFP.
Residence time of Ran at the NE
In principle, FCS could be used to analyze the dynamics of EYFP-Ran molecules associating directly with NPCs. However, the conventional spot FCS measurements obtained at NPCs are frustrated by the contribution of cytoplasmic and nuclear fluorescence background due to the relatively large size of the diffraction-limited confocal excitation volume compared to NPCs, and therefore require relatively high excitation intensities. To measure the mobility of EYFP-Ran at the NPC in comparison with the surrounding compartments, we performed linear confocal scanning combined with FCS analysis over lines several micrometer long, spanning the NE in HeLa cells expressing EYFP-Ran. In comparison with single-point FCS, the line-scanning FCS reduced the average light flux on each individual pixel, and therefore photobleaching, at the cost of a loss in temporal resolution. A temporal autocorrelation was calculated for individual pixels or groups of pixels along the lines using SimFCS (Fig. 8). No temporal correlation was observed in groups of pixels that were exclusively nuclear or cytoplasmic. On the contrary, a clear temporal correlation in NE pixels was observed in groups of pixels crossing the NE. Analysis of the autocorrelation functions calculated at the NE, using a simple diffusion model, returned an average residence time of 33 ± 14 ms (obtained from nine separate measurements).
Figure 8.
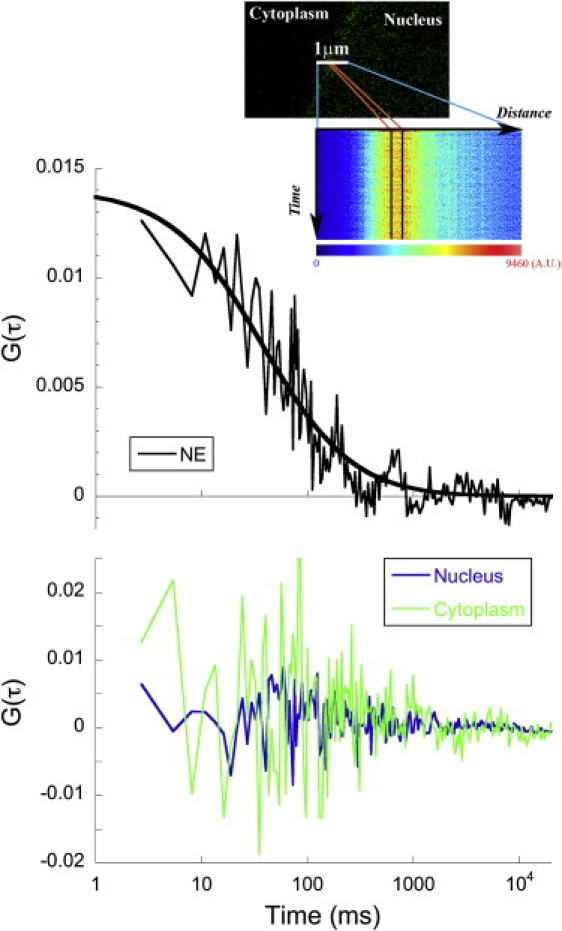
Line-scan analysis. Autocorrelation functions obtained from a line scan performed across the NE of a HeLa cell expressing EYFP-Ran, from a group of 12 adjacent pixels at the NE (black line, top graph) and from groups of 20 adjacent pixels situated in the nucleus (blue line, bottom graph) and cytoplasm (green line, bottom graph). Fit of the data with a simple one-component diffusion model returned a residence time τD = 38 ms at the NE (thick black line, top graph). Inset: Position of a line scan with respect to the NE of the EYFP-Ran transfected HeLa cell (top) and intensity carpet corresponding to the line scan (bottom).
Discussion
Dynamic range accessible to FRAP, FCS, and RICS
We assessed the mobility of the EYFP-Ran in HeLa cells using three different experimental methods, which returned what appeared to be different values for the average diffusion coefficient of this protein. Based on raster-scanning FRAP data, we obtained a value for the average diffusion coefficient of nuclear EYFP-Ran D ∼ 0.5 μm2/s, whereas with RICS we obtained D ∼ 5 μm2/s and with single-point FCS we obtained D ∼ 12 μm2/s. These disparities are largely due to the different dynamic range accessible to each of these three methods. Not only do they illustrate the respective limitations of these techniques, they also can help provide a more inclusive picture of EYFP-Ran mobility.
FRAP is limited in its detection of mobile fluorophores by the duration of the photobleaching pulse, TP. If significant diffusion of the fluorophore out of the photobleached area occurs during the photobleaching step (in other words, if τ1/2 < TP, or equivalently if D > w2/TP), then a diffusion coefficient cannot be easily extracted from the photobleaching recovery curve (26,40–42). For raster-scanning FRAP experiments such as those presented here, which were performed using a commercial confocal instrument, the duration of the photobleaching step cannot be <TP ∼1–10 s, depending on the size of the scanned photobleached area (w ∼ 1–10 μm). Quantitative studies of diffusion with such raster-scanning FRAP experiments are therefore limited to fluorophores for which D < 1 μm2/s. In cells, this condition is usually fulfilled by proteins bound to cellular structures and membranes, but not by soluble proteins. Different variants of FRAP (e.g., single-point FRAP) can be used instead to quantify the motion of soluble proteins.
The single most important limitation of single-point FCS in terms of the accessible dynamic range is that slow fluorophores, whose residence time in the detection volume is larger than their photobleaching lifetime, λP, photobleach before they leave the detection volume and thus appear to be faster than they really are (43). For this reason, FCS can give reliable quantitative information about a dynamic process only when the associated characteristic time is much shorter than λP. In the case of diffusion, this means that D > w02/λP. The photobleaching lifetime of fluorescent proteins such as EGFP or EYFP under FCS excitation conditions typically varies between 0.1 and 1 s. Since w0 is ∼0.25 μm or more in the confocal geometry, only fluorescent proteins with D > 1 μm2/s can be reliably studied. In the case of proteins exhibiting a range of motions, this implies that single-point FCS experiments may underestimate both the importance of slow motions and their associated characteristic time. Line-scanning FCS can be used to extend the applicability of FCS to slower motions, because scanning the beam significantly reduces the residence time of fluorophores in the detection volume. This, however, comes at the cost of a loss in temporal resolution, since the line time associated with the scanning (typically τl ∼ 1 ms or more) will then set a lower limit on the characteristic times that can be detected, such that only particles with D < w02/(4τl) ∼10 μm2/s can be detected by line-scanning FCS.
The introduction of RICS was largely motivated by the need to overcome the limitations of both FCS and FRAP, and to characterize the complex motions of molecules, such as proteins in cells, that exhibit a very wide range of dynamics. Because RICS combines spatial and temporal correlation analyses both along a scanning line and from line to line, it offers the potential to characterize mobility at different length scales and timescales. Fast diffusive motions can be detected in correlations along the direction of scanning, whereas slow motions are reflected in line-to-line correlations (33). Also, because of the 2D aspect of the autocorrelation function, complicated behaviors involving several different dynamic processes (such as diffusion and binding) should have unique signatures, which means that in some cases RICS should be able to distinguish between different models better than 1D FCS (44). Finally, raster-scanning reduces the residence time of fluorophores in the laser focus, and therefore the risk that any particular fluorophore will photobleach while under observation. To better understand the range of diffusive motions that can be accessed by RICS, we need to consider several characteristic times: the “natural” residence time of the fluorophore in the detection volume, τD = w02/4D, and the “overlap times” tx = 2w0τP/d and ty = 2w0τl/d (along and perpendicular, respectively, to the scanning direction), which correspond to the length of time an immobile fluorophore would remain in the detection volume. A diffusion process will be visible in pixel-to-pixel correlations along the scanning direction if τD < tx, i.e., if D > w0d/8τP, and it will be visible in line-to-line correlations if τD < ty, or D > w0d/8τl. In addition, a certain number of data points must be present in the autocorrelation function before it decays to zero to obtain a significant fit. This usually means that one should have τD >τP (i.e., D < w02/4τP) or τD > τl (i.e., D < w02/4τl) to be able to perform a meaningful fit of the autocorrelation function along or perpendicular to the scanning direction, respectively. Faster diffusion can be detected by RICS, but the detection will then rely on the analysis of low-amplitude parts of the autocorrelation function, and will also depend on a good signal/noise ratio. All of the above limitations depend critically on the imaging conditions. For example, decreasing the pixel size (d) and increasing the pixel time (τP) and line time (τl) will provide sensitivity to slower motions, but will also reduce sensitivity to faster motions and at the same time increase the risk of artifacts due to photobleaching. Given the range of imaging conditions we explored, the RICS experiments presented here should be able to clearly detect diffusing motions in the range of ∼100–4000 μm2/s in pixel-to-pixel correlations, and ∼0.1–10 μm2/s in line-to-line correlations.
Cellular mobility of Ran
In the case of Ran, it is clear from the FCS and RICS experiments that at least a fraction of the protein diffuses with D >> 1 μm2/s, and therefore raster-scanning FRAP experiments cannot fully capture the motion of the protein. Thus, the value of the diffusion coefficient returned by naively analyzing the FRAP recovery curve, D ∼ 0.5 μm2/s, should only be considered as a lower limit for the average diffusion coefficient of Ran. However, the analysis of our FRAP data shows that there is no significant immobile fraction of EYFP-Ran. This result is in agreement with a previous observation that fluorescence due to nuclear dye-labeled Ran can be completely depleted by photobleaching cytoplasmic fluorescent Ran in the same cell (12). On the other hand, based on the photobleaching losses observed during continuous confocal spot excitation of dye-labeled Ran injected to cells, Paradise et al. (18) reported an immobile fraction of fluorescent Ran in nuclei (33 ± 13%) and cytoplasm (29 ± 28%). However, it is likely that the decrease in fluorescence they observed was due to the bleaching of mobile Ran molecules, since fluorescence excitation of a limited pool of fluorophores present within a single cell is known to result in an overall decrease of fluorescence even for mobile particles (45). Because of the timescale of our FRAP experiments, and our nonselective choice of measurement sites in the cytoplasm and nuclei, our experiments do not exclude the possibility that small populations of Ran are locally immobilized on rare cellular structures. A small fraction of Ran was previously detected in association with centrosomes (46), but it is not known how stable this localization is.
For EYFP, a virtually identical high diffusion coefficient was detected by RICS and FCS (∼20 μm2/s), indicating that the control protein is freely diffusing in cells, as anticipated. A similar diffusion coefficient for EGFP expressed in HeLa cells (23 ± 5 μm2/s) was detected by FCS (47), and for EGFP expressed in CHO-K1 cells (21 ± 5 μm2/s) by RICS (31). The diffusion coefficient of the control protein EYFP falls within the acceptable range for both FCS and RICS, and therefore the agreement between the two techniques is very good. However, for RICS measurements under our conditions, this mobility falls within a “blind spot” where the protein is too slow to be detected in pixel-to-pixel correlations, and too fast to be clearly detected in line-to-line correlations. Therefore, there is a high standard deviation associated with the value of the diffusion coefficient of EYFP as measured by RICS (Fig. 7).
According to our FCS measurement, the majority of the EYFP-Ran proteins throughout the cells displayed mobility with a diffusion coefficient of 15–17 μm2/s. If Ran behaved in cells as an inert molecule similar to EYFP, the diffusion coefficient of free EYFP-Ran (52 kDa) would be ∼20–50% slower than that of EYFP (25 kDa), depending on the geometry of the fusion protein. Therefore, the observed large fractions of rapidly diffusing EYFP-Ran molecules likely correspond to EYFP-Ran in either unbound form or present in small complexes. Of interest, our FCS measurements also showed the presence of a second population of EYFP-Ran molecules that displayed a reduced mobility. In the cytoplasm this population was quite small (∼10%), consistent with the lack of known stable cytoplasmic ligands for the (presumably) mostly GDP- bound cytoplasmic Ran. In the nucleus, on the other hand, the slow-moving fraction represented a significant percentage (∼30%) of the Ran population. In the analysis of our RICS data, a characteristic signature of the slower mobile population of EYFP-Ran was the presence of obvious line-to-line correlations (clearly visible in Fig. 7 A for EYFP-Ran, but not for EYFP in Fig. 7 B).
The average diffusion constant of nuclear EYFP-Ran estimated based on FCS data was D ∼ 12 μm2/s, as compared to the RICS measurement-based estimate of D ∼ 5 μm2/s. There could be several reasons for this discrepancy. First, it may simply be due to the fact that the notion of the average coefficient is not well defined in the case of complex motions, such as those undergone by Ran. Second, FCS data indicate that the slow dynamic component of Ran motions corresponds to a range of mobilities (see Fig. 5). Photobleaching could bias the results, showing processes as faster than they really are. However, we paid great attention to this problem and could not detect any overall decrease in fluorescence signal over the course of many consecutive FCS measurements, a sign that photobleaching should have been negligible. Since the fast diffusive motion of EYFP-Ran was in the “blind spot” of the RICS measurements, it is more likely that the one-component fit we performed was biased toward the clearly detected slow-dynamics component of the motion of EYFP-Ran. It would, of course, be very interesting to be able to perform more complicated fits on the RICS data. However, we found that because of the noise present in the data, two-component models gave an unstable fit, which kept us from fully exploiting the potential of this technique.
The results from both the two-component and stick-and-diffuse models we applied to analyze our FCS data show that at any time ∼30% nuclear EYFP-Ran was involved in molecular interactions. This leaves ∼70% of the nuclear EYFP-Ran freely diffusing, as compared to 89% in the cytoplasm. Taking into account the measured 3.9 nucleus/cytoplasm EYFP-Ran concentration ratio, the concentration of freely diffusing Ran in the nucleus can then be estimated to be threefold higher than in the cytoplasm. This is not at all what one would expect if a retention mechanism were the only cause of Ran nuclear accumulation. Our results therefore highlight the importance of Ran's active nuclear import.
The unbinding rate of EYFP-Ran extracted using the stick-and-diffuse model (koff = 31 s−1) was intriguingly comparable to the dissociation rate of the Ran-RCC1 complex (55 s−1) (48). However, the nuclear RCC1 concentration is estimated to be only ∼0.4 μM (48,49), and therefore can account for only a fraction of the EYFP-Ran nuclear interactions detected by FCS. Because the majority of Ran nuclear interactions likely represent RanGTP binding to multiple NTRs that are presumably very stable in the absence of RanGAP and RanBP1, the two-component diffusion model likely better represents the behavior of the nuclear Ran population.
Nuclear versus cytoplasmic localization
The mostly nuclear localization of Ran is widely documented, but has not often been carefully quantified. To date, two types of techniques had been applied to monitor Ran localization in vertebrate cells: detection of endogenous Ran by antibodies in fixed cells, and detection of fluorescently labeled exogenous Ran by live cell imaging. Our fluorescence intensity measurements showed that EYFP-Ran concentration was on average 3.9 ± 0.4 times larger in nuclei than in the cytoplasm. Of importance, this result was corroborated by an N&B analysis showing that the EYFP-Ran molecular fluorescence brightness was constant throughout the cell. The high nuclear accumulation of EYFP-Ran we detected was slightly higher than the nuclear/cytoplasmic intensity ratio in microinjected dye-labeled Ran imaged in live HeLa cells (∼1.9–3.5 depending on the labeled Ran concentration) (12). It was also higher than the nuclear/cytoplasmic ratio detected for endogenous Ran by immunofluorescence in fixed HeLa cells, which we found to be 3.1 ± 0.5, and was previously reported to be 2.4 by Kelley and Paschal (17). However, the decrease in the nuclear/cytoplasmic ratio and disappearance of the NE localization of EYFP-Ran we observed for cells expressing EYFP-Ran after fixation (using different fixation protocols) suggests that commonly used fixation methods do not prevent the dislocation of most NE-bound Ran and the potential leakage of a fraction of nuclear Ran to the cytoplasm. In the future, live imaging of endogenous fluorescently labeled Ran in cells, such as by using RNAi-assisted Ran gene replacement with a small molecule tag-labeled Ran (39), could be used to validate our results obtained with transiently expressed EYFP-Ran.
Accumulation at the NE
Our observation of the EYFP-tagged wtRan accumulating at the NE agrees with previous live imaging studies performed with microinjected dye-labeled wtRan (12,16,18). Given an estimated nuclear concentration CN ∼ 6 μM of endogenous wtRan in HeLa cells (12,13,15), and the 1.3 average NE/nuclear fluorescence intensity ratio measured by image fluorescence intensity analysis, we estimated that endogenous Ran must exist at the NE at an average surface concentration CNE ∼ 800 molecules of Ran/μm2 NE. However, EYFP-Ran was not distributed evenly at the NE, and most of its signal was concentrated in small clusters that likely corresponded to individual NPCs (Figs. 1 A and 2 A). Therefore, the majority of EYFP-Ran molecules at the NE appear to be present at NPCs where the N&B analysis indicated a 3- to 3.5-fold higher EYFP-Ran concentration compared to the nucleoplasm. Taking into account the estimated ∼4 NPC/μm2 surface density of NPCs at the NE (50), we calculate that ∼200 endogenous wtRan molecules are concentrated around each NPC in HeLa cells.
Several possible sources of error are associated with this estimate. First, our calculation is based on average pixel fluorescence intensity values, which can be influenced by photobleaching. Second, the assumed geometry and position of the NE may differ from what they are in reality; for example, the NE may not be exactly in the center of the detection volume for all measured pixels. Third, the final estimate of the number of wtRan around each nuclear pore relies on published data on the nuclear concentration of endogenous Ran and the surface concentration of NPCs, which may have significant errors attached to them. On the other hand, the method we employed to estimate the NE concentration of Ran does not involve any external calibration of the molecular fluorescence of EYFP-Ran, and instead is based on a comparison between fluorescence pixel values in different cellular compartments. Therefore, as long as the properties of the fluorophore remain the same throughout the cell, which the N&B analysis seems to indicate is true, our estimate is not influenced by phenomena such as short- or long-term blinking of the fluorophore. Finally, although the size and shape of the confocal volume may be ill-defined because of optical aberrations, the geometry of the system enters the calculation only as a ratio between the detection volume and the membrane surface area, which should always be well approximated by w0. Therefore, a deformation of the detection volume due to optical aberrations would only influence the result of the calculation through w0. In the end, our conclusion that there are 200 endogenous Ran molecules per NPC should be regarded as an order-of-magnitude estimate rather than an exact number. It remains significant, however, that this estimate is 1 order of magnitude larger than a previous estimate obtained in B104 neuroblastoma cells (18).
The transport capacity of a single NPC, and therefore the flux of Ran across a single NPC, has been estimated to be f ∼ 103 molecules/s (51). From this, one can estimate the average number of Ran molecules residing inside a pore at any given time to be ∼fτ, where τ is the residence time in the pore. Considering that τ is on the order of 1–50 ms, based on the range of residence times reported in the literature for cargos and on our own estimate of the residence time of Ran at the NE (discussed below), we therefore expect the number of Ran inside each NPC to be between 1 and 50. Our measurements suggest the presence of at least fourfold more Ran (∼200) in the vicinity of each NPC. Also taking into consideration the diffuse-spot pattern of YFP-Ran localization along the NE, we conclude that the Ran concentrated along the NE likely corresponds to the sum of Ran transiting through the NPC channels and Ran transiently interacting with the NPCs.
Finally, the EYFP-Ran residence time we measured (∼33 ms) was longer than the average transit times through NPCs previously measured for other proteins in studies using single-particle tracking in permeabilized cells (∼6 ms for NTF2, ∼7 ms for transportin 1, and 1–10 ms for a fluorescent NLS fusion protein, depending on the importin β concentration (50,52,53)). This suggests that Ran spends more time around NPCs than the transport cargos it regulates, consistent with the idea that a significant fraction of the Ran observed at NPCs, does not participate in the transitions through NPC channels. It is possible that Ran accumulating at the nuclear face of NPCs facilitates termination of nuclear import reactions, e.g., through Nup50/Npap60-assisted dissociation of importin β cargos (54). On the cytoplasmic NPC face, Ran could accumulate due to RanGTP and RanGTP-NTR complex binding to Ran-binding domains of RanBP2, a 358 kD nucleoporin forming cytoplasmic NPC fibers, before GTP hydrolysis on Ran catalyzed by RanGAP bound to RanBP2 via its SUMO tag (55,56).
Conclusions
Our analyses of live interphase HeLa cells expressing EYFP-Ran suggest that the majority of Ran molecules throughout the cells display the high mobility that would be expected in the unbound state, and that no quantitatively significant immobile Ran fractions are present in cells. Consistent with the presence of a large number of binding partners available to RanGTP in nuclei, we found that ∼30% of nuclear Ran molecules were engaged in molecular interactions at any time, compared to ∼10% interacting cytoplasmic Ran. The resulting gradient of the overall Ran diffusion coefficient (∼12 μm2/s vs. 14 μm2/s) across the NE is too small to account for the accumulation of ∼70% cellular Ran in the nucleus, highlighting the importance of Ran's active nuclear import. Finally, our results suggest that a large fraction of the ∼200 endogenous Ran molecules present at each NPC do not directly participate in transition through the NPC channel.
Acknowledgments
We thank Enrico Gratton and Michelle Digman for enlightening discussions and for their help with the use of the SimFCS software. We also thank Corrie Griffiths and Tony Collins for technical assistance.
This work was funded by the Natural Sciences and Engineering Research Council of Canada. C. F. is the recipient of a Canada Research Chair.
References
- 1.Clarke P.R., Zhang C. Spatial and temporal coordination of mitosis by Ran GTPase. Nat. Rev. Mol. Cell Biol. 2008;9:464–477. doi: 10.1038/nrm2410. [DOI] [PubMed] [Google Scholar]
- 2.Kalab P., Heald R. The RanGTP gradient—a GPS for the mitotic spindle. J. Cell Sci. 2008;121:1577–1586. doi: 10.1242/jcs.005959. [DOI] [PMC free article] [PubMed] [Google Scholar]
- 3.Weis K. Regulating access to the genome: nucleocytoplasmic transport throughout the cell cycle. Cell. 2003;112:441–451. doi: 10.1016/s0092-8674(03)00082-5. [DOI] [PubMed] [Google Scholar]
- 4.Kalab P., Weis K., Heald R. Visualization of Ran-GTP gradient in interphase and mitotic Xenopus egg extracts. Science. 2002;295:2452–2456. doi: 10.1126/science.1068798. [DOI] [PubMed] [Google Scholar]
- 5.Nemergut M.E., Mizzen C.A., Stukenberg T., Allis C.D., Macara I.G. Chromatin docking and exchange activity enhancement of RCC1 by histones H2A and H2B. Science. 2001;292:1540–1543. doi: 10.1126/science.292.5521.1540. [DOI] [PubMed] [Google Scholar]
- 6.Chen T., Muratore T.L., Schaner-Tooley C.E., Shabanowitz J., Hunt D.F. N-terminal α-methylation of RCC1 is necessary for stable chromatin association and normal mitosis. Nat. Cell Biol. 2007;9:596–603. doi: 10.1038/ncb1572. [DOI] [PMC free article] [PubMed] [Google Scholar]
- 7.Hood F.E., Clarke P.R. RCC1 isoforms differ in their affinity for chromatin, molecular interactions and regulation by phosphorylation. J. Cell Sci. 2007;120:3436–3445. doi: 10.1242/jcs.009092. [DOI] [PubMed] [Google Scholar]
- 8.Hutten S., Flotho A., Melchior F., Kehlenbach R.H. The Nup358-RanGAP complex is required for efficient Importin {α}/{β}-dependent nuclear import. Mol. Biol. Cell. 2008;19:2300–2310. doi: 10.1091/mbc.E07-12-1279. [DOI] [PMC free article] [PubMed] [Google Scholar]
- 9.Terry L.J., Wente S.R. Nuclear mRNA export requires specific FG nucleoporins for translocation through the nuclear pore complex. J. Cell Biol. 2007;178:1121–1132. doi: 10.1083/jcb.200704174. [DOI] [PMC free article] [PubMed] [Google Scholar]
- 10.Hetzer M., Gruss O.J., Mattaj I.W. The Ran GTPase as a marker of chromosome position in spindle formation and nuclear envelope assembly. Nat. Cell Biol. 2002;4:E177–E184. doi: 10.1038/ncb0702-e177. [DOI] [PubMed] [Google Scholar]
- 11.Fried H., Kutay U. Nucleocytoplasmic transport: taking an inventory. Cell. Mol. Life Sci. 2003;60:1659–1688. doi: 10.1007/s00018-003-3070-3. [DOI] [PMC free article] [PubMed] [Google Scholar]
- 12.Smith A.E., Slepchenko B.M., Schaff J.C., Loew L.M., Macara I.G. Systems analysis of Ran transport. Science. 2002;295:488–491. doi: 10.1126/science.1064732. [DOI] [PubMed] [Google Scholar]
- 13.Gorlich D., Seewald M.J., Ribbeck K. Characterization of Ran-driven cargo transport and the RanGTPase system by kinetic measurements and computer simulation. EMBO J. 2003;22:1088–1100. doi: 10.1093/emboj/cdg113. [DOI] [PMC free article] [PubMed] [Google Scholar]
- 14.Ren M., Drivas G., D'Eustachio P., Rush M.G. Ran/TC4: a small nuclear GTP-binding protein that regulates DNA synthesis. J. Cell Biol. 1993;120:313–323. doi: 10.1083/jcb.120.2.313. [DOI] [PMC free article] [PubMed] [Google Scholar]
- 15.Bischoff F.R., Ponstingl H. Mitotic regulator protein RCC1 is complexed with a nuclear ras-related polypeptide. Proc. Natl. Acad. Sci. USA. 1991;88:10830–10834. doi: 10.1073/pnas.88.23.10830. [DOI] [PMC free article] [PubMed] [Google Scholar]
- 16.Hinkle B., Slepchenko B., Rolls M.M., Walther T.C., Stein P.A. Chromosomal association of Ran during meiotic and mitotic divisions. J. Cell Sci. 2002;115:4685–4693. doi: 10.1242/jcs.00136. [DOI] [PubMed] [Google Scholar]
- 17.Kelley J.B., Paschal B.M. Hyperosmotic stress signaling to the nucleus disrupts the Ran gradient and the production of RanGTP. Mol. Biol. Cell. 2007;18:4365–4376. doi: 10.1091/mbc.E07-01-0089. [DOI] [PMC free article] [PubMed] [Google Scholar]
- 18.Paradise A., Levin M.K., Korza G., Carson J.H. Significant proportions of nuclear transport proteins with reduced intracellular mobilities resolved by fluorescence correlation spectroscopy. J. Mol. Biol. 2007;365:50–65. doi: 10.1016/j.jmb.2006.09.08. [DOI] [PMC free article] [PubMed] [Google Scholar]
- 19.Ribbeck K., Lipowsky G., Kent H.M., Stewart M., Gorlich D. NTF2 mediates nuclear import of Ran. EMBO J. 1998;17:6587–6598. doi: 10.1093/emboj/17.22.6587. [DOI] [PMC free article] [PubMed] [Google Scholar]
- 20.Lounsbury K.M., Richards S.A., Perlungher R.R., Macara I.G. Ran binding domains promote the interaction of Ran with p97/β-karyopherin, linking the docking and translocation steps of nuclear import. J. Biol. Chem. 1996;271:2357–2360. doi: 10.1074/jbc.271.5.2357. [DOI] [PubMed] [Google Scholar]
- 21.Gorlich D., Dabrowski M., Bischoff F.R., Kutay U., Bork P. A novel class of RanGTP binding proteins. J. Cell Biol. 1997;138:65–80. doi: 10.1083/jcb.138.1.65. [DOI] [PMC free article] [PubMed] [Google Scholar]
- 22.Gorlich D., Pante N., Kutay U., Aebi U., Bischoff F.R. Identification of different roles for RanGDP and RanGTP in nuclear protein import. EMBO J. 1996;15:5584–5594. [PMC free article] [PubMed] [Google Scholar]
- 23.Bilbao-Cortes D., Hetzer M., Langst G., Becker P.B., Mattaj I.W. Ran binds to chromatin by two distinct mechanisms. Curr. Biol. 2002;12:1151–1156. doi: 10.1016/s0960-9822(02)00927-2. [DOI] [PubMed] [Google Scholar]
- 24.Adam S.A. The nuclear pore complex. Genome Biol. 2001;2 doi: 10.1186/gb-2001-2-9-reviews0007. REVIEWS0007. [DOI] [PMC free article] [PubMed] [Google Scholar]
- 25.Soumpasis D.M. Theoretical analysis of fluorescence photobleaching recovery experiments. Biophys. J. 1983;41:95–97. doi: 10.1016/S0006-3495(83)84410-5. [DOI] [PMC free article] [PubMed] [Google Scholar]
- 26.Weiss M. Challenges and artifacts in quantitative photobleaching experiments. Traffic. 2004;5:662–671. doi: 10.1111/j.1600-0854.2004.00215.x. [DOI] [PubMed] [Google Scholar]
- 27.Dalal R.B., Digman M.A., Horwitz A.F., Vetri V., Gratton E. Determination of particle number and brightness using a laser scanning confocal microscope operating in the analog mode. Microsc. Res. Tech. 2008;71:69–81. doi: 10.1002/jemt.20526. [DOI] [PubMed] [Google Scholar]
- 28.Digman M.A., Dalal R., Horwitz A.F., Gratton E. Mapping the number of molecules and brightness in the laser scanning microscope. Biophys. J. 2008;94:2320–2332. doi: 10.1529/biophysj.107.114645. [DOI] [PMC free article] [PubMed] [Google Scholar]
- 29.Banks D.S., Fradin C. Anomalous diffusion of proteins due to molecular crowding. Biophys. J. 2005;89:2960–2971. doi: 10.1529/biophysj.104.051078. [DOI] [PMC free article] [PubMed] [Google Scholar]
- 30.Yeung C., Shtrahman M., Wu X.L. Stick-and-diffuse and caged diffusion: a comparison of two models of synaptic vesicle dynamics. Biophys. J. 2007;92:2271–2280. doi: 10.1529/biophysj.106.081794. [DOI] [PMC free article] [PubMed] [Google Scholar]
- 31.Digman M.A., Sengupta P., Wiseman P.W., Brown C.M., Horwitz A.R. Fluctuation correlation spectroscopy with a laser-scanning microscope: exploiting the hidden time structure. Biophys. J. 2005;88:L33–L36. doi: 10.1529/biophysj.105.061788. [DOI] [PMC free article] [PubMed] [Google Scholar]
- 32.Digman M.A., Brown C.M., Sengupta P., Wiseman P.W., Horwitz A.R. Measuring fast dynamics in solutions and cells with a laser scanning microscope. Biophys. J. 2005;89:1317–1327. doi: 10.1529/biophysj.105.062836. [DOI] [PMC free article] [PubMed] [Google Scholar]
- 33.Brown C.M., Dalal R.B., Hebert B., Digman M.A., Horwitz A.R. Raster image correlation spectroscopy (RICS) for measuring fast protein dynamics and concentrations with a commercial laser scanning confocal microscope. J. Microsc. 2008;229:78–91. doi: 10.1111/j.1365-2818.2007.01871.x. [DOI] [PMC free article] [PubMed] [Google Scholar]
- 34.Griesbeck O., Baird G.S., Campbell R.E., Zacharias D.A., Tsien R.Y. Reducing the environmental sensitivity of yellow fluorescent protein. Mechanism and applications. J. Biol. Chem. 2001;276:29188–29194. doi: 10.1074/jbc.M102815200. [DOI] [PubMed] [Google Scholar]
- 35.Qian H., Elson E.L. Distribution of molecular aggregation by analysis of fluctuation moments. Proc. Natl. Acad. Sci. USA. 1990;87:5479–5483. doi: 10.1073/pnas.87.14.5479. [DOI] [PMC free article] [PubMed] [Google Scholar]
- 36.Reits E.A., Neefjes J.J. From fixed to FRAP: measuring protein mobility and activity in living cells. Nat. Cell Biol. 2001;3:E145–E147. doi: 10.1038/35078615. [DOI] [PubMed] [Google Scholar]
- 37.Schwille P., Korlach J., Webb W. Fluorescence correlation spectroscopy with single-molecule sensitivity on cell and model membranes. Cytometry. 1999;36:176–182. doi: 10.1002/(sici)1097-0320(19990701)36:3<176::aid-cyto5>3.0.co;2-f. [DOI] [PubMed] [Google Scholar]
- 38.Kim S.A., Heinze K.G., Schwille P. Fluorescence correlation spectroscopy in living cells. Nat. Methods. 2007;4:963–973. doi: 10.1038/nmeth1104. [DOI] [PubMed] [Google Scholar]
- 39.Martin B.R., Giepmans B.N., Adams S.R., Tsien R.Y. Mammalian cell-based optimization of the biarsenical-binding tetracysteine motif for improved fluorescence and affinity. Nat. Biotechnol. 2005;23:1308–1314. doi: 10.1038/nbt1136. [DOI] [PubMed] [Google Scholar]
- 40.Meyvis T.K.L., De Smedt S.C., Van Oostveldt P., Demeester J. Fluorescent recovery after photobleaching: a versatile tool for mobility and interaction measurements in pharmaceutical research. Pharm. Res. 1999;16:1153–1162. doi: 10.1023/a:1011924909138. [DOI] [PubMed] [Google Scholar]
- 41.Waharte F., Brown C.M., Coscoy S., Coudrier E., Amblard F. A two-photon FRAP analysis of the cytoskeleton dynamics in the microvilli of intestinal cells. Biophys. J. 2005;88:1467–1478. doi: 10.1529/biophysj.104.049619. [DOI] [PMC free article] [PubMed] [Google Scholar]
- 42.Braga J., Desterro J.M.P., Carmo-Fonseca M. Intracellular macromolecular mobility measured by fluorescence recovery after photobleaching with confocal laser scanning microscopes. Mol. Biol. Cell. 2004;15:4749–4760. doi: 10.1091/mbc.E04-06-0496. [DOI] [PMC free article] [PubMed] [Google Scholar]
- 43.Widengren J., Rigler R. Mechanisms of photobleaching investigated by fluorescence correlation spectroscopy. Bioimaging. 1996;4:149–157. [Google Scholar]
- 44.Digman M.A., Gratton E. Analysis of diffusion and binding in cells using the RICS approach. Microsc. Res. Tech. 2009;72:323–332. doi: 10.1002/jemt.20655. [DOI] [PMC free article] [PubMed] [Google Scholar]
- 45.Delon A., Usson Y., Derouard J., Biben T., Souchier C. Continuous photobleaching in vesicles and living cells: a measure of diffusion and compartmentation. Biophys. J. 2006;90:2548–2562. doi: 10.1529/biophysj.105.069815. [DOI] [PMC free article] [PubMed] [Google Scholar]
- 46.Keryer G., Di Fiore B., Celati C., Lechtreck K.F., Mogensen M. Part of Ran is associated with AKAP450 at the centrosome: involvement in microtubule-organizing activity. Mol. Biol. Cell. 2003;14:4260–4271. doi: 10.1091/mbc.E02-11-0773. [DOI] [PMC free article] [PubMed] [Google Scholar]
- 47.Chen Y., Muller J.D., Ruan Q., Gratton E. Molecular brightness characterization of EGFP in vivo by fluorescence fluctuation spectroscopy. Biophys. J. 2002;82:133–144. doi: 10.1016/S0006-3495(02)75380-0. [DOI] [PMC free article] [PubMed] [Google Scholar]
- 48.Klebe C., Prinz H., Wittinghofer A., Goody R.S. The kinetic mechanism of Ran–nucleotide exchange catalyzed by RCC1. Biochemistry. 1995;34:12543–12552. doi: 10.1021/bi00039a008. [DOI] [PubMed] [Google Scholar]
- 49.Klebe C., Bischoff F.R., Ponstingl H., Wittinghofer A. Interaction of the nuclear GTP-binding protein Ran with its regulatory proteins RCC1 and RanGAP1. Biochemistry. 1995;34:639–647. doi: 10.1021/bi00002a031. [DOI] [PubMed] [Google Scholar]
- 50.Yang W., Gelles J., Musser S.M. Imaging of single-molecule translocation through nuclear pore complexes. Proc. Natl. Acad. Sci. USA. 2004;101:12887–12892. doi: 10.1073/pnas.0403675101. [DOI] [PMC free article] [PubMed] [Google Scholar]
- 51.Ribbeck K., Gorlich D. Kinetic analysis of translocation through nuclear pore complexes. EMBO J. 2001;20:1320–1330. doi: 10.1093/emboj/20.6.1320. [DOI] [PMC free article] [PubMed] [Google Scholar]
- 52.Kubitscheck U., Grunwald D., Hoekstra A., Rohleder D., Kues T. Nuclear transport of single molecules: dwell times at the nuclear pore complex. J. Cell Biol. 2005;168:233–243. doi: 10.1083/jcb.200411005. [DOI] [PMC free article] [PubMed] [Google Scholar]
- 53.Yang W., Musser S.M. Nuclear import time and transport efficiency depend on Importin B concentration. J. Cell Biol. 2006;174:951–961. doi: 10.1083/jcb.200605053. [DOI] [PMC free article] [PubMed] [Google Scholar]
- 54.Lindsay M.E., Plafker K., Smith A.E., Clurman B.E., Macara I.G. Npap60/Nup50 is a tri-stable switch that stimulates Importin-α:β-mediated nuclear protein import. Cell. 2002;110:349–360. doi: 10.1016/s0092-8674(02)00836-x. [DOI] [PubMed] [Google Scholar]
- 55.Yaseen N.R., Blobel G. Two distinct classes of Ran-binding sites on the nucleoporin Nup-358. Proc. Natl. Acad. Sci. USA. 1999;96:5516–5521. doi: 10.1073/pnas.96.10.5516. [DOI] [PMC free article] [PubMed] [Google Scholar]
- 56.Yokoyama N., Hayashi N., Seki T., Panté N., Ohba T. A giant nucleopore protein that binds Ran/TC4. Nature. 1995;376:184–188. doi: 10.1038/376184a0. [DOI] [PubMed] [Google Scholar]