

Abstract
Change in the permeability of the mitochondrial membrane to proteins (cytochrome c and Smac) and protons is a critical step in apoptosis. Although the time from the induction of apoptosis to the change of mitochondrial permeability is variable over a period of hours, the release of proteins is an “all or none” phenomenon that is completed in an individual cell within minutes. Here, using single-cell fluorescence microscopy, we show that the release of cytochrome c from a single mitochondrion occurs in a single step. However, this increased permeability of the outer membrane to cytochrome c propagates throughout the cell as a slower, spatially coordinated wave. The permeability of the outer membrane to Smac propagates with the same spatial pattern but lagging in time. This is followed by a wave of increased permeability of the inner membrane to protons. Only afterward do the mitochondria fission. The spatial dependence of the permeability wave was inhibited by thapsigargin, an inhibitor of the endoplasmic reticulum calcium pumps, but buffering cytosolic calcium had no effect. These results show that the trigger for apoptosis is spatially localized, initiating at one or only a few mitochondria preceding the loss of mitochondrial energetics, and the subsequent temporal propagation of mitochondrial membrane permeability is calcium-dependent.
Introduction
Apoptosis is a mode of programmed cell death that is essential to development and organism homeostasis (1). The onset of apoptosis is marked by fragmentation of DNA and the activation of caspases (2,3). Mitochondria play a central role in apoptosis, integrating signals from members of the Bcl-2 family (4), Opa (5), and Parl (6), among several others. It has been proposed that mitochondria integrate these signals, resulting in fragmentation and changes in membrane permeability to protons (7) and proapoptotic proteins, including cytochome c and Smac.
Once released from the mitochondria, cytochrome c interacts with Apaf-1, resulting in the activation of caspases that in turn cleave several vital substrates, leading to biochemical and morphological features characteristic of apoptosis (8). Membrane permeability to cytochrome c is considered a critical step in the progression of apoptosis. Along with cytochrome c, Smac is also released into the cytosol (9). Once in the cytosol, Smac induces degradation of the inhibitor of apoptosis proteins (IAPs), thereby facilitating caspase activation (10). Around the same time, the mitochondrial intermembrane becomes permeable to protons, causing loss of membrane potential (ΔΨm) (9), and the mitochondria are observed to fragment and undergo changes to their internal structure (5,11). The extent to which this fragmentation plays a role in cytochrome c release is unclear (12). Furthermore, the precise temporal order of these events is not completely resolved (12,13).
The increased permeability of the mitochondrial membrane to cytochrome c is considered to be a critical step in the progression of apoptosis. Although cytochrome c may be released in different cells at any time over a period of several hours, its release within a single cell is completed within several minutes (14). Thus, one of the major barriers to imaging the dynamics of apoptosis is that its onset is so variable that when imaging is done at high temporal resolution, fluorescent tags are usually bleached before apoptosis is initiated. This has limited the ability to resolve whether cytochrome c and Smac are released at different times or simultaneously (9), or whether the increase in permeability of the outer (15) or inner (16) membrane occurs first. A recent study (17) demonstrated the release of cytochrome c at high temporal resolution; however, the successful imaging of cytochrome c release in single cells was a rare event. Here, we developed a method to reproducibly image mitochondrial events with high spatial and temporal resolution. This novel technique allows investigation of the temporal ordering of mitochondrial changes during apoptosis in single cells. Our imaging technique opens the door for future investigations in which high spatial and temporal resolution will be necessary to detect small changes.
Our single-cell imaging approach shows that cytochrome c release can be initiated at one, two, or multiple points in a cell and then propagates across the cell. This behavior was observed for apoptosis induced by a number of different drugs. Cytochrome c release took place before Smac release and loss of ΔΨm, which also occurred in waves, lagging in time behind cytochrome c release. By analyzing individual mitochondria, we show that mitochondrial fission occurs after cytochrome c release. Additionally, we examine the dynamics of cytochrome c release from single mitochondria, showing that release occurs in a single step. Finally, we show that the wave of cytochrome c release can be inhibited by thapsigargin (a blocker of the SERCA calcium pumps) but not with BAPTA-AM, which buffers cytosolic calcium levels. These observations indicate that the signal for mitochondria to release cytochrome c, and, in some cases, the commitment to apoptosis does not take place simultaneously at all mitochondria, and does not occur spontaneously within the cell.
Materials and Methods
Culture conditions and the induction of apoptosis
HeLa and B16F0 cells were cultured in DMEM (Gibco Invitrogen, Carlsbad, CA) supplemented with 10% FBS and 1% penicillin in a 37°C, 5% CO2 incubator.
Apoptosis was induced with 50 μM etoposide (ETO; BioVision, Mountain View, CA), 1 μg/mL TNF-related apoptosis-inducing ligand (TRAIL; BioVision), or 2 μM staurosporine (STS; Sigma, St. Louis, MO). The drugs were thoroughly mixed with the cell media before application. Imaging of cells treated with STS or TRAIL began at the same time the drug was added. Imaging of ETO-treated cells began 16 h after the drug was added.
Expression plasmids and transfection
Plasmids (cytochrome c-GFP, Mito-mCherry, and Smac-mCherry) were transfected using Lipofectamine 2000 (Invitrogen, Carlsbad, CA). Tetramethylrhodamine ethyl ester (TMRE, 25 ng/mL; Molecular Probes, Invitrogen, Carlsbad, CA) was loaded for 15 min before drug addition. The cytochrome c-GFP vector was obtained from Douglas Green (St. Jude Children's Research Hospital) (14). Smac-mCherry was made by inserting mCherry in the place of CFP in the Smac-CFP vector (provided by Richard Youle, National Institutes of Health). mCherry (provided by Roger Tsien, University of California San Diego) was placed into a vector similar to EGFP-C1 (mCherry-C1, made by Florence Koeppel, Rockefeller University). mCherry was cut using EcoRI and XhoI restriction enzyme sites and inserted into the corresponding region of Smac-CFP. Mito-mCherry (a fluorescent fusion of the localization tag of cytochrome c oxidase IV) was made by inserting mCherry from mCherry-C1 in the place of DsRed in the mito-DsRed vector using the sites AgeI and XhoI (18).
Cells were transfected with cytochrome c-GFP 72 h before an experiment to allow time for proper cytochrome c-GFP localization. In experiments involving coexpression of Smac-mCherry or mito-mCherry, cells were transfected a second time 24 h before the experiment.
Microscopy
Cells were grown on glass-bottomed dishes (MatTek, Ashland, MA) and imaged in cell imaging media (CIM) (Hanks' BSS (Sigma) 9.8 g/L, 10 mM Hepes, 5% FBS, pH 7.4). Wide-field images were acquired using an Olympus IX-81 EPI-fluorescence microscope (Olympus, Center Valley, PA), a xenon light source, a 60× 1.2 NA water immersion objective, and an OrcaER CCD camera (Hamamatsu, Hamamatsu City, Japan). The microscope, filter wheels, and camera were controlled with Metamorph software (MDS Analytical Technologies, Toronto, Canada). The microscope was maintained at 37°C in an in-house-made chamber. The excitation and emission filters for each probe were GFP ex: HQ 470/40; GFP em: HQ 520/50; TMRE/mCherry ex: ET 577/25; and TMRE/mCherry em: ET 632/60. The dichroics used were GFP: 495 long pass and TMRE/mCherry: CFP/YFP/mCherry polychroic. All filters and dichroics were obtained from Chroma (Rockingham, VT). The images were recorded using exposure times of 100–300 ms.
Total internal reflection (TIR) images were collected on an Olympus IX70 microscope equipped with a prototype Olympus TIR combiner (through the objective); a 60× 1.45 NA objective; 488 nm (Spectra Physics, Newport Corporation, Irvine, CA) and 568 nm (Melles Griot, Albuquerque, NM) laser excitation for GFP and mCherry, respectively; a 488/568 polychroic mirror; a Cairn OptosplitIII image splitter (Cairn Research, Faversham, England) with a 580 lp dichroic to split the emission into two channels; emission filter ET 525/50 for GFP and ET 632/60 for mCherry; and an OrcaER CCD camera. The temperature was maintained at 37°C in an in-house-made chamber. The TIR microscope was controlled with Metamorph software. All filters and dichroics were obtained from Chroma. Images were acquired with an exposure time of 100–200 ms.
Confocal images were acquired with a Zeiss LSM 510 confocal microscope (Zeiss, Oberkochen, Germany). Cells were maintained at 37°C using a Warner heating chamber (Warner Instruments, Hamden, CT). All image acquisitions were performed with the wide-field microscope unless otherwise stated.
An area containing at least two transfected cells was imaged once every 2 min until one cell in the field of view released cytochrome c. Then the rate of imaging was increased to once every 10 s. For imaging of single mitochondria with TIR, the rate was then further increased to once every 400 ms.
BAPTA-AM and thapsigargin experiments required media changes during imaging. These experiments were performed in MatTek dishes, and media exchange was accomplished via syringes connected to thin tubing inserted through the top of the MatTek dish.
Untreated cells loaded with TMRE were imaged and used to set excitation intensity and exposure times that did not induce spontaneous mitochondrial depolarizations from free-radical production (19). Cells were imaged under experimental conditions in the absence of any apoptotic trigger, and no release of cytochrome c-GFP from the mitochondria was ever observed, indicating that the release of cytochrome c-GFP was not a consequence of the imaging conditions. Similar controls were conducted by treating cells with BAPTA-AM, thapsigargin, or both without triggering apoptosis.
Image analysis
Image analysis was performed with Metamorph software. Circular regions of interest (ROIs) with an area of 3 μm were selected on the cytochrome c-GFP image. Many ROIs were selected, such that a majority of the mitochondria were included within at least one ROI. If two probes were imaged simultaneously, the ROIs were then transferred to the other channel. The average intensity of each ROI over time was calculated. The time of release for the ROI was selected by eye as the time when the intensity began to decline irreversibly. If such a point could not be determined, the ROI was discarded. The x,y location of each ROI was recorded and the linear distances were calculated from the ROI in which the first cytochrome c release occurred (see Fig. S2 in the Supporting Material).
BAPTA-AM and thapsigargin experiments
BAPTA-AM (1 mM; Alexis) and thapsigargin (5 μM; Sigma) were used to alter calcium signaling. To reduce extracellular calcium levels, EGTA (1.2 mM; Sigma) was added to CIM.
We conducted three different experiments. The control experiment was the addition of TRAIL (1 μg/mL) and EGTA in CIM.
The second experiment required the addition of BAPTA-AM (1 mM) to quench cytosolic calcium. BAPTA-AM was not added at the beginning of the experiment; instead, it was delayed to minimize unintended consequences of the 1 mM concentration. TRAIL and EGTA were added to cells in CIM, and BAPTA-AM was added after the first cell released cytochrome c. During the addition, all media was removed from the MatTek dish and replaced with fresh CIM, TRAIL, EGTA, and BAPTA-AM. Analysis was conducted on cells that began to release cytochrome c at least 5 min after the addition of BAPTA-AM. Experiments using Fluo-3 (Invitrogen) showed that within 5 min of BAPTA-AM addition, calcium levels reached a decreased, stable level (data not shown).
Thapsigargin was added to cells to block the SERCA pumps. Previous studies in HeLa cells indicated that it takes thapsigargin ∼20 min to deplete endoplasmic reticulum (ER) calcium (20). Thapsigargin and EGTA were added to the CIM at the beginning of the experiment (before the addition of TRAIL). After 20 min, the medium was removed and replaced with CIM containing TRAIL, EGTA, and thapsigargin.
Results
Cytochrome c is released in a wave
Initiation of apoptosis in a population of cultured cells is asynchronous and distributed over several hours (14). This variability makes it difficult to image the relatively fast process of cytochrome c release in single cells with sufficient temporal resolution to discern release events from individual mitochondria while also limiting photodamage and photobleaching. Our anecdotal observations suggested that within a cluster of several HeLa cells, the release of cytochrome c-GFP was less asynchronous. Therefore, to obtain high temporal resolution, we imaged cell clusters once every 2 min until one cell in a field released cytochrome c-GFP. At this point, the acquisition rate was increased to once every 10 s.
An example of the dynamics of cytochrome c-GFP release in HeLa cells treated with TRAIL (1 μg/mL) is shown in images from a time-lapse experiment (Fig. 1 A and Movie S1). The release of cytochrome c-GFP was initiated at one end of the cell (indicated by the arrow), and in successive frames a wave of cytochrome c-GFP release swept across the cell. This continued for 90 s until cytochrome c-GFP was no longer localized to mitochondria in the cell. This result is consistent with previous studies that showed a spatial release of cytochrome c (17).
Figure 1.

Cytochrome c is released in a wave. HeLa cells were cotransfected with cytochrome c-GFP and mito-mCherry, and treated with TRAIL. Selected images are shown with the time of acquisition; t = 0 s indicates the first detected cytochrome c-GFP release. (A) Cytochrome c-GFP fluorescence. The arrow indicates the first release of cytochrome c-GFP. (B) Mito-mCherry fluorescence. (C) Color overlay of cytochrome c-GFP (green), mito-mCherry (red), and colocalization (yellow). (D) The normalized intensity for one ROI versus time for both cytochrome c-GFP (black +) and mito-mCherry (gray ×). (E) Graph of cytochrome c-GFP loss from four separate regions. (F) Plot showing the distance of regions from the first region to release as a function of time of release. All scale bars represent 5 μm.
To determine whether the loss of cytochrome c-GFP fluorescence was a result of mitochondria moving out of the plane of focus or a breakdown of the mitochondria, we monitored cytochrome c-GFP simultaneously with the mitochondrial marker mito-mCherry (18,21). During the loss of mitochondrial cytochrome c-GFP fluorescence, there were no detectable changes in the mito-mCherry fluorescence, which confirmed that we were monitoring the release of cytochrome c from the mitochondria and not the movement of mitochondria (Fig. 1, A–C). A wave of cytochrome c-GFP release was also observed by confocal microscopy (Fig. S1). The release of cytochrome c-GFP from mitochondria was quantified using the average intensity of GFP in ROIs (Fig. S2). Each ROI may contain more than one mitochondrion because it is not always possible to discern individual mitochondria in dense or out-of-focus regions of the cell. Therefore, the contents of ROIs are referred to as mitochondrial clusters. Most of the mitochondria in a cell were included within at least one ROI. In an individual ROI over time, the average intensity of the cytochrome c-GFP remained constant, and then dropped to the local background level within 30 s (Fig. 1 D). We defined the time of release of cytochrome c-GFP from an ROI as the point when the average intensity of the ROI began to decline irreversibly (Fig. S2). The spatial and temporal components of release are revealed by quantification of multiple ROIs in each cell (Fig. 1 E). A plot of the time of release as a function of the distance from the first ROI that released cytochrome c-GFP reveals a propagation of release across the cell (Fig. 1 F).
This analysis quantitatively shows that the cell-wide release of cytochrome c-GFP from mitochondria occurs as a propagating wave. To determine whether the wave of cytochrome c release is specific to a single mode of apoptosis, we observed the dynamics of cytochrome c release for cells treated with different agents that trigger apoptosis. Similar results were observed when apoptosis was induced with the death receptor ligand TRAIL (Fig. 1), protein kinase inhibitor STS (2 μM; Fig. 2), or the DNA damage-inducing drug ETO (50 μM; data not shown). The observation of the cytochrome c release wave in multiple modes of apoptosis indicates that the wave is a general subcellular feature of apoptosis.
Figure 2.

Three distinct patterns of cytochrome c release. Time-lapse images and quantification of cytochrome c-GFP release in HeLa cells treated with STS; t = 0 s indicates the first detected cytochrome c-GFP release. (A) Images of cytochrome c-GFP release starting at a single point in the cell and (B) the corresponding time-distance correlation plot. (C) Images of cytochrome c-GFP release starting at two points within the cell and (D) the corresponding time-distance correlation plot. (E) Images of cytochrome c-GFP release occurring randomly within the cell and (F) the corresponding time-distance correlation plot. Solid arrows indicate where cytochrome c-GFP release begins and the point from which all distances are measured. All scale bars represent 5 μm.
Patterns of cytochrome c release
While characterizing the release of cytochrome c, we observed three different patterns of release (Fig. 2). The first pattern is a wave initiated at a single point, with the release of cytochrome c propagating in one direction across the cell (Fig. 2, A and B). In the second pattern, two waves initiate at different points and propagate simultaneously across the cell (Fig. 2, C and D; Movie S2). The majority of cells treated with STS or ETO, and approximately half of the cells treated with TRAIL, had a directional (one- or two-point) pattern of release (Table 1). Waves initiating at one or two points were observed in cells of oblong or round morphology, indicating that cell shape did not induce a significant bias to the mode of release (Fig. S3 A).
Table 1.
Distribution of cytochrome c release patterns and total time of release
| ETO (n = 10) | STS (n = 12) | TRAIL (n = 20) | |
|---|---|---|---|
| One point | 187 ± 95 s (7) | 306 ± 207 s (4) | 94 ± 34 s (7) |
| Two points | - | 350 ± 93 s (5) | 115 ± 7 s (2) |
| Random | 66 ± 40 (3) | 163 ± 35 s (3) | 62 ± 27 s (11) |
| Total | 151 ± 93 s | 285 ± 154 s | 79 ± 34 s |
The total release time is measured from the first cytochrome c release until 95% of regions have released ± standard deviation in seconds. The number of cells for each condition is noted in parentheses.
In the third pattern of release, cytochrome c did not appear to be spatially coordinated, although, in similarity to the other patterns, cell-wide release was completed within minutes (Fig. 2, E and F, and Movie S3). This could result from 1), a wave initiating at the top of the cell, farthest from the coverslip, and propagating perpendicular to the imaging plane; 2), multiple spatially coordinated waves initiating at several points in the cell that we lack the spatial and temporal sensitivity to resolve; or 3), simply an uncoordinated release.
We observed all three patterns of cytochrome c release with apoptosis induced by TRAIL, STS, or ETO (Table 1), indicating that the spatial patterns of release are not restricted to a single apoptotic paradigm. Furthermore, the wave of cytochrome c release was also observed in murine melanoma B16F0 cells (data not shown), demonstrating that the wave phenomenon is not restricted to a single cell line. The release of cytochrome c in a wave that occurs at one, two, or multiple points in the cell indicates that the initial trigger of the cytochrome c release wave can occur independently at multiple spatially distinct points in a cell. This indicates that the biochemical precursor of cytochrome c release is not a homogenous event within the cell, and instead is an accumulation of activated factors at spatially localized points in the cell.
Loss of ΔΨm and Smac release
We next investigated the spatial and temporal relationships between events thought to be coincident with, or mechanistically linked to, cytochrome c release (9). We first observed the dynamics of cytochrome c release relative to the loss of mitochondrial inner membrane potential (ΔΨm) as monitored by TMRE. TMRE preferentially accumulates in actively respiring mitochodria (22), and during apoptosis TMRE is lost from the mitochondria at the same time as cytochrome c (9). Although TMRE loss is temporally proximal to the release of cytochrome c, it has been observed that the pan-caspase inhibitor zVAD-fmk can delay the loss of TMRE relative to cytochrome c-GFP (14).
After treatment with TRAIL, the release of cytochrome c-GFP from the mitochondria preceded the loss of ΔΨm (Fig. S3 and Movie S4). We quantified this by monitoring the release from a single ROI (Fig. 3 A), and by correlating the cytochrome c release and TMRE loss of all ROIs within a single cell (Fig. 3, B and C). In five cells we found that 146 of 150 ROIs released cytochrome c-GFP before ΔΨm loss (Fig. S4). The average time between cytochrome c release and ΔΨm loss in TRAIL-treated cells was 92 ± 47 s (Fig. S4), demonstrating that loss of ΔΨm is not necessary for and does not occur before cytochrome c release. In contrast to previous reports, these experiments were conducted in the absence of biochemical inhibitors (9,14). Loss of ΔΨm followed the same spatial patterns as cytochrome c release within the cell (Fig. 3 B). The time lag and spatial dependence of ΔΨm loss was also observed when apoptosis was induced by ETO or STS (data not shown).
Figure 3.
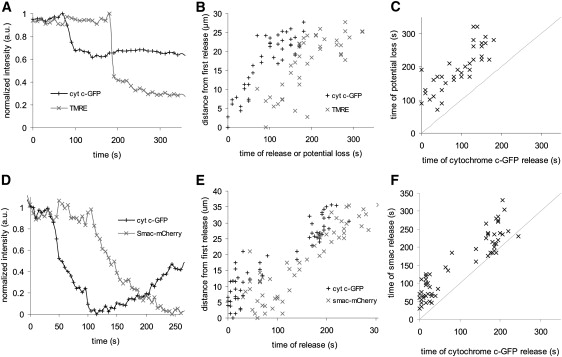
Loss of mitochondrial membrane potential and Smac release occur after cytochrome c release. (A) The average intensity in a single ROI of cytochrome c-GFP (black +) and TMRE (gray ×) versus time. (B) Plot of cytochrome c-GFP release and TMRE loss as a function of time. (C) Correlation of the time of cytochrome c-GFP release and the loss of potential for all regions. Dotted line indicates simultaneity. (D) The average intensity in a single ROI of cytochrome c-GFP (black +) and Smac-mCherry (gray ×) versus time. (E) Plot of cytochrome c-GFP release and Smac-mCherry release as a function of time. (F) Correlation of the time of cytochrome c-GFP release and the time of Smac-mCherry release for all regions. Dotted line indicates simultaneity.
Next, we observed the release of Smac, a mitochondrial protein that is released to the cytosol, where it promotes apoptosis by inducing the degradation of IAPs (10,23). Previous work indicated that the release of fluorescently tagged Smac is contemporaneous with cytochrome c-GFP release (9). By simultaneously monitoring Smac-mCherry and cytochrome c-GFP at faster rates than those used previously, we were able to observe that the release of Smac-mCherry followed the same spatial pattern as cytochrome c-GFP, but with a delay of 42 ± 29 s (Fig. 3, D–F, Fig. S3, Fig. S4, and Movie S5).
The delay observed between the Smac and cytochrome c waves could be a result of pores preferentially releasing cytochrome c and then Smac. However, a delay could also be caused if Smac is oligomerized with itself or another protein (23). The time between cytochrome c-GFP loss and loss of membrane potential could result from a delay associated with the breakdown of the electron transport chain, although there is evidence that loss of potential requires caspase activation (14,24).
We observed a delay between loss of ΔΨm and Smac release, relative to cytochrome c release, and all three events occurred in a similar spatial pattern. Although the release was distinct, the spatial and temporal similarity suggests that there is one underlying mechanism governing cytochrome c and Smac release and ΔΨm loss from individual mitochondria.
Mitochondrial fission
Next, we investigated the temporal relationship between cytochrome c release and mitochondrial fission using the mitochondrial marker mito-mCherry. Mitochondrial fission proteins have been implicated in cytochrome c release during apoptosis (25–27). Furthermore, mitochondrial fragmentation is reported to occur at the same time as or within minutes of cytochrome c release (27) (Fig. S5). To resolve the timing of these events, we monitored individual mitochondria, located primarily at the periphery of cells where they are spatially distinct. In HeLa cells treated with TRAIL, we observed that cytochrome c-GFP was released before mitochondrial fission occurred (24 mitochondria and nine cells; Fig. 4, A and B, Fig. S5, and Fig. S6).
Figure 4.
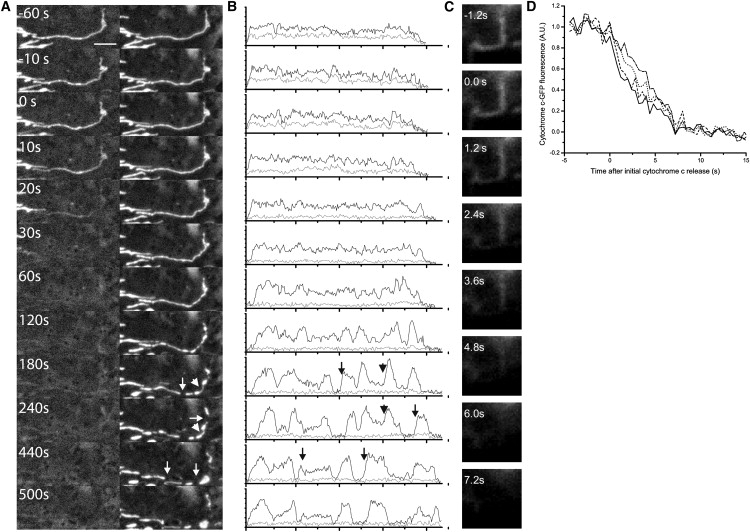
Mitochondrial fission and release of cytochrome c from single mitochondria. HeLa cells transfected with cytochrome c-GFP and mito-mCherry, and treated with TRAIL. (A) Images of cytochrome c release and mitochondrial fission. Cytochrome c release begins at time t = 0. Arrows indicate sites of fission; arrowheads indicate sites of morphological changes. (B) Line scans of mitochondria from A with mito-mCherry in black and cytochrome c-GFP in gray. Arrows indicate corresponding positions of arrows on image. (C) Release of cytochrome c-GFP from individual mitochondria as revealed by TIR microscopy. Cytochrome c release begins at time t = 0. (D) Quantification of cytochrome c release from different regions of the single mitochondria in C. Release appears to initiate at the same time throughout the mitochondria. Scale bars represent 5 μm.
Alterations in the mitochondrial morphology were observed in the time between cytochrome c release and mitochondrial fission for 15 of 23 mitochondria. The morphological alterations were characterized by the formation of multiple fluorescent aggregates with thinner intermediate connections (Fig. 4, A and B, Fig. S6, and Fig. S7). These fluorescent aggregates and intermediate connections were quantified with a line scan of mitochondria (Fig. 4 B). The size, distribution, and duration of these aggregates varied among mitochondria (data not shown).
The observation of altered mitochondrial morphology indicates that structural changes may precede mitochondria fission. These changes could be due to the restriction of mitochondria by proteins such as Fis1 and Drp1 (27), the formation of pores at the restriction sites (28), or the swelling of the inner membrane space (11).
Release of cytochrome c from individual mitochondria
We imaged cytochrome c release from individual mitochondria to determine whether release occurred in a single step, as a two-step process (29), or like a wave across each mitochondria. It has been shown that cytochrome c is localized to intracristae regions of the mitochondria with limited access to the intermembrane space (30). It is difficult to monitor the release of cytochrome c from individual mitochondria because of the variable onset of apoptosis within single cells, and the rapid release of cytochrome c from individual mitochondria. Furthermore, the density of mitochondria makes it very difficult to discern individual mitochondria in wide-field or confocal microscopy. To overcome the timing problem, we imaged several single cells once every minute, and once cytochrome c was released in a single cell, we monitored adjacent cells once every 10 s. We imaged those cells until cytochrome c release was detected in a single mitochondrion, and then we acquired images once every 400 ms.
For improved spatial resolution of individual mitochondria, we used TIR fluorescence microscopy (31), which illuminates only the very bottom of the cell within 200 nm of the coverslip. This allows imaging of a subset of mitochondria with limited out-of-focus background fluorescence. Under these conditions, we were able to monitor the cytochrome c-GFP intensity throughout the length of the mitochondria (Fig. 4 C). A decrease in cytochrome c-GFP fluorescence appeared to initiate at the same time throughout the entire mitochondria. A quantification of the fluorescence demonstrated that neither the time when cytochrome c release was initiated nor the time course of the release were functions of the position along the mitochondria (Fig. 4 D).
Wave inhibition: calcium and the wave
The spatial waves of release illustrate that cytochrome c is not simultaneously released from all mitochondria in a single cell. Potential mechanisms to explain the spatial coordination of cytochrome c release include the local activation of a precursor to release and a feed-forward loop that amplifies the initial loss of mitochondrial proteins. There is evidence suggesting a link between cytochrome c release, inositol 1,4,5 triphosphate receptor (IP3R), and ER calcium stores (32,33). This potential role for calcium is consistent with the ability of the Bcl-2 family to modulate cellular calcium levels (20,34,35), as well as the observation of calcium waves in apoptotic cells (36,37).
We tested whether disrupting calcium had an effect on the spatial and temporal characteristics of cytochrome c release. HeLa cells expressing cytochrome c-GFP were treated with TRAIL to induce apoptosis in the presence of extracellular EGTA (1.2 mM). As soon as one cell in the field released cytochrome c, BAPTA-AM (1 mM) was added to the bath. Calcium levels were stably reduced within 5 min of BAPTA-AM addition to the media (data not shown). The time required for 95% of the ROIs in a cell to release cytochrome c-GFP increased slightly from 112 ± 31 s for cells treated with TRAIL and EGTA to 153 ± 49 s (p = 0.025) for cells treated with BAPTA-AM (Fig. 5 A), and the kinetics of release were slightly delayed. There was a negligible change in the fraction of cells with a directional release (from 0.50 to 0.57; Fig. 5 B). The effects of thapsigargin (5 μM) were larger in magnitude and significance. The time required for a cell to release cytochrome c increased more than fourfold (112 ± 31 s to 511 ± 245 s, p = 2.2 × 10⁻⁶) in cells that were treated with thapsigargin (Fig. 5 A). Additionally, thapsigargin reduced the fraction of cells that showed directional release patterns from 0.5 to 0.053 (Fig. 5 B). Thus, thapsigargin both disrupted the spatial wave of cytochrome c release and increased the duration of release by >6 min. Thapsigargin is known to increase cytosolic calcium. To test whether the thapsigargin effect was due to a rise in cytosolic calcium, we repeated the experiment in cells treated with BAPTA-AM (1 mM) to chelate calcium released into the cytosol by thapsigargin treatment. The presence of BAPTA-AM had no detectable effect on the thapsigargin-induced loss of spatial and temporal coordination of cytochrome c release (data not shown), demonstrating that this effect is not due to an increase in cytosolic calcium concentrations.
Figure 5.
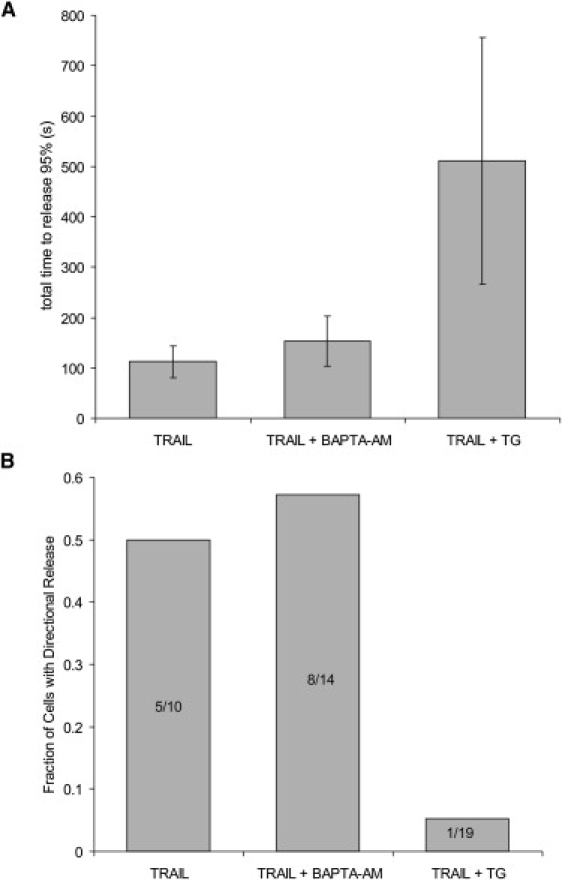
Thapsigargin, but not BAPTA, disrupts the wave of cytochrome c release. HeLa cells in 1.2 mM EGTA undergoing TRAIL-mediated apoptosis were treated with 1 mM BAPTA-AM (BAPTA) or 5 μM thapsigargin. (A) Duration of cytochrome c release (95% of all ROIs released). Thapsigargin increased the duration of release (p = 2.2 × 10⁻⁶), whereas BAPTA did not (p = 0.025). (B) Bar graph showing the fraction of cells with directional release. Numbers indicate (directionally releasing cells)/(total cells).
Discussion
Rapid imaging during apoptosis revealed a spatial coordination of cytochrome c release, Smac release, and loss of ΔΨm. Three spatial patterns of cytochrome c release were observed: waves initiating at one or two points in the cell, and an apparent random release. The release of Smac and loss of ΔΨm exhibited a spatial pattern similar to that of cytochrome c release. Only one temporal pattern was observed: first, the mitochondria lost cytochrome c and then they lost Smac, which was followed by the loss of mitochondrial energetics, as assayed by the ΔΨm. The mitochondria underwent fission after cytochrome c release. The wave of cytochrome c release was inhibited by treatment with thapsigargin.
Our technique to rapidly image cells releasing cytochrome c is well suited for clarifying mitochondrial dynamics during the critical commitment phase of apoptosis. This approach offers a way to monitor rapid subcellular events during apoptosis, and could be applied to other all-or-none events, such as transitions that occur during the cell cycle or cell differentiation.
The cell-wide release of cytochrome c-GFP was previously observed to occur in an all-or-none manner (14) and, more recently, in a wave propagating across single or fused cells (17). The existence of a wave suggests that the upstream trigger of cytochrome c release is spatially localized. Though the identity of the trigger is unknown, possible triggers include the members of the Bcl-2 family (4) and the initiator caspases. Here, we observed waves initiating not only at a single point in a cell, but also at two spatially distinct points in a cell (Fig. 2). This indicates that although the trigger initiating the wave of cytochrome c release is spatially localized, it can occur in multiple locations independently within a single cell. Therefore, although there may be multiple points for the initiating proapoptotic trigger within the cell, cytochrome c-GFP release is initiated only when the concentration or activity of the precursor crosses a threshold.
The similar spatial pattern observed within each cell between the release of cytochrome c-GFP and Smac-mCherry and the subsequent loss of ΔΨm suggests that although these events are not coincident, they are part of the same process. The temporal lag between the release of cytochrome c-GFP and Smac-mCherry could indicate different submitochondrial localizations of the proteins, different binding interactions that delay release of Smac-mCherry, or a pore that is selective for cytochrome c-GFP.
The temporal lag that was observed between the release of cytochrome c-GFP and the loss of TMRE shows that ΔΨm and thus the integrity of the inner membrane permeability and mitochondrial energetics are maintained during cytochrome c release. Thus, loss of mitochondria energetics is unlikely to be a causal trigger for the loss of the proteins cytochrome c and Smac. This is consistent with a model in which apoptosis is initiated in the cytoplasm, permeabilizing the outer membrane, followed by inner membrane permeabilization and then loss of potential (38). However, it is important to keep in mind that our experiments were done with fusion proteins, which may have different localizations than the endogenous proteins, resulting in different release dynamics.
It has been proposed that the release of cytochrome c may be a consequence of fission of the mitochondria and the subsequent release of mitochondrial contents (12). Here, we define mitochondrial fission as the point at which a break occurs in the mitochondria as observed by microscopy. The observation that cytochrome c-GFP release precedes mitochondrial fission (Fig. 5) indicates that fission is not necessary for the release of cytochrome c from individual mitochondria. It is unlikely that there are significant tears in the mitochondrial membrane that we are not detecting due to limited optical resolution, since the mitochondria still maintain their membrane potential. However, it is possible that the tears are restricted to only the outer membrane. Alternatively, there may be local fissions, but the two halves of the mitochondria do not move apart until after the release of cytochrome c and Smac. This observation is consistent with evidence that multiple components of the mitochondrial fission machinery, such as Drp1, are involved in promoting the release of cytochrome c. It is also possible that these proteins are multifunctional and use different mechanisms in their roles to reshape mitochondria and to promote the release of proteins from mitochondria (39).
When we imaged single mitochondria expressing mito-mCherry, we observed a distinct mitochondrial morphology characterized by multiple fluorescent aggregates with thinner intermediate connections. This could result from the recruitment of proteins such as Bax, Drp1, or Fis1, which cause restrictions at localized mitochondrial sites (27), or from alterations of internal mitochondria structures (11,28). This recruitment or alteration could be a precursor to mitochondrial fission.
To gain insight into the release of cytochrome c, we imaged the release from individual mitochondria with subsecond resolution. This revealed that cytochrome c release from individual mitochondria occurs in a single step. This imaging technique will be beneficial for investigating events associated with cytochrome c release that are too fast to image by laser scanning confocal microscopy, and with a greater z-spatial resolution than that provided by wide-field or confocal microscopy.
One possible mechanism for the wave of cytochrome c release is a factor that diffuses across the cell, triggering the mitochondria to release cytochrome c. Alternatively, a wave could result from an initial release of cytochrome c, followed by a feed-forward loop that amplifies the initial release. A role for ER calcium in the feed-forward mechanism is supported by our experiments in cells treated with thapsigargin, which showed a prolonged duration and lack of spatial organization of cytochrome c release. This is consistent with previous work showing a link between cytochrome c and calcium release from the ER, which in turn triggers cytochrome c release from the remaining mitochondria (32). However, loading the cytosol with 1 mM of BAPTA did not prolong or disrupt the spatial organization of the wave. This suggests that calcium signaling does not occur through the cytoplasm, and instead occurs through close contacts between the ER and the mitochondria (40). Alternately, thapsigargin could have an off-target effect, perhaps by altering mitochondrial calcium levels, which has been observed with higher concentrations of thapsigarin (41). Ultimately, a biochemical dissection of the mechanisms of the wave will be required.
Supporting Material
Seven figures and five movies are available at http://www.biophysj.org/biophysj/supplemental/S0006-3495(09)01360-5.
Supporting Material
Acknowledgments
The authors thank Douglas Green, Richard Youle, and Paul Greengard for supplying the plasmids, the members of the Simon laboratory for providing advice and technical support, and Tess McNamara for assistance in data analysis.
This work was supported by grants from the National Science Foundation (BES-0620813) and the National Institutes of Health (P20 GM072015) to S. M. S. A. L. M. was supported by the Rockefeller University Women & Science Fellowship Program.
Footnotes
Patrick D. Bhola and Alexa L. Mattheyses contributed equally to this work.
References
- 1.Ellis R.E., Yuan J.Y., Horvitz H.R. Mechanisms and functions of cell death. Annu. Rev. Cell Biol. 1991;7:663–698. doi: 10.1146/annurev.cb.07.110191.003311. [DOI] [PubMed] [Google Scholar]
- 2.Wyllie A.H. Glucocorticoid-induced thymocyte apoptosis is associated with endogenous endonuclease activation. Nature. 1980;284:555–556. doi: 10.1038/284555a0. [DOI] [PubMed] [Google Scholar]
- 3.Yuan J., Shaham S., Ledoux S., Ellis H.M., Horvitz H.R. The C. elegans cell death gene ced-3 encodes a protein similar to mammalian interleukin-1 β-converting enzyme. Cell. 1993;75:641–652. doi: 10.1016/0092-8674(93)90485-9. [DOI] [PubMed] [Google Scholar]
- 4.Youle R.J., Strasser A. The BCL-2 protein family: opposing activities that mediate cell death. Nat. Rev. Mol. Cell Biol. 2008;9:47–59. doi: 10.1038/nrm2308. [DOI] [PubMed] [Google Scholar]
- 5.Frezza C., Cipolat S., Martins de Brito O., Micaroni M., Beznoussenko G.V. OPA1 controls apoptotic cristae remodeling independently from mitochondrial fusion. Cell. 2006;126:177–189. doi: 10.1016/j.cell.2006.06.025. [DOI] [PubMed] [Google Scholar]
- 6.Cipolat S., Rudka T., Hartmann D., Costa V., Serneels L. Mitochondrial rhomboid PARL regulates cytochrome c release during apoptosis via OPA1-dependent cristae remodeling. Cell. 2006;126:163–175. doi: 10.1016/j.cell.2006.06.021. [DOI] [PubMed] [Google Scholar]
- 7.Vayssiere J.L., Petit P.X., Risler Y., Mignotte B. Commitment to apoptosis is associated with changes in mitochondrial biogenesis and activity in cell lines conditionally immortalized with simian virus 40. Proc. Natl. Acad. Sci. USA. 1994;91:11752–11756. doi: 10.1073/pnas.91.24.11752. [DOI] [PMC free article] [PubMed] [Google Scholar]
- 8.Li P., Nijhawan D., Budihardjo I., Srinivasula S.M., Ahmad M. Cytochrome c and dATP-dependent formation of Apaf-1/caspase-9 complex initiates an apoptotic protease cascade. Cell. 1997;91:479–489. doi: 10.1016/s0092-8674(00)80434-1. [DOI] [PubMed] [Google Scholar]
- 9.Munoz-Pinedo C., Guio-Carrion A., Goldstein J.C., Fitzgerald P., Newmeyer D.D. Different mitochondrial intermembrane space proteins are released during apoptosis in a manner that is coordinately initiated but can vary in duration. Proc. Natl. Acad. Sci. USA. 2006;103:11573–11578. doi: 10.1073/pnas.0603007103. [DOI] [PMC free article] [PubMed] [Google Scholar]
- 10.Verhagen A.M., Ekert P.G., Pakusch M., Silke J., Connolly L.M. Identification of DIABLO, a mammalian protein that promotes apoptosis by binding to and antagonizing IAP proteins. Cell. 2000;102:43–53. doi: 10.1016/s0092-8674(00)00009-x. [DOI] [PubMed] [Google Scholar]
- 11.Sun M.G., Williams J., Munoz-Pinedo C., Perkins G.A., Brown J.M. Correlated three-dimensional light and electron microscopy reveals transformation of mitochondria during apoptosis. Nat. Cell Biol. 2007;9:1057–1065. doi: 10.1038/ncb1630. [DOI] [PubMed] [Google Scholar]
- 12.Martinou J.C., Youle R.J. Which came first, the cytochrome c release or the mitochondrial fission? Cell Death Differ. 2006;13:1291–1295. doi: 10.1038/sj.cdd.4401985. [DOI] [PubMed] [Google Scholar]
- 13.Lakhani S.A., Masud A., Kuida K., Porter G.A., Booth C.J. Caspases 3 and 7: key mediators of mitochondrial events of apoptosis. Science. 2006;311:847–851. doi: 10.1126/science.1115035. [DOI] [PMC free article] [PubMed] [Google Scholar]
- 14.Goldstein J.C., Waterhouse N.J., Juin P., Evan G.I., Green D.R. The coordinate release of cytochrome c during apoptosis is rapid, complete and kinetically invariant. Nat. Cell Biol. 2000;2:156–162. doi: 10.1038/35004029. [DOI] [PubMed] [Google Scholar]
- 15.Waterhouse N.J., Goldstein J.C., von Ahsen O., Schuler M., Newmeyer D.D. Cytochrome c maintains mitochondrial transmembrane potential and ATP generation after outer mitochondrial membrane permeabilization during the apoptotic process. J. Cell Biol. 2001;153:319–328. doi: 10.1083/jcb.153.2.319. [DOI] [PMC free article] [PubMed] [Google Scholar]
- 16.Gottlieb E., Armour S.M., Harris M.H., Thompson C.B. Mitochondrial membrane potential regulates matrix configuration and cytochrome c release during apoptosis. Cell Death Differ. 2003;10:709–717. doi: 10.1038/sj.cdd.4401231. [DOI] [PubMed] [Google Scholar]
- 17.Lartigue L., Medina C., Schembri L., Chabert P., Zanese M. An intracellular wave of cytochrome c propagates and precedes Bax redistribution during apoptosis. J. Cell Sci. 2008;121:3515–3523. doi: 10.1242/jcs.029587. [DOI] [PubMed] [Google Scholar]
- 18.Rizzuto R., Brini M., Pizzo P., Murgia M., Pozzan T. Chimeric green fluorescent protein as a tool for visualizing subcellular organelles in living cells. Curr. Biol. 1995;5:635–642. doi: 10.1016/s0960-9822(95)00128-x. [DOI] [PubMed] [Google Scholar]
- 19.Huser J., Rechenmacher C.E., Blatter L.A. Imaging the permeability pore transition in single mitochondria. Biophys. J. 1998;74:2129–2137. doi: 10.1016/S0006-3495(98)77920-2. [DOI] [PMC free article] [PubMed] [Google Scholar]
- 20.Palmer A.E., Jin C., Reed J.C., Tsien R.Y. Bcl-2-mediated alterations in endoplasmic reticulum Ca2+ analyzed with an improved genetically encoded fluorescent sensor. Proc. Natl. Acad. Sci. USA. 2004;101:17404–17409. doi: 10.1073/pnas.0408030101. [DOI] [PMC free article] [PubMed] [Google Scholar]
- 21.Shaner N.C., Campbell R.E., Steinbach P.A., Giepmans B.N., Palmer A.E. Improved monomeric red, orange and yellow fluorescent proteins derived from Discosoma sp. red fluorescent protein. Nat. Biotechnol. 2004;22:1567–1572. doi: 10.1038/nbt1037. [DOI] [PubMed] [Google Scholar]
- 22.Ehrenberg B., Montana V., Wei M.D., Wuskell J.P., Loew L.M. Membrane potential can be determined in individual cells from the nernstian distribution of cationic dyes. Biophys. J. 1988;53:785–794. doi: 10.1016/S0006-3495(88)83158-8. [DOI] [PMC free article] [PubMed] [Google Scholar]
- 23.Du C., Fang M., Li Y., Li L., Wang X. Smac, a mitochondrial protein that promotes cytochrome c-dependent caspase activation by eliminating IAP inhibition. Cell. 2000;102:33–42. doi: 10.1016/s0092-8674(00)00008-8. [DOI] [PubMed] [Google Scholar]
- 24.Goldstein J.C., Munoz-Pinedo C., Ricci J.E., Adams S.R., Kelekar A. Cytochrome c is released in a single step during apoptosis. Cell Death Differ. 2005;12:453–462. doi: 10.1038/sj.cdd.4401596. [DOI] [PubMed] [Google Scholar]
- 25.Suen D.F., Norris K.L., Youle R.J. Mitochondrial dynamics and apoptosis. Genes Dev. 2008;22:1577–1590. doi: 10.1101/gad.1658508. [DOI] [PMC free article] [PubMed] [Google Scholar]
- 26.Frank S., Gaume B., Bergmann-Leitner E.S., Leitner W.W., Robert E.G. The role of dynamin-related protein 1, a mediator of mitochondrial fission, in apoptosis. Dev. Cell. 2001;1:515–525. doi: 10.1016/s1534-5807(01)00055-7. [DOI] [PubMed] [Google Scholar]
- 27.Karbowski M., Lee Y.J., Gaume B., Jeong S.Y., Frank S. Spatial and temporal association of Bax with mitochondrial fission sites, Drp1, and Mfn2 during apoptosis. J. Cell Biol. 2002;159:931–938. doi: 10.1083/jcb.200209124. [DOI] [PMC free article] [PubMed] [Google Scholar]
- 28.Kuwana T., Mackey M.R., Perkins G., Ellisman M.H., Latterich M. Bid, Bax, and lipids cooperate to form supramolecular openings in the outer mitochondrial membrane. Cell. 2002;111:331–342. doi: 10.1016/s0092-8674(02)01036-x. [DOI] [PubMed] [Google Scholar]
- 29.Ott M., Robertson J.D., Gogvadze V., Zhivotovsky B., Orrenius S. Cytochrome c release from mitochondria proceeds by a two-step process. Proc. Natl. Acad. Sci. USA. 2002;99:1259–1263. doi: 10.1073/pnas.241655498. [DOI] [PMC free article] [PubMed] [Google Scholar]
- 30.Scorrano L., Ashiya M., Buttle K., Weiler S., Oakes S.A. A distinct pathway remodels mitochondrial cristae and mobilizes cytochrome c during apoptosis. Dev. Cell. 2002;2:55–67. doi: 10.1016/s1534-5807(01)00116-2. [DOI] [PubMed] [Google Scholar]
- 31.Axelrod D. Total internal reflection fluorescence microscopy. Methods Cell Biol. 1989;30:245–270. doi: 10.1016/s0091-679x(08)60982-6. [DOI] [PubMed] [Google Scholar]
- 32.Boehning D., Patterson R.L., Sedaghat L., Glebova N.O., Kurosaki T. Cytochrome c binds to inositol (1,4,5) trisphosphate receptors, amplifying calcium-dependent apoptosis. Nat. Cell Biol. 2003;5:1051–1061. doi: 10.1038/ncb1063. [DOI] [PubMed] [Google Scholar]
- 33.Boehning D., van Rossum D.B., Patterson R.L., Snyder S.H. A peptide inhibitor of cytochrome c/inositol 1,4,5-trisphosphate receptor binding blocks intrinsic and extrinsic cell death pathways. Proc. Natl. Acad. Sci. USA. 2005;102:1466–1471. doi: 10.1073/pnas.0409650102. [DOI] [PMC free article] [PubMed] [Google Scholar]
- 34.Foyouzi-Youssefi R., Arnaudeau S., Borner C., Kelley W.L., Tschopp J. Bcl-2 decreases the free Ca2+ concentration within the endoplasmic reticulum. Proc. Natl. Acad. Sci. USA. 2000;97:5723–5728. doi: 10.1073/pnas.97.11.5723. [DOI] [PMC free article] [PubMed] [Google Scholar]
- 35.Scorrano L., Oakes S.A., Opferman J.T., Cheng E.H., Sorcinelli M.D. BAX and BAK regulation of endoplasmic reticulum Ca2+: a control point for apoptosis. Science. 2003;300:135–139. doi: 10.1126/science.1081208. [DOI] [PubMed] [Google Scholar]
- 36.Pacher P., Hajnoczky G. Propagation of the apoptotic signal by mitochondrial waves. EMBO J. 2001;20:4107–4121. doi: 10.1093/emboj/20.15.4107. [DOI] [PMC free article] [PubMed] [Google Scholar]
- 37.Szabadkai G., Simoni A.M., Chami M., Wieckowski M.R., Youle R.J. Drp-1-dependent division of the mitochondrial network blocks intraorganellar Ca2+ waves and protects against Ca2+-mediated apoptosis. Mol. Cell. 2004;16:59–68. doi: 10.1016/j.molcel.2004.09.026. [DOI] [PubMed] [Google Scholar]
- 38.Basanez G., Nechushtan A., Drozhinin O., Chanturiya A., Choe E. Bax, but not Bcl-xL, decreases the lifetime of planar phospholipid bilayer membranes at subnanomolar concentrations. Proc. Natl. Acad. Sci. USA. 1999;96:5492–5497. doi: 10.1073/pnas.96.10.5492. [DOI] [PMC free article] [PubMed] [Google Scholar]
- 39.Cassidy-Stone A., Chipuk J.E., Ingerman E., Song C., Yoo C. Chemical inhibition of the mitochondrial division dynamin reveals its role in Bax/Bak-dependent mitochondrial outer membrane permeabilization. Dev. Cell. 2008;14:193–204. doi: 10.1016/j.devcel.2007.11.019. [DOI] [PMC free article] [PubMed] [Google Scholar]
- 40.Rizzuto R., Pinton P., Carrington W., Fay F.S., Fogarty K.E. Close contacts with the endoplasmic reticulum as determinants of mitochondrial Ca2+ responses. Science. 1998;280:1763–1766. doi: 10.1126/science.280.5370.1763. [DOI] [PubMed] [Google Scholar]
- 41.Vercesi A.E., Moreno S.N., Bernardes C.F., Meinicke A.R., Fernandes E.C. Thapsigargin causes Ca2+ release and collapse of the membrane potential of Trypanosoma brucei mitochondria in situ and of isolated rat liver mitochondria. J. Biol. Chem. 1993;268:8564–8568. [PubMed] [Google Scholar]
Associated Data
This section collects any data citations, data availability statements, or supplementary materials included in this article.