

Abstract
Neuroserpin is a member of the serine proteinase inhibitor superfamily. It can undergo a conformational transition to form polymers that are associated with the dementia familial encephalopathy with neuroserpin inclusion bodies and the wild-type protein can inhibit the toxicity of amyloid-β peptides in Alzheimer's disease. We have used a single molecule fluorescence method, two color coincidence detection, to determine the rate-limiting steps of the early stages of the polymerization of fluorophore-labeled neuroserpin and have assessed how this process is altered in the presence of Aβ1–40. Our data show that neuroserpin polymerization proceeds first by the unimolecular formation of an active monomer, followed by competing processes of both polymerization and formation of a latent monomer from the activated species. These data are not in keeping with the recently proposed domain swap model of polymer formation in which the latent species and activated monomer are likely to be formed by competing pathways directly from the unactivated monomeric serpin. Moreover, the Aβ1–40 peptide forms a weak complex with neuroserpin (dissociation constant of 10 ± 5 nM) that increases the amount of active monomer thereby increasing the rate of polymerization. The Aβ1–40 is displaced from the complex so that it acts as a catalyst and is not incorporated into neuroserpin polymers.
Introduction
Alzheimer's disease is one of the most common forms of dementia. The pathological features are characterized by neurofibrillary tangles and extracellular plaques that are formed from fragments of the amyloid precursor protein (APP). These plaques are composed of the 42 (Aβ1–42) and, to a lesser extent, 40 (Aβ1–40) amino acid peptides (1). There is now increasing recognition that it is not the plaques, but rather the soluble oligomers of amyloid-β that are the neurotoxic species in Alzheimer's disease. Ancillary proteins, such as neuroserpin, may bind to these peptides and reduce their toxic effect. Indeed neuroserpin has been demonstrated histologically to colocalize with Aβ plaques in Alzheimer's patients, to form a 1:1 interaction with Aβ1–42, and to alter the appearance of the aggregates, making them spherical rather than fibrillar (2). Moreover neuroserpin reduces the toxicity of the Aβ1–42 peptide in both cell and fly models of disease (2).
Neuroserpin is a 45 kDa member of the serine protease inhibitor or serpin superfamily (3–5). It is expressed during the late stage of development in neurons of the central and peripheral nervous system and in the adult brain (6,7). The target proteinase of neuroserpin is tissue plasminogen activator (tPA) (8), which is expressed at low levels within the central nervous system and is thought to play a role in the development of synaptic plasticity and in learning and memory (9). Point mutations in the neuroserpin gene underlie an autosomal dominant dementia called familial encephalopathy with neuroserpin inclusion bodies (FENIB) (10–12). This disease is characterized by the retention of ordered polymers of neuroserpin as periodic acid-Schiff positive Collin's bodies within the endoplasmic reticulum of neurons (10–13). Five unique disease causing mutations within the neuroserpin gene have been identified in six families with FENIB (11,14). These families show a clear correlation between genotype and phenotype that can be explained by the rate of neuroserpin polymerization (8,11–13,15). Those mutants that polymerize most rapidly in vitro are associated with the greatest number of cerebral inclusions in vivo and the earliest age of disease onset. Previous work has shown that serpin polymers, such as those of mutant neuroserpin associated with FENIB, result from the sequential linkage between the reactive center loop of one molecule and β-sheet A of another (4,8,15). However this has been challenged recently by the crystal structure of a closed dimer of another serpin, antithrombin, which showed a remarkable domain swap containing not only the reactive center loop but also strand 5A (16). Therefore it is of great interest to probe both the details of neuroserpin polymerization and also its interaction with Aβ peptides.
The analysis of individual molecules has been shown to be a powerful tool to study biological processes because it allows dynamic processes to be followed and to show heterogeneities hidden in bulk averaging. We have recently introduced a single molecule fluorescence method based on the excitation of two distinct fluorophores with two lasers and used this to sensitively detect and identify associated molecules and oligomers, which give rise to coincident bursts of two colors of fluorescence. Our method, called two color coincidence detection (TCCD), has been used to measure the stoichiometry of human telomerase enzyme (17), the association of proteins on the surface of a live T-cell (18) and to follow the oligomerization of the SH3 domain before and during fibril formation (19). In this study, we have exploited the sensitivity of TCCD to follow protein aggregation. We first study the initial stages of the polymerization of fluorophore-labeled neuroserpin and then determine how this is altered in the presence of Aβ. Our results provide what we believe to be new insights into both the polymerization of neuroserpin and its interaction with the Aβ peptide.
Materials and Methods
Expression and purification
The Ser229Cys mutation was introduced into the cDNA of wild-type neuroserpin containing a 6-His N-terminal-tag in the pQE81L vector by site directed mutagenesis. Wild-type and Ser229Cys neuroserpin were then expressed in Escherichia coli and purified to homogeneity as detailed previously (8).
Labeling of Ser229Cys neuroserpin with Alexa 488 or Alexa 647
Neuroserpin was incubated for 30–60 min at room temperature at a concentration of 0.5–1 mg in the presence of 0.1 M DTT. The DTT was then removed by filtration through a NAP-10 column (Amersham Biosciences, Little Chalfont, UK) and the protein treated with 10–20-fold molar excess of either Alexa 488 or Alexa 647 in a final concentration of 5% v/v DMSO. The mixture was incubated for 2 h at room temperature and then overnight at 4°C before being centrifuged at 16,000 × g for 20 min. The supernatant was loaded onto a HisTrap Column in 20 mM imidazole, 20 mM Na2PO4, and 20 mM NaCl (pH 7.8) and bound neuroserpin was batch eluted with 300 mM imidazole, 20 mM sodium phosphate, and 20 mM NaCl (pH 7.8). The eluent was gel filtered into PBS with a NAP-10 column and the labeling efficiency was determined by comparing protein absorption at 280 nm with the absorption of Alexa 488 at 488 nm and Alexa 647 at 647 nm. Labeling efficiency was calculated using the formula
| (1) |
where Abs is the absorbance in OD, MM is the molecular mass in Da, and EC is the extinction coefficient in cm−1M−1. The EC values used for Alexa 488 and Alexa 647 were 71,000 and 239,000, respectively. The final optimized strategy yielded labeling efficiencies of nearly 100% for Alexa 488-neuroserpin and 40% for Alexa 647-neuroserpin.
Polymerization of neuroserpin
Stock solutions of Alexa 488- and Alexa 647-labeled neuroserpin monomers were stored at −80°C. They were thawed at room temperature and then centrifuged at 13.2 kRPM for 30 min to remove any aggregates. Equimolar mixtures of Alexa 488- and Alexa 647-labeled monomeric neuroserpin were incubated in PBS at 45°C at total neuroserpin concentrations ranging from 0.1 mg/mL (2.2 μM) to 0.3 mg/ml (6.6 μM). Aliquots were taken at timepoints up to 480 min, snap-frozen in liquid nitrogen, and stored at −80°C until measurement by TCCD.
The interaction between neuroserpin and Aβ1–40
The effect of Aβ1–40 on the polymerization of neuroserpin was determined by adding increasing concentrations of unlabeled Aβ1–40 (Bachem, Bubendorf, Switzerland) in 20 μL of PBS at the start or after 30 min of a polymerization reaction containing 0.1 mg/mL total neuroserpin (equimolar mixture of Alexa 488- and Alexa 647-neuroserpin). The direct interaction between Aβ1–40 and neuroserpin was assessed with equimolar concentrations of HiLyte Fluor 488 N-terminal labeled Aβ1–40 (AnaSpec, Fremont, CA) and Alexa 647-Nsp. The solutions were incubated at 45°C or preincubated for 24 h at 37°C before raising the temperature to 45°C.
TCCD measurements
Snap-frozen aliquots of the incubated sample were thawed at room temperature and diluted in PBS to a measurement concentration of ∼50 pM. Control experiments with and without snap freezing showed that freezing had no effect on the single molecule fluorescence data (data not shown). Typically, 200 μL of sample solution were analyzed on glass coverslips that had been precoated with a 1 mg/mL solution of bovine serum albumin for at least 1 h before measurement to minimize sample adsorption. Data acquisition typically lasted 80 min. For certain timepoints, longer acquisition times were used to recover larger numbers of events to obtain histograms with better statistics. For these, 1 mL of sample solution was placed in chambered cover glasses that had been similarly precoated with bovine serum albumin and measured for 16 h each. The instrumentation for TCCD measurement has been reported in detail previously (20,21). Briefly, two overlapped Gaussian laser beams, at 488 nm (Spectra Physics Cyan CDRH, Mountain View, CA) and 633 nm (He/Ne laser, 25LHP151, Melles Griot, Albuquerque, NM), were directed to the back port of an inverted microscope (Nikon Eclipse TE2000-U, Tokyo, Japan). The beams were focused 6 μm into the sample through an Apochromat 60×, NA 1.40 oil immersion objective (Nikon). Fluorescence was collected by the same objective and imaged onto a 50 μm pinhole (Melles Griot), then separated into two different channels using a dichroic mirror (585DRLP Omega Filters, Brattleboro, VT) and sent to two avalanche photodiodes (SPCM AQR-14, PerkinElmer Optoelectronics, Quebec, Canada). The cross talk (detection of one fluorophore emission in the other channel) from the blue channel to the red channel was 1% whereas the cross talk from the red channel to blue channel was negligible. All measurements used laser powers of 220 μW and 60 μW for the blue and red channels, respectively. For all the single molecule experiments, data were collected at 20°C with a 1 ms bin time on both multi channel scalar cards, and burst selection was carried out by applying suitable threshold values (22). From TCCD measurements the association quotient Q is obtained. This parameter is proportional to the fraction of dual-labeled molecules in a heterogeneous mixture (21), and is defined as
| (2) |
where rB and rR are the fluorescence burst rates in the 488 and 647 channel respectively; the burst rate of significant coincident events, rS, is obtained by subtracting the rate of coincident events due to chance, rE, from the total coincident events rate rC. Coincidence histograms of the function Z, defined as ln(IR/IB), are built up from the significant coincident bursts, after removing the contribution of chance coincidence (21).
Kinetic model of polymerization
Possible kinetic models and kinetic rate constants underlying neuroserpin polymerization were studied by means of a global fitting procedure of both experimentally derived Q time traces and the intensity ratio histograms obtained at three different incubation times. The procedure was to numerically solve the differential equations defining the kinetic model, simulate the Q time trace and TCCD histograms at every time point, and fit the kinetic rate constants to adjust the simulations to the experimental data by the least-squares method. Several different kinetic models were tested by generating differential kinetic equations for monomers and higher order species. A detailed description of the kinetic models, the solution of the differential equations, the simulations of TCCD measurement outputs, the association quotient and coincidence histograms, and the fitting protocol can be found in the Supporting Material.
Results and Discussion
Characterization of fluorophore-labeled neuroserpin
To carry out single-molecule fluorescence experiments, a single cysteine mutation (Ser229Cys) was introduced into the neuroserpin (Nsp) gene, which contains no natural cysteines. This residue was chosen as the homologous residue in antitrypsin (232Cys) can be labeled with large fluorophores without affecting polymerization (23,24). In agreement with this, we found that recombinant Ser229Cys neuroserpin had a normal far UV CD profile, formed SDS-stable complexes with tPA (Fig. 1; ka = 3.7 (± 0.1) × 104 M−1s−1; n = 3) and polymerized at a similar rate to wild-type neuroserpin (data not shown). However, the introduction of the cysteine residue allowed site specific labeling with either an Alexa Fluor 488 or Alexa Fluor 647 fluorophore as described in Materials and Methods. The presence of these fluorophores did not affect either complex formation with tPA or polymerization (Fig. 1 B). The lowest band in Fig. 1 B corresponds to monomers. The band above it corresponds to dimers and contains neuroserpin that has formed cysteine disulfide bonds in the course of the labeling reaction, which we were able to minimize but not remove completely. These molecules are unlabeled and hence do not affect the single molecule measurements. Polymer formation is associated with the appearance of discrete, higher-molecular mass bands corresponding to neuroserpin oligomers.
Figure 1.
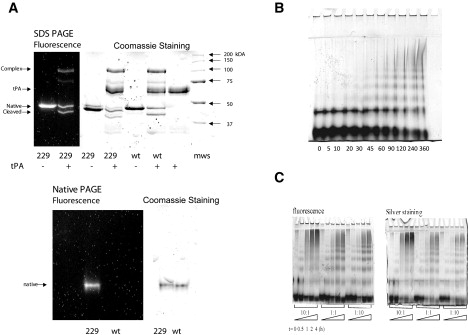
Characterization of Ser229Cys neuroserpin. (A) Purified Ser229Cys neuroserpin was labeled with Alexa Fluor 647 and assessed by 7.5–15% w/v nondenaturing PAGE (upper panel); 229 represents labeled Ser229Cys neuroserpin and wt is the wild-type protein. (Lower panel) Fluorophore-labeled Ser229Cys formed a complex with tPA on 7.5–15% w/v/ SDS-PAGE. The protein was visualized by either Coomassie staining or by fluorescence. (Left to right): Ser229Cys labeled with Alexa 647, Ser229Cys labeled with Alexa 647 and addition of tPA, Ser229Cys labeled with Alexa 647, Ser229Cys labeled with Alexa 647 and addition of tPA, wt neuroserpin, wt neuroserpin and addition of tPA, tPA, molecular mass standard. (B) A 7.5–15% w/v nondenaturing PAGE to assess the polymerization of Alexa 488- and 647-labeled neuroserpin incubated at 0.1 mg/mL and 45°C in PBS buffer pH 7.4. Each lane represents a different time of incubation (min). Two micrograms of protein were loaded in each lane. (C) Polymerization of Ser229Cys neuroserpin labeled with Alexa 488 and 647 in the presence of different ratios of Aβ1–40 to neuroserpin. Incubation was at 45°C in PBS at pH 7.4, Aβ1–40 was added after 30 min of incubation. The samples were visualized on 7.5–15% w/v nondenaturing PAGE.
Single-molecule study of neuroserpin polymerization
TCCD is sensitive to very small populations of dimers, trimers and other oligomers, allowing us to study the early stages of polymerization. Equimolar mixtures of Alexa Fluor 488- and Alexa Fluor 647-labeled neuroserpin were incubated at 45°C and aliquots were taken from the mixture at different times and snap frozen to stop the reaction and hence to follow the kinetics of polymerization. These aliquots were diluted to typical single molecule concentrations (∼50 pM) and measured using TCCD to quantify the fraction of molecules that are associated. The neuroserpin polymers are known to be highly stable once formed with a melting temperature >100°C so there is no possibility of dissociation on dilution (25). We measured the association quotient, Q, which is proportional to the fraction of molecules with at least one label of each color. Three independent incubations were carried out at 45°C using equimolar amounts of blue- and red-labeled monomers with a total neuroserpin concentration at 0.1 mg/ml (2.2 μM) to ensure the kinetics were reproducible. We observed a rapid increase in Q during the first 2 h before gradually reaching a plateau (Fig. 2 A). The overall curve fits well to the exponential decay function:
| (3) |
where A is a normalization constant (with A < 0), y0 is the plateau region and τ is the rise time. The resulting growth curves, from independent experiments at the same total neuroserpin concentration, show good agreement but with slightly diverging plateaus. This difference in plateaus is probably due to the difficulty in accurately controlling the final concentration of the protein in the incubating mixture and batch to batch variation in the preparation of labeled neuroserpin. The increased noise in the plateau region is due to the occasional large oligomer entering the probe volume, events that are not averaged out for each measurement. Time traces of the average brightness values of coincident events (corrected for the contribution of chance coincidence, when two nonassociated molecules enter the probe volume at the same time) provided a complementary way to observe the growth of neuroserpin oligomers. Inspection of these traces (Fig. 2 B) showed a clear increasing trend that is due to the detected oligomers, initially dimers, growing into higher-order species involving more than one Alexa 488 or Alexa 647-labeled monomers. The growth continues to increase whereas the Q curve plateaus, suggesting no additional oligomers are formed but those present continue to grow. Using TCCD we can follow the very early stages of polymerization where the fraction of polymers is only 1%. The use of an exponential function fitting allows us to obtain the initial growth rate as (∂Q/∂t)t=0. From measurements in Fig. 2 A an average value of Q initial growth of 2.2 ± 0.8 × 10⁻⁶ s−1 was obtained.
Figure 2.
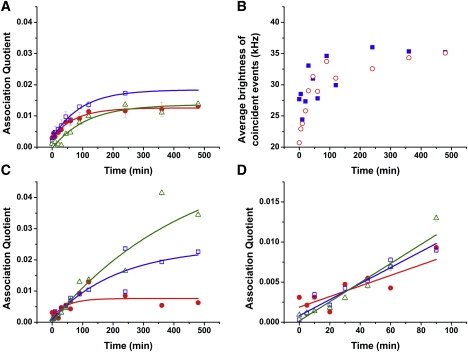
(A) Association quotient time traces for labeled Nsp-Alexa 488 and Nsp-Alexa 647 incubation at a total concentration of 0.1 mg/mL. For incubations 1 and 2 (circles and squares), each data point represents the average value of three repetitions at the same timepoint. The last data point for incubation 2 is 240 min. (B) Average brightness of the coincident events in the blue (squares) and red (circles) channels from an incubation of labeled Nsp-Alexa 488 and Nsp-Alexa 647 at a total concentration of 0.1 mg/mL. The average standard error in the measurements is ∼4%. (C) Association quotient time traces for labeled Nsp-Alexa 488 and Nsp-Alexa 647 incubation at a total concentration of 0.1 (circles), 0.2 (squares), and 0.3 mg/ml (triangles) using the same stock of labeled neuroserpin. The fit to exponential decay functions with τ = 44, 171, and 486 min, respectively are also shown (lines). (D) Zoom of the early part of C showing the linear increase in association quotient with time.
We then carried out a polymerization reaction again using 0.1 mg/mL neuroserpin, as well as with two higher concentrations, 0.2 and 0.3 mg/mL, all prepared from the same stock solution, to remove the contribution of batch to batch variation in the neuroserpin preparation (Fig. 2 C). This experiment showed two noticeable features. First, noting that Q is proportional to the fraction of all molecules that are associated, we found that the initial gradient appeared similar for the three different concentrations (Fig. 2 D), rather than depending on initial neuroserpin concentration. This suggests that a unimolecular reaction is rate limiting at the start of the reaction. The gradient (∂Q/∂t)t=0 for 0.3 mg/mL was 2.1 ± 1.5 × 10⁻⁶ s−1 and that for 0.2 mg/mL was 2.4 ± 1.1 × 10⁻⁶ s−1. These are in quantitative agreement with the value of 2.2 ± 0.8 × 10⁻⁶ s−1 found for the 0.1 mg/mL, as determined within experimental error. To directly recover the reaction order we plotted ln[(∂Q/∂t)t=0] versus ln([M]0) (see the Supporting Material for details). In this type of analysis, fitting the data points with a linear regression yields a slope n − 1, where n is equal to the reaction order. We determined a value for n − 1 of −0.03 ± 0.12 that clearly indicates an initial reaction order of 1. This gives the value of the first-order initial rate kinitial to be (6.4 ± 0.6)×10−5 s−1 (see the Supporting Material). The initial first-order behavior strongly suggests the requirement of a transformation of the monomer M to an activated form M∗ responsible for polymer formation as suggested previously (4,24,26).
The second noticeable feature is that the plateau increases with increasing concentration of neuroserpin, and that this plateau does not correspond to a complete polymerization (Fig. 2 C). In agreement with this feature, the corresponding gels always show the presence of nonpolymerizing monomer (Fig. 1). This suggests that there is a competing alternative path to polymer formation that leads to unreactive monomer. The plateau of our TCCD curves is concentration dependent, with a higher polymerization degree reached at higher concentrations. The data in Fig. 2 C clearly show that increasing the initial neuroserpin concentration leads to more neuroserpin being incorporated into polymers and that this must be due to the increase in the rate of the bimolecular reactions for dimer formation and growth. On the other hand, the increase in concentration must not accelerate the reaction giving rise to nonreactive or latent neuroserpin by the same amount. This suggests that the transformation to latent form is unimolecular.
Kinetic modeling of the polymerization
More detailed kinetic modeling of the reaction was undertaken to globally fit the experimental kinetic traces, and also the single-molecule coincidence histograms, and hence find the kinetic scheme that best fitted the data (Figs. 3 and 4). The fitting procedure we used was based on the global compartmental analysis approach, a well established methodology to obtain the underlying rate constants on a kinetic model. This has been applied in several fields, among them in photophysics (27). We fitted the kinetic Q traces but also simultaneously the three histograms taken at different time points that have information on oligomer populations (from histogram shape), total number of oligomers (from the total area of the histograms), and how these vary with time. We also checked the final results gave robust values. More details of the method and their error analysis can be found in the Supporting Material. The formation of polymers can be described by three general kinetic schemes that satisfy the observations described above. These include a first-order activation reaction (kA), second order dimer formation (k1), oligomer propagation through monomer addition (k2) and polymer-polymer addition (k3), and a first-order transition to a latent state (kL). This latent state of neuroserpin has been identified previously and found to be unable to polymerize and no longer act as a proteinase inhibitor, however if this latent monomer is denatured and refolds then function is restored (25). As TCCD can only detect oligomers and cannot distinguish between activated monomer or unactivated monomer, it is possible that the activated monomer converts into unactivated monomer during the single molecule measurement. This, however, does not affect our analysis because the fraction of neuroserpin polymers does not change during the measurement due to their high stability and the cessation of the reaction when the sample is snap-frozen.
Figure 3.
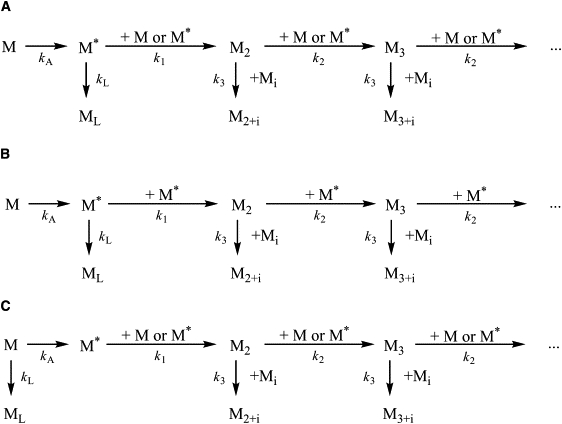
Neuroserpin polymerization kinetic schemes. Neuroserpin monomer M is activated to M∗ with an activation rate kA; depending on the model, either a normal (M) or an active monomer (M∗) can undergo a transformation into the latent form (ML) or form a dimer M2 by adding either M or M∗ that we assume to occur at the same rate k1; the polymers can grow by addition of a monomer (M or M∗) with a rate k2, or by addition of an oligomer of size i (Mi) with any other oligomer of size j to form an oligomer Mi+j at a rate k3 that we assume to be the same for whatever value of i and j. In A the latent species is formed from the activated monomer, M∗. In B the dimer formation and monomer addition only occur through activated monomers M∗; whereas in C the transformation to nonpolymerizing latent form is a parallel pathway of the monomer M that may transform either to the active M∗ or to the latent monomer (ML).
Figure 4.
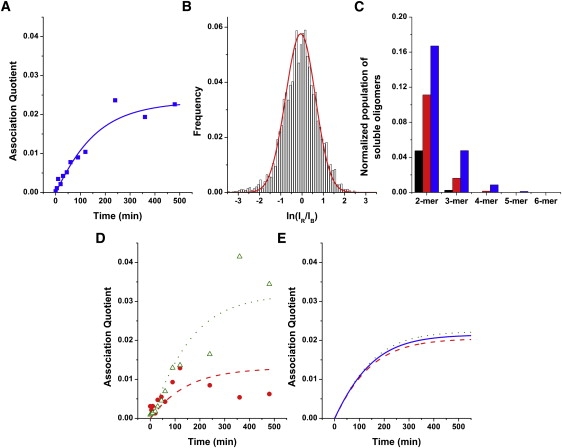
Global fit of the association quotient time trace and the coincidence histograms to the kinetic model for neuroserpin polymerization. (A) Experimental association quotient (symbols) and the fit (line) for a 0.2 mg/mL neuroserpin incubation. (B) Experimental TCCD histogram after 240 min of incubation and a simulated histogram based on the global fit (red line). (C) Calculated distribution of oligomers based on the kinetic model at the three aliquot times analyzed: 30 (first bar), 90 (middle bar), and 240 min (last bar). (D) Experimental association quotient (symbols) and simulated (lines) using the rate constants in Table 1 for a 0.1 (circles) and 0.3 mg/mL (triangles) neuroserpin incubation. (E) Predicted association quotient time traces by kinetic model in Fig. 3C for neuroserpin polymerization at a total concentration of 0.1 (dashed), 0.2 (solid), and 0.3 (dotted) mg/mL.
Fig. 3 B shows a mechanism in which the formation of dimers requires that the two monomers are activated to form M∗ and that the addition of monomer to the oligomer results exclusively by the addition of M∗. This mechanism provided a good global fit with the experimental data (c2 = 1.94 × 10⁻³). Nevertheless, because the formation of dimers requires two molecules of activated monomer, this reaction needs to be very fast to explain the appearance of dimers within a few minutes of the start of the reaction. Indeed, the fit gave a value for k1 (dimer formation) of 2 × 10⁵ M−1 s−1 that is close to the diffusion limited reaction rate constant for a 45 kDa protein. Moreover, as the orientation of the molecules is an important factor in dimer formation (because the loop of one monomer is inserted into β-sheet A of a second monomer), it seems very unlikely that such a rapid reaction takes place.
The crystal structure of a stable dimer of another serpin, antithrombin, led to the proposal that polymer formation occurs by a domain swap while the protein folds (16). In this model M∗ is characterized by an exposed β-hairpin composed of strands s4A and s5A. Both strands s4A and s5A must be incorporated into β–sheet A in the latent species (25,28) and thus the latent protein is more likely to be formed by a competing pathway from the unactivated monomer (Fig. 3 C). The global fitting of the Q curve and three TCCD histograms for a neuroserpin polymerization at 0.2 mg/mL provided physically meaningful values of the rate constants, with a c2 value of 1.96 × 10⁻³. However, when the recovered rate constants were used to simulate the association quotient time traces at other concentrations, this model predicts very little variation of the plateau with total monomer concentration, Fig. 4 E. This is in contrast to our experimental observations. In addition, the model in Fig. 3 C is a simplification because as the polymers can form from the folded protein (8,15,25) each monomer must be activated or partially activated before addition to the polymer chain, which would lead to unphysical rate constants as found above. To investigate this further we then carried out an experiment using gels to see how the fraction of polymers formed in the plateau region varied with the initial neuroserpin concentration (see the Supporting Material). We found more of the neuroserpin formed polymers when the starting concentration was higher, in contrast to the predictions of the model in Fig. 3 C. For these reasons this model was discarded. Thus neuroserpin must polymerize by a different mechanism where the latent species is formed from the activated monomer.
Based on the results above the most likely reaction scheme is that shown in Fig. 3 A. This scheme describes a pathway that is in good agreement with previous work suggesting M∗ is characterized by the opening of s4A and partial loop insertion (4,8,15,25). Such an intermediate would readily form either dimers and subsequently polymers, or alternatively the latent species. The global fit of the experimental curve of Q versus incubation time (Fig. 4 A) and coincident histograms (Fig. 4 B) at three different incubation times (30, 90, and 240 min) for an incubation of a total neuroserpin concentration of 0.2 mg/mL (4.4 μM) provided the rate constant values compiled in Table 1 with a c2 value of 1.94 × 10⁻³. Using these rate constants the concentration profiles with time of the oligomeric species can be obtained. Fig. 4 C shows the concentration of oligomeric species up to hexamers at 30, 90, and 240 min into the incubation. This figure shows that dimers were predicted to make up the overwhelming majority of oligomers at both 30 min and 90 min and represent two-thirds of the oligomeric species in the late-stage timepoint of 240 min. In addition, the model predicted very little formation of oligomers larger than 3-mers at all three timepoints examined. The model also calculated relatively rapid conversion toward latent monomers, predicting ∼45% of the monomer converted to a latent form at later incubation times. The high predicted value for latency rate was supported by the low association quotient observed throughout the measurement, and the presence of large amounts of monomeric species even when the polymerization had reached the plateau, as evidenced in the corresponding gels (Fig. 1). Finally, to test the validity of the rate constant obtained, the theoretical association quotient curves were simulated for two other incubation concentrations, 0.1 and 0.3 mg/mL using the rate constants recovered in the global fit. The theoretical curves showed good agreement with the experimental values (Fig. 4 D).
Table 1.
Rate constant values for neuroserpin polymerization at 45°C
| Activation rate (kA) | (7 ± 2) × 10−5 s−1 |
| Rate of latent species formation (kL) | 0.029 ± 0.008 s−1 |
| Dimer formation (k1) | (6 ± 1) × 103 M−1 s−1 |
| Growth by monomer addition (k2) | 20 ± 10 M−1 s−1 |
| Growth by polymer addition (k3) | → 0 |
It is useful to compare TCCD with gel analysis to follow neuroserpin polymerization. When carrying out the analysis of neuroserpin polymerization by gels it is difficult to quantify the amount of each polymer formed. There is the additional problem that gels are less sensitive and so we cannot make measurements at early time points. It is for these reasons that we used the single molecule experiments to quantify and characterize polymerization. The gels are sensitive to large polymers, however, because they are more intense in gels. For example, the same amount of 10-mer is five times more intense than a dimer in a gel. Hence small populations of large polymers, which will be formed late in the reaction, can be detected sensitively in the gel. TCCD is significantly more sensitive to small oligomers and can be used to study the early stages of the reaction and obtain quantitative data. However, the encounter rate of the 10-mer with the probe volume is reduced, due to its smaller diffusion coefficient compared to a dimer, making TCCD less sensitive to large oligomers. This is the reason there are fluctuations in the plateau region in Fig. 2 C because an occasional large polymer can enter the probe volume and this is not averaged out over the measurement. In future studies we plan to flow the sample to eliminate this effect.
Effect of Aβ1–40 on neuroserpin polymerization
Having characterized the reaction of neuroserpin alone we then studied how this was altered by the presence of Aβ1–40. We chose this rather than the more rapidly polymerizing Aβ1–42, to prevent the simultaneous polymerization of both Aβ and neuroserpin, which would have complicated the analysis. Reaction mixtures containing 0.1 mg/mL (2.2 μM) of total neuroserpin (0.05 mg/mL of Alexa 488 or Alexa 647-labeled neuroserpin) were incubated at 45°C for 8 h. After 30 min of incubation, different concentrations of unlabeled Aβ1–40 were spiked into the reaction mixture. The time trace of association quotient showed an enhancement in association after the addition of Aβ1–40 (Fig. 5 A). The additional enhancement was noted at a molar ratio Aβ1–40/Nsp >1:1. Higher concentrations of Aβ1–40 caused further enhancement of the coincidence levels. Control TCCD measurements on Aβ1–40 alone at the same concentration showed negligible levels of fluorescence on both the red and blue channels, eliminating the possibility that this change in association quotient was due to fluorescent impurities present in the Aβ sample. The addition of Aβ1–40 from the beginning of neuroserpin incubation also caused an enhancement in the concentration of oligomeric species (Fig. 5 B). The value of the initial rate was (10 ± 2) × 10−5 s−1, an increase by a factor of 1.6 over the rate in the absence of Aβ1–40.
Figure 5.
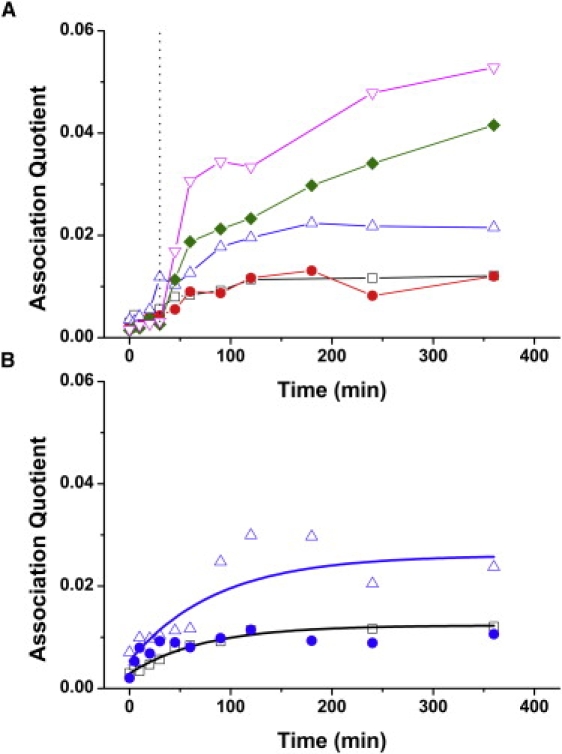
(A) Effect on 0.1 mg/mL neuroserpin polymerization of the addition of Aβ1–40 spiked in after 30 min of incubation (black dotted line). [Aβ1–40]/[Nsp] = 0 (squares), 0.1 (circles), 1 (triangles), 10 (diamonds), and 100 (inverted triangles). (B) Effect on 0.1 mg/mL neuroserpin polymerization of the addition of equimolar concentration of Aβ1–40 at the beginning of the incubation (open triangles), and preincubation with Aβ1–40 for 24 h at 37°C (solid circles). Both curves are compared to that obtained in the absence of Aβ1–40 (open squares).
Previous experiments have shown that neuroserpin can form a complex with Aβ that inhibits the formation of amyloid fibrils, changing the shape of the deposits formed from fibrils to small spherical aggregates (2). Reciprocally, Aβ is able to irreversibly inactivate neuroserpin for protease inhibitory activity or polymerization, although this requires preincubation for at least 30 h at 37°C when a 1:1 complex is formed. We therefore repeated the neuroserpin polymerization reactions in the presence of Aβ1–40 but having previously preincubated the mixture for 24 h. In contrast to the experiments in which the Aβ1–40 was only added at the start of the polymerization reaction, no enhancement of the association quotient was detected in these experiments, and the curves showed similar profiles to those without Aβ1–40 (Fig. 5 B).
To determine if there was a complex formed between Aβ1–40 and neuroserpin, at the single molecule level, we preincubated 1:1 molar ratios of Alexa 647-labeled neuroserpin and HiLyte Fluor 488-labeled Aβ1–40, followed by incubation under conditions that would induce neuroserpin polymerization, and measured different aliquots under TCCD. The formation of a Nsp/Aβ1–40 complex would give rise to coincident events above background levels. Indeed, the preincubated mixtures showed the very slow formation of a 1:1 complex (Fig. 6 A), but always at very low concentrations. This suggests that either the affinity is relatively low or that the complex, if formed, is unstable on dilution to single molecule concentrations. The percentage of formed Nsp/Aβ1–40 complex was constant during the neuroserpin polymerization reaction with a value of 0.8 ± 0.2% (Q = 0.0016 ± 0.0004). Taking into account the burst rates of the unassociated and associated molecules and the labeling efficiency we can estimate a dissociation constant for the Nsp/Aβ1–40 complex of 10 ± 5 nM (see the Supporting Material for details), assuming that our measurements are made at equilibrium. To follow the polymerization state of neuroserpin and the effect of the preincubation with Aβ1–40, we used a method based on the fact that neuroserpin oligomers would give rise to brighter fluorescence bursts, as TCCD was not applicable in this case because there was only one fluorophore label on the neuroserpin. We therefore calculated the fraction of all fluorescence events due to bright neuroserpin oligomers, with an intensity values above 175 kHz. Whereas the mixtures with no preincubation showed an increasing number of neuroserpin oligomeric events with incubation time, the preincubated samples did not show a greater number of neuroserpin oligomers (Fig. 6 B). Although this is less sensitive than the use of TCCD to probe polymerization, it confirms that preincubation of neuroserpin with Aβ1–40 blocks the enhancement of polymerization.
Figure 6.
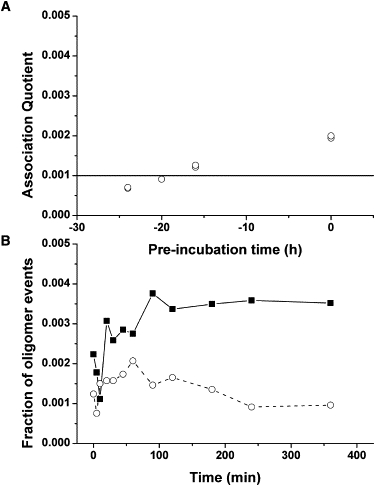
(A) Association quotient for the complex Nsp/Aβ1–40 under preincubation conditions. The solid line indicates the limit of detection of the TCCD technique. (B) Fraction of Alexa647-Nsp oligomeric events from Nsp incubations in the presence of HL488-Aβ1–40 with (open symbols, dashed line) and without (solid symbols, solid lines) 24 h of preincubation.
Neuroserpin alone polymerizes quickly in 4–6 h, whereas Aβ1–40 alone does not progress beyond the very early stages of fibril formation at a concentration of 2 μM, with significant aggregation occurring only after 16–17 h (data not shown). This means that it is very unlikely that the increase in the rate of neuroserpin polymerization is due to its incorporation into Aβ1–40 fibrils. To confirm this we carried out total internal reflection fluorescence imaging of the neuroserpin polymers on a microscope slide and found that the Aβ1–40 was not colocalized with the neuroserpin (see the Supporting Material). Therefore the increase in polymerization rate of neuroserpin must be due to an increase in the concentration of activated monomer as shown in Scheme 1.
Scheme 1.

Scheme for the interaction of Amyloid-β1–40 with neuroserpin. A fast transient interaction creates a complex where the neuroserpin is activated and able to polymerize. If the neuroserpin and Aβ1–40 are incubated long enough, they form a stable inactive complex.
Addition of Aβ1–40 results in the rapid formation of an activated intermediate with neuroserpin. This intermediate is presumably formed by the Aβ1–40 peptide inserting into a partially opened β-sheet A of neuroserpin (2). This species more rapidly converts into activated monomer and hence results in both faster polymerization and a higher plateau of association. When the activated neuroserpin accepts another monomer, the Aβ1–40 is displaced from the complex, having acted as an effective catalyst of the polymerization. In contrast, leaving the neuroserpin and Aβ1–40 mixture preincubated for 24 h leads to stabilization of the Nsp/Aβ1–40 complex, resulting in no additional activated neuroserpin monomer and no increased rate of polymerization. Nevertheless, neuroserpin polymerization occurs under these conditions (Fig. 5 B) because not all neuroserpin molecules form the stable complex and are thus able to form the active monomer. Both the intermediate and complex are not stable when diluted down to single molecule level for analysis, hence only a small fraction of the complex is detectable. This also explains why we observe no Aβ1–40 incorporated into the growing neuroserpin polymers, and indicates that no neuroserpin will be incorporated into the Aβ1–40 fibrils. Importantly the inhibitory effect of neuroserpin in both test tube experiments and under physiological conditions will depend on the concentration of both neuroserpin and Aβ, along with the length of time that they have been mixed together. The slow progression of Alzheimer's disease, however, would suggest that the stable complex is the more important species. This model provides a straightforward way to explain the observed spherical aggregates that Aβ forms in the presence of neuroserpin (2) because steric repulsion between the neuroserpin molecules into which the Aβ is inserted (or partially inserted) will cause Aβ molecules to minimize such unfavorable energetic interactions with neuroserpin by forming spherical aggregates. This is similar to surfactants that form spherical micelles as a result of small tails and large headgroups. The spherical aggregates of Aβ will predictably contain only Aβ because its interaction with neuroserpin is weak and so no neuroserpin is incorporated into the aggregate.
Conclusions
We have exploited single molecule fluorescence to study the polymerization of neuroserpin, and to determine how this is altered in the presence of Aβ1–40. Our data show that neuroserpin polymerization occurs by the formation of an active monomer and that the presence of Aβ1–40 increases the amount of active monomer present, thereby increasing the rate of polymerization. The insertion of Aβ1–40 into the neuroserpin β-sheet A facilitates its opening and the interaction with another neuroserpin monomer, followed by displacement of the Aβ1–40 so that it is not ultimately incorporated into neuroserpin polymers. Therefore, under these conditions Aβ1–40 acts as a catalyst of neuroserpin polymerization. These experiments are one example of how single molecule science has advanced to a level where it can start to address biomedical problems and provide new insights. This trend is likely to accelerate in the future as the technology matures and becomes more widely applied.
Supporting Material
Additional explanation, equations, figures, a table, and references are available at http://www.biophysj.org/biophysj/supplemental/S0006-3495(09)01364-2.
Supporting Material
Acknowledgments
We thank Leila Lueshi for her suggestion of this project, and Benedetta Bolognesi for helping with the unlabeled Aβ kinetics.
A.C. and A.Y.C. were funded by the Gates Cambridge Trust and A.O. was funded by a Marie-Curie Fellowship. P.H. was funded by the Wennergren Foundation (Sweden) and Swedish Society for Medical Research (SSMF). This work was also supported by the Medical Research Council (UK), the Engineering and Physical Sciences Research Council, and Papworth NHS Trust.
Footnotes
Albert Chiou, Peter Hägglöf, and Angel Orte contributed equally to this work.
Angel Orte's present address is Department of Physical Chemistry, Faculty of Pharmacy, University of Granada, Campus Cartuja, Granada, 18071 Spain.
References
- 1.Selkoe D.J. Alzheimer's disease: genes, proteins, and therapy. Physiol. Rev. 2001;81:741–766. doi: 10.1152/physrev.2001.81.2.741. [DOI] [PubMed] [Google Scholar]
- 2.Kinghorn K.J., Crowther D.C., Sharp L.K., Nerelius C., Davis R.L. Neuroserpin binds Aβ and is a neuroprotective component of amyloid plaques in Alzheimer disease. J. Biol. Chem. 2006;281:29268–29277. doi: 10.1074/jbc.M600690200. [DOI] [PubMed] [Google Scholar]
- 3.Silverman G.A., Bird P.I., Carrell R.W., Church F.C., Coughlin P.B. The serpins are an expanding superfamily of structurally similar but functionally diverse proteins. Evolution, novel functions, mechanism of inhibition and a revised nomenclature. J. Biol. Chem. 2001;276:33293–33296. doi: 10.1074/jbc.R100016200. [DOI] [PubMed] [Google Scholar]
- 4.Miranda E., Lomas D.A. Neuroserpin: a serpin to think about. Cell. Mol. Life Sci. 2006;63:709–722. doi: 10.1007/s00018-005-5077-4. [DOI] [PMC free article] [PubMed] [Google Scholar]
- 5.Galliciotti G., Sonderegger P. Neuroserpin. Front. Biosci. 2006;11:33–45. doi: 10.2741/1778. [DOI] [PubMed] [Google Scholar]
- 6.Hastings G.A., Coleman T.A., Haudenschild C.C., Stefansson S., Smith E.P. Neuroserpin, a brain-associated inhibitor of tissue plasminogen activator is localized primarily in neurones. J. Biol. Chem. 1997;272:33062–33067. doi: 10.1074/jbc.272.52.33062. [DOI] [PubMed] [Google Scholar]
- 7.Krueger S.R., Ghisu G.-P., Cinelli P., Gschwend T.P., Osterwalder T. Expression of neuroserpin, an inhibitor of tissue plasminogen activator, in the developing and adult nervous system of the mouse. J. Neurosci. 1997;17:8984–8996. doi: 10.1523/JNEUROSCI.17-23-08984.1997. [DOI] [PMC free article] [PubMed] [Google Scholar]
- 8.Belorgey D., Crowther D.C., Mahadeva R., Lomas D.A. Mutant neuroserpin (Ser49Pro) that causes the familial dementia FENIB is a poor proteinase inhibitor and readily forms polymers in vitro. J. Biol. Chem. 2002;277:17367–17373. doi: 10.1074/jbc.M200680200. [DOI] [PubMed] [Google Scholar]
- 9.Yepes M., Lawrence D.A. New functions for an old enzyme: nonhemostatic roles for tissue-type plasminogen activator in the central nervous system. Exp. Biol. Med. 2004;229:1097–1104. doi: 10.1177/153537020422901103. [DOI] [PubMed] [Google Scholar]
- 10.Davis R.L., Shrimpton A.E., Holohan P.D., Bradshaw C., Feiglin D. Familial dementia caused by polymerization of mutant neuroserpin. Nature. 1999;401:376–379. doi: 10.1038/43894. [DOI] [PubMed] [Google Scholar]
- 11.Davis R.L., Shrimpton A.E., Carrell R.W., Lomas D.A., Gerhard L. Association between conformational mutations in neuroserpin and onset and severity of dementia. Lancet. 2002;359:2242–2247. doi: 10.1016/S0140-6736(02)09293-0. [DOI] [PubMed] [Google Scholar]
- 12.Miranda E., MacLeod I., Davies M.J., Perez J., Romisch K. The intracellular accumulation of polymeric neuroserpin explains the severity of the dementia FENIB. Hum. Mol. Genet. 2008;17:1527–1539. doi: 10.1093/hmg/ddn041. [DOI] [PMC free article] [PubMed] [Google Scholar]
- 13.Miranda E., Romisch K., Lomas D.A. Mutants of neuroserpin that cause dementia accumulate as polymers within the endoplasmic reticulum. J. Biol. Chem. 2004;279:28283–28291. doi: 10.1074/jbc.M313166200. [DOI] [PubMed] [Google Scholar]
- 14.Coutelier M., Andries S., Ghariani S., Dan B., Duyckaerts C. Neuroserpin mutation causes electrical status epilepticus of slow-wave sleep. Neurology. 2008;71:64–66. doi: 10.1212/01.wnl.0000316306.08751.28. [DOI] [PubMed] [Google Scholar]
- 15.Belorgey D., Sharp L.K., Crowther D.C., Onda M., Johansson J. Neuroserpin Portland (Ser52Arg) is trapped as an inactive intermediate that rapidly forms polymers: implications for the epilepsy seen in the dementia FENIB. Eur. J. Biochem. 2004;271:3360–3367. doi: 10.1111/j.1432-1033.2004.04270.x. [DOI] [PubMed] [Google Scholar]
- 16.Yamasaki M., Li W., Johnson D.J.D., Huntington J.A. Crystal structure of a stable dimer reveals the molecular basis of serpin polymerization. Nature. 2008;455:1255–1258. doi: 10.1038/nature07394. [DOI] [PubMed] [Google Scholar]
- 17.Alves D., Li H., Codrington R., Orte A., Ren X. Single molecule analysis of human telomerase monomer. Nat. Chem. Biol. 2008;4:287–289. doi: 10.1038/nchembio.82. [DOI] [PubMed] [Google Scholar]
- 18.James J.R., White S.S., Clarke R.W., Johansen A.M., Dunne P.D. Single-molecule level analysis of the subunit composition of the T cell receptor on live T cells. Proc. Natl. Acad. Sci. USA. 2007;104:17662–17667. doi: 10.1073/pnas.0700411104. [DOI] [PMC free article] [PubMed] [Google Scholar]
- 19.Orte A., Birkett N.R., Clarke R.W., Devlin G.L., Dobson C.M. Direct characterization of amyloidogenic oligomers by single-molecule fluorescence. Proc. Natl. Acad. Sci. USA. 2008;105:14424–14429. doi: 10.1073/pnas.0803086105. [DOI] [PMC free article] [PubMed] [Google Scholar]
- 20.Orte A., Clarke R.W., Klenerman D. Fluorescence coincidence spectroscopy for single-molecule fluorescence resonance energy-transfer measurements. Anal. Chem. 2008;80:8389–8397. doi: 10.1021/ac8009092. [DOI] [PubMed] [Google Scholar]
- 21.Orte A., Clarke R., Balasubramanian S., Klenerman D. Determination of the fraction and stoichiometry of femtomolar levels of biomolecular complexes in an excess of monomer using single-molecule, two-color coincidence detection. Anal. Chem. 2006;78:7707–7715. doi: 10.1021/ac061122y. [DOI] [PubMed] [Google Scholar]
- 22.Clarke R.W., Orte A., Klenerman D. Optimized threshold selection for single-molecule two-color fluorescence coincidence spectroscopy. Anal. Chem. 2007;79:2771–2777. doi: 10.1021/ac062188w. [DOI] [PubMed] [Google Scholar]
- 23.Mahadeva R., Chang W.S.W., Dafforn T.R., Oakley D.J., Foreman R.C. Heteropolymerization of S, I, and Z α(1)-antitrypsin and liver cirrhosis. J. Clin. Invest. 1999;103:999–1006. doi: 10.1172/JCI4874. [DOI] [PMC free article] [PubMed] [Google Scholar]
- 24.Dafforn T.R., Mahadeva R., Elliott P.R., Sivasothy P., Lomas D.A. A kinetic mechanism for the polymerization of α (1)-antitrypsin. J. Biol. Chem. 1999;274:9548–9555. doi: 10.1074/jbc.274.14.9548. [DOI] [PubMed] [Google Scholar]
- 25.Onda M., Belorgey D., Sharp L.K., Lomas D.A. Latent S49P neuroserpin forms polymers in the dementia familial encephalopathy with neuroserpin inclusion bodies. J. Biol. Chem. 2005;280:13735–13741. doi: 10.1074/jbc.M413282200. [DOI] [PubMed] [Google Scholar]
- 26.Tsutsui Y., Kuri B., Sengupta T., Wintrode P.L. The structural basis of serpin polymerization studied by hydrogen/deuterium exchange and mass spectrometry. J. Biol. Chem. 2008;283:30804–30811. doi: 10.1074/jbc.M804048200. [DOI] [PMC free article] [PubMed] [Google Scholar]
- 27.Ameloot M., Boens N., Andriessen R., Vandenbergh V., Deschryver F.C. Non a priori analysis of fluorescence decay surfaces of excited- state processes. 1. Theory. J. Phys. Chem. 1991;95:2041–2047. [Google Scholar]
- 28.Im H., Woo M.-S., Hwang K.Y., Yu M.-H. Interactions causing the kinetic trap in serpin protein folding. J. Biol. Chem. 2002;277:46347–46354. doi: 10.1074/jbc.M207682200. [DOI] [PubMed] [Google Scholar]
Associated Data
This section collects any data citations, data availability statements, or supplementary materials included in this article.