

Abstract
Natural vision takes place within the context of rich varied stimuli and frequent eye movements. In the present study, we examined the way that scene complexity and saccades combine to sculpt the temporal response patterns of V1 neurons. To bridge the gap between conventional and free viewing experiments, we compared responses of neurons across four paradigms ranging from less to more natural. An optimal bar stimulus was either flashed into a receptive field (RF) or brought into it via saccade, and was embedded in either a natural scene or a uniform gray background. Responses to a flashed bar tended to be higher with a uniform rather than natural background. The most novel result reported here is that responses evoked by stimuli brought into the RF via saccades were enhanced, compared to the same stimuli flashed during steady fixation. No single factor appears to account entirely for this surprising effect, but there were small contributions from fixational saccades and residual activity carried over from the previous fixation. We also found a negative correlation with cells’ response “history”, in that a larger response on one fixation was associated with a lower response on the subsequent fixation. The effects of the natural background and saccades exhibited a significant non-linear interaction, with the suppressive effects of the natural background less for stimuli entering RFs with saccades. Together, these results suggest that even responses to standard optimal stimuli are difficult to predict under conditions similar to natural vision, and further demonstrate the importance of naturalistic experimental paradigms to the study of visual processing in V1.
Introduction
Many traditional studies of V1 stimulate neurons with small abstract stimuli, such as bars or gratings, presented in isolation on a screen in a darkened room. Recordings are usually made from animals that are either anesthetized or trained to keep their gaze fixed; in either case, large eye movements are eliminated. The value of this approach is obvious. By restricting stimuli to simple lines or shapes, the way in which individual stimulus parameters are encoded can be carefully analyzed. Abolishing large eye movements ensures stable, reproducible retinal stimulation, allowing receptive fields (RFs) to be mapped, and permitting neural responses to be averaged across multiple trials.
However, the reductionist approach may provide a description of V1 that is incomplete for more natural situations. Natural scenes differ from typical stimuli not only in their complexity and scale but also statistical properties (Ruderman 1994; Ruderman and Bialek 1994; Simoncelli and Olshausen 2001). Moreover, in natural vision, visual stimuli usually enter RFs via saccades, which have been shown to distort perception (Carpenter 1988; Latour 1962; Ross et al. 2001; Thiele et al. 2002; Volkmann et al. 1968). There is a natural cadence to fixations and saccades that establishes a temporal relationship between stimuli, which is abolished in traditional V1 experiments.
Studies examining natural vision and the significance of experimental reductions go back decades, but there has been increasing interest in recent years (Kayser et al. 2004). Various studies have explored different issues related to natural viewing such as receptive field structure, preferred stimuli, and contextual modulation. To a first approximation, neuronal responses in more natural situations are similar to those obtained in reduced paradigms. For example, it has been shown that reverse correlation with natural images or movies yields estimates of receptive field structure and preferred orientation similar to estimates obtained with simple flashed stimuli (Ringach et al. 2002; Smyth et al. 2003). With an analysis of spike bursts, it is possible to estimate RF location and orientation preference even during free-viewing (Livingstone et al. 1996). Regarding saccadic eye movements, it has been reported that stimuli brought into a RF via saccade evoke a response similar to the same stimulus swept into the RF or flashed to a fixating animal (DiCarlo and Maunsell 2000; Gawne and Martin 2002; Richmond et al. 1999; Wurtz 1969).
However, there are compelling indications that visual responses in more natural situations are different from those in reduced paradigms. David et al. (2004) found that a RF model built on responses to natural stimuli is better able to predict responses to novel natural stimuli than a RF model built on responses to gratings, suggesting that the inherent statistics of natural scenes are important. Kayser et al. (2003) found that natural images evoke LFPs and multiunit activity that are qualitatively different from responses to gratings. Extra-RF interactions are also different with natural stimuli, again reflecting the importance of higher-order natural statistics (Guo et al. 2005). Vinje and Gallant (2000) found that extra-RF input with natural images alters the selectivity and sparseness of V1 responses. Concerning eye movements, saccades have been found to alter basic receptive field properties in the LGN (Reppas et al. 2002), V3 (Nakamura and Colby 2002), V4 (Tolias et al. 2001), as well as in parietal areas (Duhamel et al. 1992, Kusonoki et al. 2000). .
The present study used a progression of 4 paradigms that intermix and contrast the effects of simple versus natural stimuli and stimuli brought to receptive fields by saccade versus flash. Rather than adopt a free-viewing approach, the principal experiments used a technique that preserved key elements of natural vision while allowing tighter control over stimulus and behavior. This permitted us to average responses over multiple stimulus presentations, which is impossible with free-viewing, and allowed us to directly compare responses to identical stimuli in reduced and more natural situations. In light of previous research, we did not construct RF kernels with natural stimuli, characterize optimal stimuli or stimulus tuning, or study responses associated with saccadic suppression. Our focus was entirely on comparing response patterns in a standard laboratory paradigm (fixating animal with flashed stimuli) to responses with stimuli as identical as possible in more natural situations including natural context and saccades. We find that both natural scenes and saccades have significant effects upon neural responses. Consistent with previous studies of surround suppression, responses to stimuli embedded in a natural scene were typically less than when the stimulus was presented in isolation. Much more surprising, responses were significantly enhanced when stimuli entered RFs with saccades compared to when they appeared in RFs during steady fixation. Together, natural scenes and saccades sculpted responses in a way that that would be difficult or impossible to predict from traditional V1 experiments. The different response magnitudes and temporal response patterns suggest that the cortical network activated in natural vision is different from that in more reduced paradigms. A brief report of these results appeared previously in abstract form (MacEvoy et al. 2002).
Materials and Methods
Surgery and training
Two adult female rhesus monkeys (Macaca mulatta) weighing 5.0 kg (monkey HZ) and 6.0 kg (monkey PN) served as subjects. All procedures conformed to National Institutes of Health guidelines and were approved by the Brown University Institutional Animal Care and Use Committee. In aseptic surgery, each was implanted with a head post and a recording chamber centered over area V1. After recovery, animals were trained to sit comfortably in a primate chair (Crist Instruments, Hagerstown, MD) with their heads fixed. Once the animals became accustomed to the chair and headpost, they were trained to saccade to and hold fixation on visual cues. Prior to participating in this study, monkey PN had served as a subject in unrelated experiments requiring a simple fixation task.
Extracellular physiology
Single-unit recordings in V1 were made with epoxy-coated tungsten electrodes (FHC, Bowdoinham, ME). Electrode potentials were amplified, band-pass filtered between 300 and 3,000 Hz, and observed with an oscilloscope and audio monitor. Single unit activity was isolated by template matching (Alpha Omega Engineering, Nazareth Illit, Israel). During experiments, spike times were recorded by a computer running Tempo data collection and experiment management software (Reflective Computing, St. Louis, MO), which was also used to monitor behavior and control stimulus presentation. Eye position was monitored by an infrared pupil tracking system (ISCAN Corp., Burlington, MA) with 60Hz temporal resolution. After calibration, the precision of the eye location measurements was 0.3 deg. Once single-unit activity was isolated, RF boundaries were mapped using manually-controlled light bars presented on a monitor. RFs were manually defined as regions from which an optimally oriented bar evoked action potentials.
Visual stimuli
All experimental stimuli were presented on a computer monitor at 1024 by 768 pixel resolution, positioned 40 cm from the seated animal and subtending 52.5° by 38.4°. The principal stimulus was a white bar, optimized for orientation and confined to the RF of the cell under study. Bar width was set for each neuron to evoke a maximal response. We did not employ quantitative tests to differentiate simple and complex cells, but found that a positive-contrast (white) bar was sufficient to elicit strong responses from all neurons. In all stimulus conditions, the bar appeared on a small gray square at least twice the diameter of the RF, referred to as the “buffer”. The buffer had the same mean luminance as the background, and ensured that RF stimulation was identical across all conditions.
The bar/buffer combination was presented in two different visual contexts. In the “natural background” context, the bar and buffer were superimposed upon a grayscale natural scene image drawn from a published database (van Hateren and van der Schaaf 1998). All neurons were studied with the same natural image background, though additional natural images were used on some cells. The position of RFs on the natural image varied from neuron to neuron. In the “gray background” context, the bar and buffer were presented on a gray screen set to the same mean luminance as the natural image. Since this was the value also selected for the luminance of the buffer, in these conditions the bar was the sole discernible stimulus present. Schematic diagrams of stimuli are shown in Figure 1A.
Figure 1.

Stimuli and behavioral task. (A) A small optimally-oriented bar was placed within the classical RF and superimposed upon either a uniform gray (top) or natural image (bottom) background. For natural background conditions, the bar was surrounded by a gray buffer patch. Stimulus elements are not shown to scale. In the experiments, the stimulus bar was roughly the size of a small tree branch in the image. (B) Timing comparison between flash (top) and saccade trials (bottom). In both conditions the animal was first required to fixate an initial peripheral fixation point (FP), and then saccade to the central FP when it appeared. In flash conditions the bar stimulus appeared in the RF during fixation; in saccade conditions it was brought into the RF with the saccade to the central FP.
Behavioral task
For each visual context, trials proceeded in one of two behavioral modes. (Fig. 1B). In “flash” mode, a trial began with the appearance of the natural or gray background and the superimposed buffer, but without the bar stimulus itself. After a short delay, an initial fixation spot appeared at one of two possible locations on the screen, one 5° to the left of center and the other 5° to the right. The animal was required to visually acquire the fixation spot within 3 seconds (though both animals usually did so within a few hundred milliseconds), and maintain fixation within 0.5° of the spot for 300 ms. The first fixation spot was then extinguished and a new fixation spot appeared at the center of the screen. If the monkey failed to move its gaze to within 0.5° of the new fixation location within 300 ms, the trial was aborted. With acquisition of the central fixation spot, the RF of the neuron under study fell within the buffer patch. After the animal maintained fixation at the central location for 500 ms, the bar stimulus was flashed on in the RF, and the monkey was required to maintain fixation for an additional 1.5 seconds, after which the stimulus was extinguished and a liquid reward was given. Spike times were recorded for a period beginning 0.5 – 3 seconds prior to bar stimulus presentation and extending to the end of the trial.
“Saccade” mode conditions also began with the natural or gray background and superimposed buffer, but with the bar stimulus already inside the buffer. A fixation spot appeared at one of the same two off-center locations used in flash conditions and the monkey was required to acquire this first fixation spot and hold it for 300 ms. A second fixation point appeared at the central location and the monkey had to acquire it within 300 ms. In saccade mode, the resulting saccade carried the RF onto the bar stimulus. The monkey subsequently had to keep its gaze on the fixation spot for 1.5 seconds to receive a liquid reward. Stimulus onset in saccade conditions refers to the time at which the animal’s gaze entered (and stayed within) the central fixation window. Since the fixation window, at 1° square, was smaller than some RFs, it was possible that the bar stimulus could have entered RFs slightly before the eyes entered the fixation window. However, based on our measurements of eye velocity and RF size, this error is less than 3 ms.
Our stimulus set was thus composed of four principal conditions: natural background flash, natural background saccade, gray background flash, and gray background saccade. All stimuli were randomly interleaved.
Data analysis
Spike times were collected with 1 ms temporal resolution. Peristimulus time histograms (PSTHs) were computed off-line and data rebinned at 10 ms. To compute population response histograms, we normalized single cell responses by scanning each cell’s PSTHs for the bin with the single highest spike count across all conditions. We scaled every other bin to the cell maximum and generated population histograms by adding corresponding bins from all cells. The resulting set of population response functions were then renormalized to the maximum response across all conditions. For presentation only, we converted PSTHs to spike density functions smoothed by a Savitzky-Golay least squares filter using a second order polynomial fit to spike rates within a 50 millisecond window. Standard errors for spike density functions were computed across smoothed single-trial responses.
All statistical tests are based upon raw trial-by-trial spike counts during the first 500ms following stimulus onset.
Calibrating response latency in saccade mode
Since data collection in saccade mode trials was triggered by acquisition of the central fixation point, any delay in our eye tracking system could result in artificially short response latencies. To calibrate the system, we passed a square-wave voltage signal from a function generator to an oscilloscope in X-Y mode to produce a bright dot that jumped between two positions. This artificial eye position signal was detected by the eye tracking equipment. To quantify the delay in the eye tracking system, we compared the timing of the simulated saccades to the output of the function generator. The average delay was 27.6 ms. To compensate for this delay, all saccade mode PSTHs were shifted by 28 ms prior to performing any analysis. To be sure that our findings were not artifacts of the shift procedure, we always recomputed our statistical analysis with unshifted data. Doing so actually increased the frequency of the effects described in Results. Thus, the effect of any unnecessary or excessive time-shifting would have been to decrease our estimate of the frequency of significant response differences, not inflate it.
Results
We obtained complete recordings from 59 neurons in two monkeys. All cells had responses to the bar stimulus that were significantly higher than their spontaneous activity (t-test, p < 0.05), which was measured during trials in which the monkeys completed the saccade task on a gray background with no bar stimulus.
Response statistics during free-viewing
As a preliminary step, we wished to compare visual responses recorded during free-viewing of a natural scene image with responses to a more conventional lab stimulus (i.e. an isolated bar stimulus set to a cell’s preferred orientation and flashed in the RF). To quantify free-viewing responses we recorded spike times and eye position during the 1 second intertrial interval between each fixation trial. During these intervals, the stimulus monitor was preloaded with the background, either natural or gray, for the succeeding fixation trial. We computed firing rates within a sliding 50 ms window stepped in 10 ms increments through the first second of every free-viewing epoch in which a natural image was preloaded, and through all bar presentation periods. Although the monkeys were not explicitly required to restrict their gaze to the monitor during this period, the large subtense of the screen combined with the monkeys’ desire to locate the forthcoming fixation spot likely produced stimulation that was dominated by the natural image. We excluded from this analysis any periods when the eye position signal was lost due to closed eyelids, although in practice we rarely encountered closures longer than blinks. Figure 2A plots the distributions of firing rates computed from all possible window locations for one cell. For well over half the window positions in free-viewing epochs, this cell fired at rates less than 20 spikes per second, which corresponds to at most 1 spike every 50 ms. In contrast, the cell responded at over 40 spikes per second in most response epochs during presentation of the bar stimulus. Mean firing rates across all window positions during free-viewing and bar presentation were 15.7 and 43.6 spikes per second, respectively. Although dramatic, this difference is not surprising, since stimuli entering the cell’s RF during free-viewing were unlikely to match the cell’s preferences. Despite the drastically different means, the range of responses was similar: the peak response in any 50 ms window during free-viewing was 140 spikes per second, and the response to the optimal bar peaked at 160. For this cell, responses to a natural stimulus fell within the range of responses elicited by an optimized stimulus. The point we take to be noteworthy from these data is that natural stimuli could drive this V1 neuron, and the others we analyzed, nearly as much as an optimized laboratory stimulus, though this was a rare event.
Figure 2.

Statistics of single-unit firing during free-viewing and optimal bar presentation with fixation. (A) Distributions of firing rates for one cell. Firing rates were computed in 50 ms windows placed at 10 ms increments across the response. The hatched histogram shows the response distribution for free-viewing and the plain histogram shows responses to flashed optimal bars. (B) Firing rates in flashed-bar and free-viewing conditions for all cells, averaged across all window positions. Error bars are standard error. (C) Comparison of peak firing rates across the cell population in flashed-bar and free-viewing conditions. Peak rates are the highest firing rates observed in any 50 ms window across all trials, for each cell. Symbol sizes are proportional to number of cells plotted at each location. (D) Comparison of average free-viewing activity to the peak response to a flashed bar. In more natural visual situations, V1 activity is well below the response rates commonly reported in experiments with optimal stimuli. In figures B -D, solid lines are diagonals.
We obtained similar results across our sample of cells. Figure 2B plots mean firing rates across all window positions during free-viewing and bar presentation for each cell. Most neurons (44/59) had higher mean responses during bar presentation than during free viewing. For most of the other neurons, mean free-viewing and bar responses were comparable. Across cells, mean responses to an optimal bar were 23% higher than during free-viewing. Peak firing rates for the bar, plotted in Figure 2C, also tended to exceed free-viewing peak rates, though to a lesser degree. A smaller majority (35/59) of cells had higher peak responses to the bar, and the average cell had a peak bar response 14% higher than its peak response during free-viewing.
While neural responses are not usually formally characterized by peak firing rates, it is not uncommon to quickly read a PSTH by picking off the maximum rate to assess the robustness of response (despite the common knowledge that peak rates are highly sensitive to PSTH binning). Our results show, not surprisingly, that the high peak firing rates commonly recorded with optimal stimuli do not accurately describe the normal response properties of a neuron in natural situations. The data in Figure 2D underscore this point by comparing the peak response to an optimal stimulus with the average free-viewing response. The difference between the distributions for these data is striking. Clearly, firing rates evoked by an optimal stimulus provide an incomplete and/or misleading description of cells’ activity during conditions similar to natural vision.
Effect of background on bar responses
In order to allow averaging across trials, the remainder of the results looks at the effects of background type and saccades in guided saccade paradigms rather than free-viewing. Figure 3A (top panel) shows the responses of a single neuron to a bar flashed in its RF on either a natural image or gray background. For this cell, the bar elicited a markedly more robust response on the gray background than on the natural background, even with identical RF stimulation and overall stimulus luminance. The bottom panel of Figure 3A illustrates the effect of background for a bar brought into the RF with a saccade, for the same cell. Once again, the cell had a higher firing rate with the gray background, indicating that the effect of background persisted when the bar was carried into the RF with an eye movement as it would be during natural vision. For both pairs of responses in Figure 3A, the effect of background only became apparent following the response peak, roughly 100 ms after stimulus onset. (These responses and all hereafter, unless otherwise noted, represent combined data from trials beginning with saccades from the left and right initial fixation points.)
Figure 3.

Comparison of responses to bar stimulus on natural image and uniform gray backgrounds. (A) Single-unit responses to a bar flashed on the gray and natural image backgrounds during fixation (top) and to an identical bar appearing in the RF via saccade (bottom). Dark lines are mean responses across 15 trials; light lines are mean ± s.e.m. (B) Population responses (normalized for 59 neurons) to a bar presented on natural and gray backgrounds during fixation (top) and with a saccade (bottom). With either flash or saccade presentation modes, responses were generally less on a natural background.
Of 59 neurons recorded, 34 (58%) had statistically significant differences in flash mode between response rates for the two backgrounds (two-tailed t-test, p<0.05). For 32 of these 34 (94% of subset), the bar on the natural background elicited the lower response. In saccade mode, a significant effect of background was observed slightly less frequently, with 31 (52%) neurons showing significant response differences. Of these, 26 (84% of subset) gave a lower response with the natural background. Figure 3B shows results averaged across all the neurons we studied. Compared to the gray background, the presence of the natural image background yielded response rates that averaged 23% lower when the bar was flashed in the RF (top of Figure 3B) and 13% lower when the bar was carried into the RF with a saccade (bottom of Figure 3B). The response difference with gray and natural backgrounds appears roughly 100 milliseconds after stimulus onset. Both panels of 3B also show that population responses to the bar on the natural background were slightly higher before stimulus onset. This was likely due to elements of the natural background in RFs prior to the bar stimulus.
Overall, the natural image background appeared to exert a suppressive effect upon responses to a bar in the RF. This is consistent with previous studies of surround suppression reported in V1, in which high-contrast extra-RF stimuli have been shown to exert greater suppression than equiluminant homogeneous fields (Cavanaugh et al. 2002; Jones et al. 2001; Levitt and Lund 1997; MacEvoy et al. 1998; Sceniak et al. 2001; Sceniak et al. 1999; Sillito et al. 1995). Most previous studies were conducted with simple stimuli such as lines or gratings in the surround and it is important to note that we cannot say our results depend on the “naturalness” of the stimuli we used, though data from Guo et al. (2005) suggest that the statistics of natural images play a role. In any event, it appears that the luminance contrast in the natural image background produced greater surround suppression despite the same mean luminance in natural and gray backgrounds. With this in mind, for a subset of neurons we recorded responses to a modified natural background condition that used a buffer patch set at four times the RF diameter. Figure 4 shows average responses to this stimulus, along with responses evoked with the standard small buffer and the full gray screen. Not surprisingly, we found the average response in the large buffer condition was intermediate between the responses in the small buffer and full screen gray conditions.
Figure 4.

Comparison of responses elicited by a flashed bar with a small buffer (dashed trace), large buffer (solid trace), and full screen gray background (bold trace). Data are averaged normalized responses for 19 neurons. The small buffer was twice the RF diameter and the large buffer was four times the RF diameter. Much of the surround suppression comes from a distance greater than four times the RF size.
Effect of saccades on bar responses
Next, we analyzed differences in responses to the bar stimulus resulting from the mode with which it entered the RF: either as a flash during fixation or via saccade. Figure 5A compares the responses of one neuron to identical bars differing only in their mode of RF entry. For a bar and buffer embedded in the natural background (Fig. 5A, top), the cell responded with a markedly higher response after a saccade than during fixation. When the bar was on the gray background (Fig. 5A, bottom), the saccade stimulus likewise elicited a higher response, though to a lesser extent.
Figure 5.

Comparison of responses to a bar flashed in the RF or entering via saccade. (A) Single unit saccade and flash responses to a bar presented on the natural image background (top) and gray background (bottom). (B) Population responses to flash and saccade stimuli on natural image (top) and gray background (bottom). Traces represent normalized responses for 59 neurons. Responses to the identical stimulus were generally higher in saccade conditions.
For stimuli on the natural background, saccade and flash mode responses were significantly different for 23 of 59 (39%) neurons (t-test, p<0.05). For all of these cells, firing rates were higher with saccades, in some cases markedly so. With the gray background, stimulus mode produced different firing rates less frequently: only 10 neurons (17%) showed significant differences, always with higher responses in saccade conditions. Population responses, shown in Figure 5B, mirror these statistics. Across all cells, responses to stimuli flashed with the natural background averaged 14% less than in corresponding saccade conditions, while responses to stimuli flashed on the gray background averaged 4% less than their saccade counterparts. In ongoing experiments we are examining the question of whether the mode differences we observed require saccades or alternatively would be obtained with an identical temporal pattern of retinal stimulation in a fixating animal.
Interaction between the effects of context and mode
On both natural and gray backgrounds, we find that responses in saccade trials are greater than on flash trials. In the normalized population average, the response enhancement associated with saccades was greater with the natural background than with the gray background. Understanding the basis for this difference is critical. Because we measured it as a percentage of total response, it is possible that the apparent difference in enhancement could be the misleading result of a constant saccade-related effect combined linearly with different response rates on the two different backgrounds. Alternatively, this difference might indicate a non-linear interaction between natural scenes and saccades that causes the saccade enhancement to be larger in absolute terms (i.e. not just percentage of response) with the natural background. If this were the case, it would indicate that responses with natural scenes and saccades could not be easily predicted from the independent contributions of these factors.
To make a more direct comparison between the effects of saccades on the natural and gray backgrounds, we performed a two-way ANOVA on firing rates evoked by all four principal stimulus conditions: natural background flash, natural background saccade, gray background flash, and gray background saccade. Consistent with our previous analysis, we found that both background type and behavioral mode had highly significant effects upon firing rates (p < 0.0001) at the population level (n=59). Moreover, there was a highly significant interaction between the effects of background type and behavioral mode (p = 0.0005). This non-linearity corresponded to a significantly greater difference, on average, between flash and saccade conditions when stimuli appeared on the natural background versus the gray background (as in Figure 5). In other words, the interaction between background context and mode is a significant and real effect, rather than an artifact of the analysis. Further, the existence of an interaction means that independent analyses of the effects of background type and behavioral mode could not have predicted the population response under conditions mimicking natural vision.
Figure 6 illustrates in another way the interaction between background (surround suppression) and presentation mode. The lower and upper curves in this figure show the average response of 19 neurons in the flash condition with the standard small buffer patch on a natural scene background (dashed line) and a full-screen uniform gray background (heavy solid line). The light solid trace shows the response with the standard small buffer patch on a natural background in the saccade condition. The average response in the saccade condition was, like the response in the flashed condition with the large buffer (Figure 4), intermediate between the other curves. Thus, the effect of introducing the stimulus into the RF via saccade was a reduction in surround suppression similar to the reduction observed when the suppressive stimulus is removed from the immediate vicinity of the RF (in the flash conditions). This suggests that the impact of surround suppression upon V1 activity during natural vision is not as great as would be predicted by experiments using conventional fixation paradigms.
Figure 6.
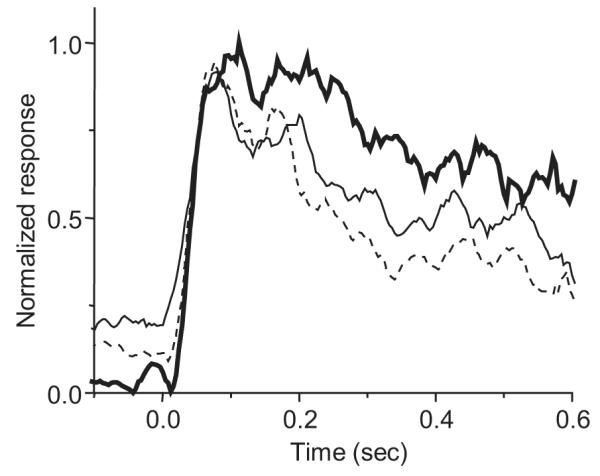
Interaction between surround suppression and presentation mode. The bold curve shows the average response to a bar flashed on a uniform gray background. The other two curves contrast the average responses to the same bar on a natural scene background with a small (2×RF) buffer presented either via flash (dashed curve) or saccade (intermediate solid curve). In both flash and saccade conditions, the natural background beyond the buffer suppresses the response. In the saccade condition, the response with the small buffer patch is greater than the response with the same buffer in the flash condition. The small-buffer saccade response is comparable to the flash response with a much larger (4×RF) buffer (compare Figure 4). These data suggest that there is less surround suppression near the RF in the saccade condition.
Finally, consistent with a real interaction between background and behavioral mode (although not necessarily indicative of one), individual neurons frequently displayed effects of both factors. For example, of the 23 neurons that had significantly higher responses in saccade conditions than flash conditions with the natural background (mode effect), 16 also showed a significant effect of background type (i.e. greater response with gray than natural background in flash conditions).
Possible causes of mode-dependent response differences
The most surprising finding in our data is that responses to identical stimuli are often significantly different when a stimulus is flashed or enters the RF via saccade. Because this finding has broad and important implications for the interpretation of V1 recordings, we investigated possible causes of the mode difference.
Fixational eye movements
Previous studies of the effects of fixational eye movements have yielded conflicting reports of response enhancement and suppression (Leopold and Logothetis 1998; Martinez-Conde et al. 2000; Snodderly et al. 2001). Conceivably, differences in fixational eye movements (too small to abort a trial) in flash and saccade conditions might underlie the higher saccade condition responses. A reason to speculate that fixation differences could occur has to do with timing -- in saccade conditions, stimulus onset coincided with the end of a large saccade (or sometimes a corrective saccade), while in flash conditions stimulus onset followed the end of a large saccade by several hundred milliseconds of steady fixation. Indeed, we found differences in eye speeds averaged across trials from all recording sessions (Figure 7A). The speed trace for saccade conditions shows both the large saccade that brings the RF to the bar stimulus at time zero, as well as a second peak some 200 milliseconds later, corresponding to corrective and fixation saccades that keep the eye within the fixation window.
Figure 7.

Contribution of fixation saccades to bar responses. (A) Absolute value of eye velocity for saccade and flash conditions with natural background, averaged across all trials in all recording sessions. Absolute values were taken before averaging. The vertical scale is expanded and the saccade curve is cropped so that details can be seen at later times. (B) Raw single cell responses for saccade (dashed trace) and flash conditions. (C) The same cell response as in (B) after discarding spikes following fixation saccades by less than 100 ms. Eliminating spikes possibly resulting from fixation saccades does not abolish the larger response in the saccade condition.
We tested the hypothesis that differences in eye movements influenced responses by filtering responses possibly associated with small saccades. For each neuron, we scanned eye position records from each trial of every stimulus condition for eye movements exceeding 20°/sec in the period following acquisition of the central fixation point. (This threshold was selected empirically; eliminating all trials with eye movements reaching or exceeding this speed abolished any appreciable differences between the two traces in Figure 7A after time zero.) We then discarded any action potentials from the corresponding spike train which followed the targeted eye movement by less than 100 milliseconds, with the goal of excluding any spikes likely to have been caused by the eye movement. Figure 7B shows an example neuron that had a higher response to the bar in the saccade condition. Figure 7C shows that discarding spikes following “fast” eye movements had little effect on the cell’s higher response for stimuli introduced via saccades. When we applied this analysis to all cells in our population, a sizeable fraction retained significantly higher responses to saccade stimuli. For stimuli on the natural background, 16/59 cells (27%) still had significantly higher responses to the saccade condition after discarding spikes, compared to 23/59 previously. Since we disqualified every spike following an eye movement, we likely grossly overestimated the contribution of eye movements to cells’ responses. Fixation saccades may have played some role in the enhanced responses we observed in saccade conditions, but they clearly cannot account for most of the effect.
Stimulus motion
In saccade conditions, the stimulus bar quickly moved into the RF as the final fixation point was acquired. There was no similar bar movement in flash conditions because steady fixation was required before the bar appeared. Though the duration of the bar motion in saccade conditions was only a few milliseconds, corresponding to the time it took the eyes to traverse a distance half the RF size, it is conceivable that this movement causes the higher responses in saccade conditions. We considered this unlikely since differences in saccade and flash responses were not typically evident in the earliest portion of the response, at the time closest to the short period of stimulus motion. Nonetheless, we analyzed our data for evidence of a contribution of bar movement to saccade condition responses.
Since V1 neurons are most sensitive to motion orthogonal to their preferred orientation, we predicted that if significantly higher responses in saccade conditions were a result of bar motion, they should occur more frequently among neurons with preferred orientations orthogonal to the axis of eye movement. Because all saccades we directed were horizontal, this means that cells with significant mode differences should have had preferred orientations biased towards vertical, while cells without significant differences should have tended to have preferred orientations closer to horizontal. This is not what we found. After expressing each cell’s preferred orientation relative to horizontal, we found that the mean preferred orientations for cells with and without significant mode differences with the natural background were nearly identical (49° and 52° from horizontal, respectively). Furthermore, both groups contained neurons with preferred orientations spanning the entire range between 0° and 90°, as illustrated in Figure 8. Therefore, it does not appear that bar motion during saccades can account for the response difference in flash and saccade conditions.
Figure 8.
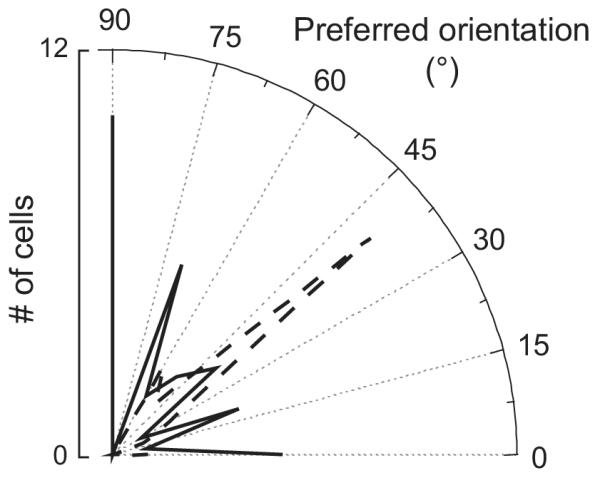
Preferred orientations of recorded cells. The dashed distribution shows preferred orientations for cells with a significant difference between saccade and flash conditions. The solid distribution represents cells without a significant mode difference. There is no apparent correlation between preferred orientation and significant mode effects, suggesting that the difference between flash and saccade responses does not result from movement of the bar across the RF during saccades.
Residual activity
Another possible explanation for higher responses in saccade conditions lies in differences between RF contents prior to the bar stimulus. There are two ways that prior stimuli might influence the response. One possibility is that saccade condition responses were augmented by residual activity evoked by high contrast stimuli in RFs immediately before or during the saccade, particularly in conditions with the natural background. Judge et al. (1980) reported that the response to an optimal bar stimulus present during a saccade combined non-linearly with the response to a post-saccadic bar. In the fixation condition, there was a delay between acquisition of the final fixation point and presentation of the bar stimulus, which might have minimized any effect of prior RF stimulation. A second possibility is that activity is not “carried over” from one fixation to the next, but instead some type of adaptation or gain adjustment from the prior fixation affects responsivity on the final fixation. This latter effect we refer to as “response history”. Residual activity is examined in this section and response history is discussed generally and in the context of mode differences in the following section.
To measure residual activity preceding the bar stimulus, we analyzed cells’ responses in flash conditions during the period immediately following the saccade to the central fixation point, but before the bar appeared (dark shaded region in top of Figure 9A). RF stimulation was essentially identical for saccade and flash conditions prior to that point since the previous fixation points and saccade trajectories were the same for both. Therefore, activity recorded in flash conditions immediately following the last saccade reflected residual activity that might affect saccade condition responses to the bar stimulus. Figure 9B plots each cell’s response to the bar on the natural background in the saccade condition against residual activity from the corresponding fixation condition, both normalized to the cell’s response to the bar flashed on the gray background. Linear regression through these data yields a line with a small position slope and an R2 value of 0.12. Residual activity therefore appears to make some contribution to higher saccade responses, but is clearly not the determining factor. Moreover, residual activity cannot explain higher saccade responses observed with the gray background, when no comparable pre- or trans-saccadic stimuli were present.
Figure 9.

Relationship between residual activity and responses in saccade conditions. (A) Flash and saccade conditions were identical in the light-shaded time interval except that the bar stimulus was not yet presented in flash conditions. Spike counts in the dark-shaded interval were used to quantify residual activity possibly carried over from the previous fixation and the saccade that acquired the final fixation point. The dashed lines indicate when the bar stimulus appeared in the RF. (B) Each data point represents the saccade condition response for one cell, normalized to the cell’s bar response in the flash condition. Two points are plotted for each cell, one corresponding to rightward saccades, and the other to leftward saccades. Open symbols denote cells with significant differences between saccade and flash bar responses. The dashed line shows the best linear fit to all data points. There is a tendency for neurons with higher residual responses to have higher responses to the bar in the saccade condition.
Response history: general effects and mode differences
In saccade conditions, the RF covered a portion of the natural image background until the final saccade carried the bar into the RF. On the other hand, in flash conditions the RF rested upon the blank gray buffer patch for several hundred milliseconds prior to bar onset. Conceivably, differences in saccade and flash conditions could have been related to differing response histories produced by these pre-bar stimuli.
Before examining what contribution response history made to flash versus saccade mode differences, we first explored the role that response history played in determining responses in general. Gawne and Woods (2003) previous study with Walsh patterns suggests that responses interact across saccades. Recall that in our experiments each saccade condition was composed of two “sub-conditions”: one with a saccade from the left, and another with a mirror-image saccade from the right. Since the pre-bar contents of RFs differed dramatically for each saccade direction (for examples see insets, Figure 10A), and often elicited different responses, by comparing the left and right saccade “sub-conditions” we could evaluate the contribution of history to responses elicited by identical post-saccade stimuli. For each cell, we computed a response margin (RM) between left and right saccade sub-conditions by dividing the difference in average bar responses by their sum. (Responses were taken from the first 500 milliseconds that the bar was in the RF.) For each cell, the RM is a value between −1 and 1, corresponding to no bar response in the left saccade sub-condition and no bar response in the right saccade sub-condition, respectively. A value of 0 denotes identical average responses. Response margins so derived are referred to as “bar” RMs. Next we computed RMs from cells’ responses during the 500 millisecond period immediately preceding entry of the bar into RFs. These are referred to as “pre-bar” RMs. We also computed RM values for the flash conditions, which were similarly composed of two left and right sub-conditions — see Methods for full condition descriptions. For these, time 0 is the onset of the bar, and the pre-bar epoch corresponds to the 500 milliseconds before stimulus onset during which the RF was covered by the gray buffer.
Figure 10.

Contribution of response history to bar-evoked responses. (A) Relationship between response history and left/right response differences. Each data point relates the response margin between left and right bar responses (x-axis) with left and right pre-bar responses (y-axis). The upper and lower insets show examples of RF contents during penultimate fixations to the left or right, respectively, of the final fixation point. Two points are plotted for each cell in the population, one each for saccade and flash conditions. The dashed line shows the best linear fit through all data points. Cells with higher responses on the penultimate fixation tend to have lower responses to the final bar stimulus. The gray boxes highlight the disproportionate number of points in the upper left and lower right quadrants. (B) Relationship between response history and saccade/flash response differences. Each data point relates the RM between saccade and flash bar responses (x-axis) with saccade and flash pre-bar responses (y-axis), for conditions with the natural image background. Two points are plotted for each cell in the population, one each for trials started with saccades from the left and right. Open symbols are plotted when saccade and flash bar responses were significantly different. The dashed line shows the best linear fit through all data points. There is a mild but highly significant correlation such that greater response differences on penultimate fixations in flash and saccade conditions are associated with smaller response differences to the bar stimulus on the final fixation.
Figure 10A is a scatter plot of pre-bar RMs versus bar RMs derived from both saccade and flash conditions for all cells. For each cell, RMs for flash and saccade conditions are plotted separately. Points in the upper half of the graph represent bar RMs above zero and indicate higher bar responses in the left than right saccade condition. Points on the right side of the graph represent pre-bar RMs above zero and indicate higher responses on the preceding fixation in the left than right saccade condition. To determine the contribution of differential response histories to left-right bar response differences, we performed a linear regression through the points in Figure 10A with pre-bar RM as the independent variable. Although the proportion of variation in bar RMs explained by pre-bar RMs is small (R2 = 0.03), the slope of the regression line is significantly less than zero (p = 0.04). This negative relationship is consistent with visual inspection of the scatter plot, which reveals a majority of data points in the upper left and lower right quadrants. Consistent with the standard view of neuronal adaptation, responses to the bar stimulus tended to be higher when preceded by relatively weak pre-bar activity, and vice-versa.
To understand whether this adaptation effect could explain differences between behavioral modes, we next computed RMs for each cell from differences between saccade and flash conditions. Resulting pre-bar and bar RMs are plotted in Figure 10B. Two points are plotted for each neuron, one for each saccade direction. If adaptation were to account for the tendency of neurons to have higher saccade responses, the distribution of data in 10B should show two features. First, there should be a negative dependency of bar RMs upon pre-bar RMs, just as in 10A; this is clearly the case, evinced by the negative slope of the regression line. More importantly, however, pre-bar RMs should fall predominantly to the left of zero on the x-axis, denoting lower pre-bar responses in saccade conditions relative to flash conditions. In fact, we find that the opposite is true: the median pre-bar RM was 0.2, indicating that a majority of neurons had higher responses during pre-bar epochs in saccade conditions. This is inconsistent with an adaptation-based explanation for our populations tendency toward higher responses in saccade conditions. To be sure, adaptation may have contributed to higher bar responses in saccade conditions for some neurons (and lower saccade responses among others). However, it appears that saccades produce an additional form of response enhancement that is independent of response history. This independence is captured by the significantly elevated (p < 0.0001) y-intercept of the regression line in 10B, which illustrates that even among neurons with the no difference in pre-bar activity, saccade conditions tended to produce higher responses during the bar epoch.
Discussion
We have characterized responses of V1 neurons during free-viewing, under conditions replicating previous work with isolated, flash stimuli, and under controlled conditions incorporating natural scenes and saccades. Our experiments and analysis focus on the temporal response patterns in different situations, rather than the tuning properties or RF kernels examined in other studies.
Influence of natural context and eye movements on V1 responses
We find that during free-viewing, the mean and peak responses are lower than during stimulation with an optimized bar stimulus. However, this difference is much smaller than one might guess given the uncontrolled contents of RFs during free-viewing; free-viewing can elicit quite strong responses. That said, an important comparison is between the peak response to an optimal bar and the mean free-viewing response. In the large literature on V1, data are typically presented in post stimulus time histograms and there is a tendency to focus on the peak of the response as indicative of a cell’s properties. The fact that the mean free-viewing response is drastically less than this peak serves as a reality check for what neurons are doing most of the time outside the laboratory.
In more controlled conditions, we found that both background type and viewing mode significantly influenced V1 responses to a standard stimulus. Lower responses to the bar embedded in the natural scene background are consistent with previous reports of response suppression from stimuli beyond classical RF boundaries both with reduced stimuli (Blakemore and Tobin 1972; Cavanaugh et al. 2002; DeAngelis et al. 1994; Fries et al. 1977; Jones et al. 2001; Kastner et al. 1997; Knierim and van Essen 1992; Levitt and Lund 1997; MacEvoy et al. 1998; Muller et al. 2003; Nelson and Frost 1978; Rossi et al. 1996; Sceniak et al. 1999; Sengpiel et al. 1997; Series et al. 2003; Sillito et al. 1995; Toth et al. 1996; Walker et al. 1999) or with natural images (Gallant et al. 1998; Guo et al. 2005; Vinje and Gallant 2002; 2000). Neglecting the role of eye movements, natural backgrounds suppress V1 activity, even when the luminance of a comparative gray background is equated to the mean of the natural background.
More surprising were the higher responses we observed in saccade conditions, an effect which has not been previously reported. Motivated by perceptual saccadic suppression (Ross et al. 2001), several studies have examined the effects of saccades upon V1 responses to stimuli in RFs during eye movements (Battaglini et al. 1986; Judge et al. 1980; Thiele et al. 2002; Yu and Lee 2000). Judge et al. (1980) employed an approach similar to ours to examine the capacity of pre- and post-saccadic stimuli to modify responses to trans-saccadic stimuli. Consistent with their focus on trans-saccadic stimuli, however, Judge et al. made no comparison between responses to post-saccadic stimuli flashed in RFs versus brought into RFs via saccade, nor any evaluation of the effects of saccades by themselves (i.e., absent trans-saccadic stimuli) upon responses to subsequent stationary stimuli. In contrast, our study is among the few (Gallant et al. 1998; Gawne and Martin 2002; Livingstone et al. 1996; Wurtz 1969) to directly compare the effects of saccades upon responses to subsequent stimuli viewed during fixation (i.e. the period of normal visual perception). At first glance, there appears to be striking disagreement between various studies as some report different responses with free viewing and fixation (Gallant et al. 1998; Livingstone et al. 1996) and others report generally no difference in response between stimuli coming into RFs via saccade or flash (Gawne and Martin 2002; Wurtz 1969). The reason the latter studies did not report consistent saccade effects is probably to a degree a consequence of data analysis. Wurtz’ early study was largely qualitative. Gawne and Martin did quantify their results, but the temporal analysis focused on response latency. Richmond et al. (1999) show the response of a neuron which appears qualitatively different with flash and saccade stimulus presentations, but the focus of the analysis was orientation tuning and response variability. Livingstone et al. (1996) reported responses of V1 neurons to bars and circles during free viewing, but did not provide any comparison with responses to similar stimuli when presented traditionally. Gallant et al. (1998) compared responses to natural images during free-viewing with image patches presented during fixation. However, in that study, responses were averaged over multiple different fixations, and side-by-side comparisons of responses to identical stimuli with and without eye movements were not made. Our distinct experimental and analysis approach complements these previous studies.
Several factors may have contributed to the higher responses we found in saccade conditions. We analyzed possible roles of fixational saccades, residual activity carried into the final fixation, and movement of the bar stimulus across the RF in saccade trials, all of which are present during normal visual behavior outside the laboratory. While none of these factors appears sufficient to explain higher responses in saccade conditions, it is possible that their effects may have combined to produce the significant response differences we observed. Testing this conjecture merits further study. Regardless of the source of the response differences we observed, our data demonstrate that responses under natural vision conditions are not fully predicted by results of traditional experiments, especially when eye movements come into play. The effects of background type and behavioral mode combined in a complex fashion to produce responses that could not have been predicted by measuring each in isolation. The difference in response between flash and saccade conditions was significantly greater with a natural background than with a uniform gray background; looked at differently, the same data show that the impact of a suppressive stimulus is significantly smaller when stimuli enter RFs via saccades. Whether eye movements per se are necessary to produce the enhancement we saw, or whether the same effects could have resulted from artificial stimulus motion mimicking saccades is a topic we are presently investigating. Recent work in cat visual cortex has shown that saccades induce long-lasting changes in the frequency spectrum of neuronal firing that differ from those produced by comparable stimulus changes without eye movements (Moeller et al. 2007).
Our experimental conditions were similar to those employed by Kusunoki et al. (2000) in their study of the macaque lateral intraparietal area (LIP). That study, like ours, compared responses of neurons to stimuli which appeared suddenly during fixation to those that entered RFs via saccades. Kusunoki et al. found that responses in LIP neurons were greater when stimuli were flashed in RFs than when they entered with a saccade, which the authors concluded was a result of the greater salience of flashed stimuli. Although we found the opposite, it is possible that post-saccadic enhancement is the signature of the equally important efforts of the visual system to maintain a stable representation of the visual world across eye movements. Just as saccadic suppression likely assists this process by filtering extraneous transient stimuli, post-saccadic enhancement may assist it by emphasizing sources of stable stimulation.
Response history effects on V1 activity
We found that there is a significant effect of response history on V1 responses. In our experiment, high pre-bar activity was generally followed by lower subsequent bar responses, consistent with adaptation. Presumably this is a general effect always at work in natural vision -- there is an interaction between responses across fixations. Temporal context is rich during natural vision, but is usually ignored in laboratory experiments with long interstimulus intervals. As to the larger responses we observed in saccade conditions, we are able to reject response history as a cause of this effect. Contrary to the general influence of response history, larger saccade condition responses to the bar stimulus were usually preceded by periods of relatively high, not low, activity compared to flash conditions. This result is consistent with that of Gawne and Woods (2003), wherein V1 responses to checkerboard patterns were less when preceded across a saccade by a similar pattern than when preceded by a uniform gray field. We extend this finding by showing that it is not merely the presence of a prior stimulus in the receptive field that determines subsequent suppression, but the magnitude of the response it evokes.
Interactions between natural scenes and saccades
When we combined the natural background with saccades, resulting responses were generally not predicted by linear combination of the effect of each alone. Saccades counteracted the inhibitory effect of the natural background to a greater extent than predicted by their impact on responses to stimuli presented on the gray background. This non-linearity suggests that there is less surround suppression during natural vision than in conventional laboratory paradigms. Our data do not allow us to determine precisely why this occurred. As reviewed earlier, several factors come into play during natural vision that are ignored in most explorations of surround suppression, including fixational eye movements, and residual responses from prior RF stimuli. Each of these could partially counteract surround suppression during natural vision.
The reason why surround suppression should be sensitive to saccades is not clear. One possibility is that at the end of a saccade, much of visual cortex is activated by the new stimuli introduced into essentially all receptive fields. Perhaps this leads to a different level of inhibition in the network compared with focal stimulation of a small area of cortex with an isolated flashed stimulus. Less surround suppression following saccades might facilitate maintenance of a stable visual representation across eye movements. Alternatively, higher responses after saccades may serve no purpose on their own, but rather represent a rebound from saccadic suppression. Whatever the reason for interactions between natural scenes and saccades, the point remains that it is difficult to predict the responses of neurons under natural vision conditions based on results obtained under reduced conditions. Surround and saccade influences exert opposing effects upon the magnitude of V1 responses, and can combine in a complex fashion. Thus any consideration of the behavior of neurons during natural vision should take into account not only the independent effects of the visual context and behavioral mode, but also the potential for interactions between the two. The differences in the time course and magnitude of V1 responses that we observe in reduced and natural paradigms may have important implications for the cortical circuitry activated in the different situation.
Figure 11.

Acknowledgments
The authors are grateful to Amber Pierce for technical assistance. This research was supported by grants from the National Eye Institute and the NSF/NIH program for Collaborative Research in Computational Neuroscience.
References
- Battaglini PP, Galletti C, Aicardi G, Squatrito S, Maioli MG. Effect of fast moving stimuli and saccadic eye movements on cell activity in visual areas V1 and V2 of behaving monkeys. Arch Ital Biol. 1986;124:111–119. [PubMed] [Google Scholar]
- Blakemore C, Tobin EA. Lateral inhibition between orientation detectors in the cat’s visual cortex. Exp Brain Res. 1972;15:439–440. doi: 10.1007/BF00234129. [DOI] [PubMed] [Google Scholar]
- Carpenter RH. Movements of the Eyes. Pion; London: 1988. [Google Scholar]
- Cavanaugh JR, Bair W, Movshon JA. Nature and interaction of signals from the receptive field center and surround in macaque V1 neurons. J Neurophysiol. 2002;88:2530–2546. doi: 10.1152/jn.00692.2001. [DOI] [PubMed] [Google Scholar]
- David SV, Vinje WE, Gallant JL. Natural stimulus statistics alter the receptive field structure of v1 neurons. J Neurosci. 2004;24:6991–7006. doi: 10.1523/JNEUROSCI.1422-04.2004. [DOI] [PMC free article] [PubMed] [Google Scholar]
- DeAngelis GC, Freeman RD, Ohzawa I. Length and width tuning of neurons in the cat’s primary visual cortex. J Neurophysiol. 1994;71:347–374. doi: 10.1152/jn.1994.71.1.347. [DOI] [PubMed] [Google Scholar]
- DiCarlo JJ, Maunsell JH. Form representation in monkey inferotemporal cortex is virtually unaltered by free viewing. Nat Neurosci. 2000;3:814–821. doi: 10.1038/77722. [DOI] [PubMed] [Google Scholar]
- Fries W, Albus K, Creutzfeldt OD. Effects of interacting visual patterns on single cell responses in cats striate cortex. Vision Res. 1977;17:1001–1008. doi: 10.1016/0042-6989(77)90002-5. [DOI] [PubMed] [Google Scholar]
- Gallant JL, Connor CE, Van Essen DC. Neural activity in areas V1, V2 and V4 during free viewing of natural scenes compared to controlled viewing. Neuroreport. 1998;9:2153–2158. doi: 10.1097/00001756-199806220-00045. [DOI] [PubMed] [Google Scholar]
- Gawne TJ, Martin JM. Responses of primate visual cortical neurons to stimuli presented by flash, saccade, blink, and external darkening. J Neurophysiol. 2002;88:2178–2186. doi: 10.1152/jn.00151.200. [DOI] [PubMed] [Google Scholar]
- Guo K, Robertson RG, Mahmoodi S, Young MP. Centre-surround interactions in response to natural scene stimulation in the primary visual cortex. Eur J Neurosci. 2005;21:536–548. doi: 10.1111/j.1460-9568.2005.03858.x. [DOI] [PubMed] [Google Scholar]
- Jones HE, Grieve KL, Wang W, Sillito AM. Surround suppression in primate V1. J Neurophysiol. 2001;86:2011–2028. doi: 10.1152/jn.2001.86.4.2011. [DOI] [PubMed] [Google Scholar]
- Judge SJ, Wurtz RH, Richmond BJ. Vision during saccadic eye movements. I. Visual interactions in striate cortex. J Neurophysiol. 1980;43:1133–1155. doi: 10.1152/jn.1980.43.4.1133. [DOI] [PubMed] [Google Scholar]
- Kastner S, Nothdurft HC, Pigarev IN. Neuronal correlates of pop-out in cat striate cortex. Vision Res. 1997;37:371–376. doi: 10.1016/s0042-6989(96)00184-8. [DOI] [PubMed] [Google Scholar]
- Kayser C, Kording KP, Konig P. Processing of complex stimuli and natural scenes in the visual cortex. Curr Opin Neurobiol. 2004;14:468–473. doi: 10.1016/j.conb.2004.06.002. [DOI] [PubMed] [Google Scholar]
- Kayser C, Salazar RF, Konig P. Responses to natural scenes in cat V1. J Neurophysiol. 2003;90:1910–1920. doi: 10.1152/jn.00195.2003. [DOI] [PubMed] [Google Scholar]
- Knierim JJ, van Essen DC. Neuronal responses to static texture patterns in area V1 of the alert macaque monkey. J Neurophysiol. 1992;67:961–980. doi: 10.1152/jn.1992.67.4.961. [DOI] [PubMed] [Google Scholar]
- Kusonoki M, Gottlieb J, Goldberg ME. The lateral intraparietal area as a salience map: the representation of abrupt onset, stimulus motion, and task relevance. Vision Res. 2000;40:1459–1468. doi: 10.1016/s0042-6989(99)00212-6. [DOI] [PubMed] [Google Scholar]
- Latour P. Visual threshold during eye movements. Vision Res. 1962;2:261–262. [Google Scholar]
- Leopold DA, Logothetis NK. Microsaccades differentially modulate neural activity in the striate and extrastriate visual cortex. Exp Brain Res. 1998;123:341–345. doi: 10.1007/s002210050577. [DOI] [PubMed] [Google Scholar]
- Levitt JB, Lund JS. Contrast dependence of contextual effects in primate visual cortex. Nature. 1997;387:73–76. doi: 10.1038/387073a0. [DOI] [PubMed] [Google Scholar]
- Livingstone MS, Freeman DC, Hubel DH. Visual responses in V1 of freely viewing monkeys. Cold Spring Harb Symp Quant Biol. 1996;61:27–37. [PubMed] [Google Scholar]
- MacEvoy SP, Kim W, Paradiso MA. Integration of surface information in primary visual cortex. Nat Neurosci. 1998;1:616–620. doi: 10.1038/2849. [DOI] [PubMed] [Google Scholar]
- Martinez-Conde S, Macknik SL, Hubel DH. Microsaccadic eye movements and firing of single cells in the striate cortex of macaque monkeys. Nat Neurosci. 2000;3:251–258. doi: 10.1038/72961. [DOI] [PubMed] [Google Scholar]
- Moeller GU, Kayser C, Konig P. Saccade-related activity in areas 18 and 21a of cats freely viewing complex scenes. Neuroreport. 2007;18:401–4. doi: 10.1097/WNR.0b013e3280125686. [DOI] [PubMed] [Google Scholar]
- Muller JR, Metha AB, Krauskopf J, Lennie P. Local signals from beyond the receptive fields of striate cortical neurons. J Neurophysiol. 2003;90:822–831. doi: 10.1152/jn.00005.2003. [DOI] [PubMed] [Google Scholar]
- Nelson JI, Frost BJ. Orientation-selective inhibition from beyond the classic visual receptive field. Brain Res. 1978;139:359–365. doi: 10.1016/0006-8993(78)90937-x. [DOI] [PubMed] [Google Scholar]
- Reppas JB, Usrey WM, Reid RC. Saccadic eye movements modulate visual responses in the lateral geniculate nucleus. Neuron. 2002;35:961–974. doi: 10.1016/s0896-6273(02)00823-1. [DOI] [PubMed] [Google Scholar]
- Richmond BJ, Hertz JA, Gawne TJ. The relation between V1 neuronal responses and eye movement-like stimulus presentations. Neurocomputing. 1999;26:247–254. [Google Scholar]
- Ringach DL, Hawken MJ, Shapley R. Receptive field structure of neurons in monkey primary visual cortex revealed by stimulation with natural image sequences. J Vis. 2002;2:12–24. doi: 10.1167/2.1.2. [DOI] [PubMed] [Google Scholar]
- Ross J, Morrone MC, Goldberg ME, Burr DC. Changes in visual perception at the time of saccades. Trends Neurosci. 2001;24:113–121. doi: 10.1016/s0166-2236(00)01685-4. [DOI] [PubMed] [Google Scholar]
- Rossi AF, Rittenhouse CD, Paradiso MA. The representation of brightness in primary visual cortex. Science. 1996;273:1104–1107. doi: 10.1126/science.273.5278.1104. [DOI] [PubMed] [Google Scholar]
- Ruderman DL. The statistics of natural images. Network: Comp in Neural Sys. 1994;5:517–548. [Google Scholar]
- Ruderman DL, Bialek W. Statistics of natural images: Scaling in the woods. Physical Review Letters. 1994;73:814–817. doi: 10.1103/PhysRevLett.73.814. [DOI] [PubMed] [Google Scholar]
- Sceniak MP, Hawken MJ, Shapley R. Visual spatial characterization of macaque V1 neurons. J Neurophysiol. 2001;85:1873–1887. doi: 10.1152/jn.2001.85.5.1873. [DOI] [PubMed] [Google Scholar]
- Sceniak MP, Ringach DL, Hawken MJ, Shapley R. Contrast’s effect on spatial summation by macaque V1 neurons. Nat Neurosci. 1999;2:733–739. doi: 10.1038/11197. [DOI] [PubMed] [Google Scholar]
- Sengpiel F, Sen A, Blakemore C. Characteristics of surround inhibition in cat area 17. Exp Brain Res. 1997;116:216–228. doi: 10.1007/pl00005751. [DOI] [PubMed] [Google Scholar]
- Series P, Lorenceau J, Fregnac Y. The “silent” surround of V1 receptive fields: theory and experiments. J Physiol Paris. 2003;97:453–474. doi: 10.1016/j.jphysparis.2004.01.023. [DOI] [PubMed] [Google Scholar]
- Sillito AM, Grieve KL, Jones HE, Cudeiro J, Davis J. Visual cortical mechanisms detecting focal orientation discontinuities. Nature. 1995;378:492–496. doi: 10.1038/378492a0. [DOI] [PubMed] [Google Scholar]
- Simoncelli EP, Olshausen BA. Natural image statistics and neural representation. Annu Rev Neurosci. 2001;24:1193–1216. doi: 10.1146/annurev.neuro.24.1.1193. [DOI] [PubMed] [Google Scholar]
- Smyth D, Willmore B, Baker GE, Thompson ID, Tolhurst DJ. The receptive-field organization of simple cells in primary visual cortex of ferrets under natural scene stimulation. J Neurosci. 2003;23:4746–4759. doi: 10.1523/JNEUROSCI.23-11-04746.2003. [DOI] [PMC free article] [PubMed] [Google Scholar]
- Snodderly DM, Kagan I, Gur M. Selective activation of visual cortex neurons by fixational eye movements: implications for neural coding. Vis Neurosci. 2001;18:259–277. doi: 10.1017/s0952523801182118. [DOI] [PubMed] [Google Scholar]
- Thiele A, Henning P, Kubischik M, Hoffmann KP. Neural mechanisms of saccadic suppression. Science. 2002;295:2460–2462. doi: 10.1126/science.1068788. [DOI] [PubMed] [Google Scholar]
- Tolias AS, Moore T, Smirnakis SM, Tehovnik EJ, Siapas AG, Schiller PH. Eye movements modulate visual receptive fields of V4 neurons. Neuron. 2001;29:757–767. doi: 10.1016/s0896-6273(01)00250-1. [DOI] [PubMed] [Google Scholar]
- Toth LJ, Rao SC, Kim DS, Somers D, Sur M. Subthreshold facilitation and suppression in primary visual cortex revealed by intrinsic signal imaging. Proc Natl Acad Sci U S A. 1996;93:9869–9874. doi: 10.1073/pnas.93.18.9869. [DOI] [PMC free article] [PubMed] [Google Scholar]
- van Hateren JH, van der Schaaf A. Independent component filters of natural images compared with simple cells in primary visual cortex. Proc R Soc Lond B Biol Sci. 1998;265:359–366. doi: 10.1098/rspb.1998.0303. [DOI] [PMC free article] [PubMed] [Google Scholar]
- Vinje WE, Gallant JL. Natural stimulation of the nonclassical receptive field increases information transmission efficiency in V1. J Neurosci. 2002;22:2904–2915. doi: 10.1523/JNEUROSCI.22-07-02904.2002. [DOI] [PMC free article] [PubMed] [Google Scholar]
- Vinje WE, Gallant JL. Sparse coding and decorrelation in primary visual cortex during natural vision. Science. 2000;287:1273–1276. doi: 10.1126/science.287.5456.1273. [DOI] [PubMed] [Google Scholar]
- Volkmann FC, Schick AM, Riggs LA. Time course of visual inhibition during voluntary saccades. J Opt Soc Am. 1968;58:562–569. doi: 10.1364/josa.58.000562. [DOI] [PubMed] [Google Scholar]
- Walker GA, Ohzawa I, Freeman RD. Asymmetric suppression outside the classical receptive field of the visual cortex. J Neurosci. 1999;19:10536–10553. doi: 10.1523/JNEUROSCI.19-23-10536.1999. [DOI] [PMC free article] [PubMed] [Google Scholar]
- Wurtz RH. Comparison of effects of eye movements and stimulus movements on striate cortex neurons of the monkey. J Neurophysiol. 1969;32:987–994. doi: 10.1152/jn.1969.32.6.987. [DOI] [PubMed] [Google Scholar]
- Yu SX, Lee TS. What do V1 neurons tell us about saccadic suppression? Neurocomputing. 2000;32-33:271–277. [Google Scholar]