

Abstract
Fatty acid elongases and desaturases play an important role in hepatic and whole body lipid composition. We examined the role that key transcription factors played in the control of hepatic elongase and desaturase expression. Studies with peroxisome proliferator-activated receptor α (PPARα)-deficient mice establish that PPARα was required for WY14643-mediated induction of fatty acid elongase-5 (Elovl-5), Elovl-6, and all three desaturases [Δ5 desaturase (Δ5D), Δ6D, and Δ9D]. Increased nuclear sterol-regulatory element binding protein-1 (SREBP-1) correlated with enhanced expression of Elovl-6, Δ5D, Δ6D, and Δ9D. Only Δ9D was also regulated independently by liver X receptor (LXR) agonist. Glucose induction of L-type pyruvate kinase, Δ9D, and Elovl-6 expression required the carbohydrate-regulatory element binding protein/MAX-like factor X (ChREBP/MLX) heterodimer. Suppression of Elovl-6 and Δ9D expression in livers of streptozotocin-induced diabetic rats and high fat-fed glucose-intolerant mice correlated with low levels of nuclear SREBP-1. In leptin-deficient obese mice (Lepob/ob), increased SREBP-1 and MLX nuclear content correlated with the induction of Elovl-5, Elovl-6, and Δ9D expression and the massive accumulation of monoun-saturated fatty acids (18:1,n-7 and 18:1,n-9) in neutral lipids. Diabetes- and obesity-induced changes in hepatic lipid composition correlated with changes in elongase and desaturase expression. In conclusion, these studies establish a role for PPARα, LXR, SREBP-1, ChREBP, and MLX in the control of hepatic fatty acid elongase and desaturase expression and lipid composition.
Supplementary key words: peroxisome proliferator-activated receptor α, sterol-regulatory element binding protein-1, carbohydrate-regulatory element binding protein, MAX-like factor X, liver X receptor
The liver plays a central role in whole body lipid metabolism. Fatty acids are synthesized de novo from glucose. This pathway uses products from glycolysis and, along with the two enzymes acetyl-coenzyme A carboxylase (ACC) and fatty acid synthase, generates palmitate (16:0). Insulin, triiodothyronine (T3), glucocorticoids, and glucose induce, and C20 PUFAs, glucagon, and epinephrine suppress, de novo lipogenesis (1–3). The liver also modifies fatty acid structure through metabolic pathways that include desaturation, elongation, mono-oxidation, and peroxisomal β-oxidation (chain shortening). Such modifications occur to fatty acids generated de novo as well as fatty acids derived from the diet. These pathways are particularly critical for the generation of end products of PUFA synthesis. Arachidonic acid (20:4,n-6) and docosahexaenoic acid (22:6,n-3) are the main C20–22 PUFAs accumulating in membranes of all tissues (4). Together, these metabolic pathways play an important role in the maintenance of membrane lipid composition and lipid storage, the generation of precursors for signaling molecules, such as eicosanoids, and the control of fatty acid-regulated transcription factors (2, 5, 6).
Of the various pathways known to affect fatty acid structure, physiological control of fatty acid elongation remains poorly defined. The predominant pathway for fatty acid elongation occurs in the endoplasmic reticulum and uses malonyl-CoA and fatty acyl-CoA as substrates for the addition of two carbons to fatty acids. Elongases are condensing enzymes that interact with 3-keto acyl-CoA reductase, a dehydratase, and trans-2,3-enoyl-CoA reductase to elongate fatty acids (7–9). The rate of fatty acid elongation is determined by the activity of the elongase (condensing enzyme) and not the reductases or the dehydratase. Seven distinct fatty acid elongase subtypes [fatty acid elongase-1 (Elovl-1) through Elovl-7] are present in the mouse, rat, and human genomes (www.ensembl.org). Elovl-1 (Ssc1) and Elovl-6 (LCE, FACE, rElo2) elongate saturated and monounsaturated fatty acids. Elovl-6 is induced in transgenic mice overexpressing sterol-regulatory element binding protein-1 (SREBP-1) (10–12). Elovl-2 (Ssc2) substrates include C20–22 PUFAs, whereas Elovl-5 (FAE1, Relo1, Helo1) uses a broad substrate array, C16–22 (10, 13). Elovl-2 and Elovl-5 likely play a role in endogenous PUFA synthesis [i.e., the conversion of the essential fatty acid precursors linoleic acid (18:2,n-6) and α-linolenic acid (18:3,n-3) to arachidonic acid (20:4,n-6) and docosahexaenoic acid (22:6,n-3)] (11). Elovl-3 (Cig30, Elo3) and Elovl-4 (Elo4) are expressed in the skin (14) and retina (15), respectively. Both Elovl-3 and Elovl-4 elongate a broad array of fatty acids (≤C26). Elovl-3 is induced in brown adipose tissue after exposure of animals to cold (16). Elovl-7 has not been characterized.
We recently reported on the tissue-specific, nutritional, and developmental regulation of fatty acid elongases in the rat (17). The outcome of those studies suggested that hepatic elongase expression might be controlled by at least two transcription factors, peroxisome proliferator-activated receptor α (PPARα) and SREBP-1. This report extends those findings by examining SREBP-1, PPARα, liver X receptor (LXR), carbohydrate-regulatory element binding protein (ChREBP), and MAX-like factor X (MLX) control of elongase and desaturase expression. Our analysis also includes in vivo studies to determine whether changes in hepatic lipid composition induced by diabetes or obesity correlated with changes in elongase and desaturase expression. Overall, these studies establish a role for specific transcriptional regulatory networks in the control of hepatic desaturase and elongase gene expression and hepatic lipid composition.
MATERIALS AND METHODS
Human liver tissue
Human liver was obtained from the National Disease Research Interchange (Philadelphia, PA).
Animals
All procedures for the use and care of animals for laboratory research were approved by the All University Committee for Animal Use and Care at Michigan State University.
Streptozotocin-induced diabetes
Male Sprague-Dawley rats (200–250 g; Charles River Laboratories, Kalamazoo, MI) were maintained on Harlan-Teklad laboratory chow (No. 8640) and water ad libitum. Rats were injected intraperitoneally with streptozotocin (7.5 mg/100 g body weight) and 3 ml of 25% glucose (18). Three weeks later, blood glucose was measured in animals receiving no streptozotocin (control) or streptozotocin (diabetic; blood glucose ≥ 120 mg/dl). Blood glucose was measured in isoflurane-anesthetized rats using a glucose meter (Freestyle Flash; Thera Sense, Inc., Alameda, CA). Control and diabetic rats were euthanized (isoflurane anesthesia and exsanguination) for recovery of blood (plasma) and liver.
High-fat feeding of C57BL/6 mice
Male C57BL/6 mice (Jackson Laboratories, Bar Harbor, ME), 2 months of age, were fed diets containing 10% lard (D12450B) or 60% lard (D12492; Research Diets, Inc.) ad libitum for 10 weeks. Four days before euthanasia, mice were subjected to a glucose tolerance test. Briefly, mice were injected with glucose (2 g/kg ip). Blood was withdrawn from the tail vein before and after glucose treatment. Blood glucose was measured using a hand-held glucose meter (Freestyle Flash; Thera Sense, Inc.). Mice were euthanized using isoflurane and exsanguinated; blood and liver were recovered. Livers were used for RNA and lipid extraction.
Lean and obese mice
Livers from lean and obese C57BL/6 mice were obtained from Drs. D. Romsos and K. Claycomb (Department of Food Science and Human Nutrition, Michigan State University). Male lean (C57BL/6J-Lepob/+) and obese (C57BL/6J-Lepob/ob) mice (B6.V-Lep ob/J, No. 000632; Jackson Laboratories) were maintained on a Harlan-Teklad laboratory chow (No. 8640) diet and water ad libitum. Livers were used for RNA, lipid, and protein extraction.
Wild-type and PPARα-deficient mice
Homozygous wild-type and PPARα-deficient (PPARα−/−) mice on a Sv/129 genetic background (19, 20) were fed either a control diet or one containing WY14643 (at 50 or 500 mg/kg; Bio-Serv, Piscataway, NJ) for 1 week. Mice were euthanized, livers were removed, and RNA was isolated for analysis of gene expression.
Primary rat hepatocytes
Male Sprague-Dawley rats (Charles River Laboratories) were maintained on Harlan-Teklad laboratory chow (No. 8640) and water ad libitum. Rat primary hepatocytes were prepared from Teklad chow-fed (ad libitum) male Sprague-Dawley rats and cultured on BioCoat (type 1 collagen) plates (Beckon Dickinson, Bedford, MA) (21). For RNA and protein extraction, cells were plated onto 100 mm type 1 collagen-coated plates (BD Bioscience, Bedford, MA) at 107 cells/plate in Williams E (Gibco/Invitrogen, Carlsbad CA), 10 mM lactate, 10 nM dexamethasone, 1 μM insulin (Sigma, St. Louis, MO), and 10% fetal bovine serum (Gibco/Invitrogen). For adenoviral infection studies, cells were plated in the same medium onto six-well type 1 collagen-coated plates at 1.5 × 10⁶ cells/well. The ratio of culture medium to cell number was maintained constant for the different plating conditions. For treatments, hepatocytes were incubated in medium [Williams E + 10 nM dexamethasone with or without 1 μM (0.17 U/ml) insulin and/or 25 mM glucose].
RNA extraction, Northern analysis, and quantitative real-time PCR
Total RNA was extracted from primary hepatocytes or liver samples and used as a template for quantitative real-time (qRT) PCR or Northern analysis as described previously (17, 22). Specific primers for each gene (Table 1) were designed using Primer Express software (Applied Biosystems, Foster City, CA). First-strand cDNA was synthesized using SuperScript II RNase H reverse transcriptase (Invitrogen). Synthesized cDNA was mixed with 2× SYBR Green PCR Master Mix (Applied Biosystems) and various sets of gene-specific forward and reverse primers and subjected to real-time PCR quantification using the ABI PRISM 7700 Sequence Detection System (Applied Biosystems). All reactions were performed in triplicate. The relative amounts of mRNAs were calculated using the comparative threshold cycle method (User Bulletin No. 2; Applied Biosystems). Cyclophilin was used as a control, and all results were normalized to the abundance of cyclophilin mRNA. Primers used for qRT-PCR are listed in Table 1.
TABLE 1.
Primers for quantitative reverse transcriptase-polymerase chain reaction
| Gene | Forward | Reverse |
|---|---|---|
| Rat | ||
| Elovl-1 | CCCTACCTTTGGTGGAAGAA | TCCAGATGAGGTGGATGATG |
| Elovl-2 | TTTGGCTGTCTCATCTTCCA | GGGAAACCGTTCTTCACTTC |
| Elovl-5 | TACCACCATGCCACTATGCT | GACGTGGATGAAGCTGTTGA |
| Elovl-6 | CAACGGACCTGTCAGCAA | GTGGTACCAGTGCAGGAAGA |
| Δ5D | TGGAGAGCAACTGGTTTGTG | GTTGAAGGCTGACTGGTGAA |
| Δ6D | TGTCCACAAGTTTGTCATTGG | ACACGTGCAGGCTCTTTATG |
| Δ9D | ACATTCAATCTCGGGAGAACA | CCATGCAGTCGATGAAGAAC |
| LXRα | TCAGCATCTTCTCTGCAGACCGG | TCATTAGCATCCGTGGGAACA |
| LXRβ | AAGCTGGTGAGCCTGCGC | CGGCAGCTTCTTGTCCTG |
| Sterol-regulatory element binding protein-1c | GATTGCACATTTGAAGACATGCTT | GTCCCAGGAAGGCTTCCAGAGA |
| L-type pyruvate kinase | AGGAGTCTTCCCCTTGCTCT | ACCTGTCACCACAATCACCA |
| Cyclophilin | CTTCTTGCTGGTCTTGCCATTCCT | GGATGGCAAGCATGTGGTCTTTG |
| β-Actin | ACTATTGGCAACGAGCGGTT | TGTCAGCAATGCCTGGGTACA |
| Mouse | ||
| Elovl-1 | CCCTACCTTTGGTGGAAGAA | ATCCAGATGAGGTGGATGATG |
| Elovl-2 | ACGCTGGTCATCCTGTTCTT | GCCACAATTAAGTGGGCTTT |
| Elovl-5 | GGTGGCTGTTCTTCCAGATT | CCCTTCAGGTGGTCTTTCC |
| Elovl-6 | ACAATGGACCTGTCAGCAAA | GTACCAGTGCAGGAAGATCAGT |
| Δ5D | TGTGTGGGTGACACAGATGA | GTTGAAGGCTGATTGGTGAA |
| Δ6D | CCACCGACATTTCCAACAC | GGGCAGGTATTTCAGCTTCTT |
| Δ9D | TCAACTTCACCACGTTCTTCA | CTCCCGTCTCCAGTTCTCTT |
| Cyclophilin | CTTCTTGCTGGTCTTGCCATTCCT | GGATGGCAAGCATGTGGTCTTTG |
| β-Actin | GACGGCCAGGTCATCACTAT | CGGATGTCAACGTCACACTT |
| Human | ||
| Elovl-1 | GCTGGCTGAGCACCTATACC | TCAGCTCAATGAACTTGGAGAA |
| Elovl-2 | CCCTTCGGTTGTCTCATCTT | CAGGTGGCTCTTGCATATCTT |
| Elovl-5 | GTGCACATTCCCTCTTGGTT | TGGTCCTTCAGGTGGTCTTT |
| Elovl-6 | CTAAGCAAAGCACCCGAACT | GGCAACCATGTCTTTGTAGGA |
| Δ5D | TTGGCCTGGATGATTACCTT | CTGTGTCACCCACACAAACC |
| Δ6D | ATCCCTTTCTACGGCATCCT | TAGGCCTCCTGGTCAATCTC |
| Δ9D | CACCCAGCTGTCAAAGAGAA | GATGAAGCACATCATCAGCAA |
| β-Actin | CTCTTCCAGCCTTCCTTCCT | TGTTGGCGTACAGGTCTTTG |
Δ5D, Δ5 desaturase; Elovl-1, fatty acid elongase-1; LXR, liver X receptor.
Lipid extraction and quantitation of hepatic fatty acid composition
Total lipid was extracted from liver in chloroform-methanol (2:1) plus 1 mM butylated hydroxytoluene (17). 7-Nonadecenoic acid (19:1) was added as a recovery standard at the time of extraction. Protein (Bio-Rad, Hercules, CA) was measured in extracts after the initial homogenization step. Total lipids were saponified, fractionated, and quantified by reverse-phase HPLC using a YMC J-Sphere (ODS-H80) column and a gradient starting at 77.5% acetonitrile + acetic acid (0.1%) and ending at 100% acetonitrile + acetic acid (0.1%) over 90 min with a flow rate of 1.0 ml/min using a Waters 600 controller. Fatty acids were detected using both ultraviolet light absorbance at 192 nm (Waters model 2487) and evaporative light scatter (Waters model 2420). Fatty acid composition and structures were confirmed at the Michigan State University Mass Spectrometry facility by GC-MS (www.bch.msu.edu/facilities/massspec/index.html). Fatty acid standards for reverse-phase HPLC were obtained from Nu-Chek Prep (Elysian, MN).
Immunoblotting
Liver microsomal and nuclear extracts were prepared as described previously (17, 23). Proteins (50–100 μg) extracted from microsomal or nuclear fractions were separated electrophoretically by SDS-PAGE (NuPAGE 4–12% polyacrylamide Bis-Tris; Invitrogen) and transferred to nitrocellulose membranes. Membranes were incubated with antibodies for SREBP-1 (IgG-2A4, sc-13551; Santa Cruz Biotechnology, San Cruz, CA) and SREBP-2 (IgG-7D4, monoclonal antibody). Hepatic nuclear factor-4 (HNF-4α; C-19), MLX (N-17), and anti-goat and anti-rabbit antibodies were obtained from Santa Cruz Biotechnology. ChREBP antibody was obtained from Novus Biologicals (Littleton, CO). Anti-mouse and anti-rabbit secondary antibodies were obtained from Bio-Rad; anti-goat antibodies were obtained from Santa Cruz Biotechnology. The SuperSignal West Pico chemiluminescence kit (Pierce) detection system was used.
Recombinant adenovirus
Cloning of cDNA for Elovl-2, Elovl-5, and Elovl-6 was described previously (17). The coding region for each transcript was ligated into the Ad-Easy XL adenoviral vector system (Stratagene), recombined in BJ 5183 cells, and propagated in XL10 Gold ultracompetent cells. Ad-DNA was packaged into adenoviral particles in Ad-293 cells. The resulting adenovirus was amplified in HEK293 cells.
Recombinant adenovirus-expressing dominant negative MLX (Ad-dnMLX) and doxycycline-inducible nuclear SREBP-1c (Ad-nSREBP-1) were obtained from H. Towle (University of Minnesota, Minneapolis, MN) (24, 25). Adenovirus was propagated and amplified in HEK293 cells. Viral lysates were titered using the Adeno-X Rapid Titer Kit (Clontech). Confluent primary hepatocytes were infected (5–10 plaque-forming units/cell). Using Ad-green fluorescent protein as a control for infection, >80% of primary hepatocytes expressed functional protein at the 5–10 plaque-forming units/cell level.
In vitro fatty acid elongation assay
Rat liver microsomes were isolated by differential centrifugation (23). Elongation reactions were carried out with modifications to the procedure described by Moon et al. (10). Briefly, reaction mixtures contained 50 μg of microsomal proteins in a total reaction volume of 100 μl. The reaction constituents were as follows: 50 mM potassium phosphate buffer, pH 6.5, 5 μM rotenone (Sigma), 40 μM fatty acyl-CoA [Avanti Polar Lipids (Alabaster, AL) and Sigma], 60 μM malonyl-CoA (Sigma), 6.5 dpm/pmol [2-14C]malonyl-CoA (Perkin-Elmer), 1 mM NADPH (Sigma), and 20 μM BSA (fatty acid-free). Reactions (at 37°C) were initiated with the addition of NADPH. When fatty acids were used as substrate, NaOH-neutralized fatty acid (40 μM) replaced fatty acyl-CoA. Coenzyme A (CoASH) (100 μM), MgCl2 (1 mM), and ATP (1 mM) were added to the reaction to generate fatty acyl-CoA. Elongase reactions were terminated after 20 min with the addition of 100 μl of 5 N KOH plus 10% methanol; lipids were saponified for 1 h at 65°C. The saponification reaction was acidified with 100 μl of 5 N HCl; 100 μl of ethanol was added to aid hexane extraction of fatty acids. Elongated fatty acids were collected by two independent extractions with hexane (800 μl). Hexane extracts were pooled, and 14C radioactivity was quantified by β-scintillation counting. Results are expressed as elongase activity units (nmol [14C]malonyl-CoA incorporated/mg protein/20 min). Formation of reaction products was dependent on the presence of NADPH and the fatty acid-CoA. Fatty acid elongation products were verified by reverse-phase HPLC using a flow-through β-scintillation counter (6).
Statistical analysis
Statistical analysis used Student’s t-test and ANOVA plus post hoc Tukey’s honestly significant difference test (http://faculty.vassar.edu/lowry/VassarStats.html).
RESULTS
Elongase and desaturase expression in rat, mouse, and human liver
Our first objective was to compare fatty acid elongase and desaturase expression in rat, mouse, and human liver (Fig. 1A). Of the seven elongases identified in the genomes of these species, qRT-PCR analysis indicated that only four elongases are expressed in liver: Elovl-1, Elovl-2, Elovl-5, and Elovl-6. Based on relative mRNA abundance, the hierarchy of elongase expression in rat, mouse, and human liver is Elovl-5 > Elovl-1 = Elovl-2 = Elovl-6. All elongases are expressed at higher levels in mouse liver than in human liver. Elovl-2 and Elovl-6 are expressed at higher levels in mouse liver than in rat liver.
Fig. 1.

Fatty acid elongase and desaturase expression in rat, mouse, and human liver. A: Livers from male Sprague-Dawley (SD) rats (2–3 months of age), C57BL/6 mice (2–4 months of age), and female humans (44–54 years of age) were used for RNA extraction and measurement of elongase and desaturase expression as described in Materials and Methods. Rats and mice were maintained on chow (Teklad) diets ad libitum. Human livers were obtained from the National Disease Research Interchange. mRNA abundance for each elongase and desaturase was measured by quantitative real-time (qRT) PCR. Results are expressed relative to an internal standard, β-actin (transcript/actin) (means ± SD; n = 4 for rat and mouse liver, n = 3 for human liver). B: Rat, mouse, and human liver was extracted for microsomes to assay elongase activity using three separate substrates, 16:0-CoA, 20:4-CoA, and 24:0-CoA. Results are expressed as elongase activity (nmol [14C]malonyl-CoA assimilated into fatty acids/mg protein) (means ± SD; n = 4 for rat and mouse liver, n = 3 for human liver). Δ5D, Δ5 desaturase; Elovl-1, fatty acid elongase-1. * P ≤ 0.05 versus rat liver by ANOVA.
Fatty acid elongase activity was assessed using three substrates. 16:0-CoA is a substrate for Elovl-1 and Elovl-6; 20:4-CoA is a substrate for Elovl-2 and Elovl-5; and 24:0-CoA is a substrate for Elovl-1 (7). Elongation of 16:0-CoA to 18:0-CoA was highest in mouse liver, whereas elongation of 24:0-CoA to 26:0-CoA was comparable among species. Elongation of 20:4-CoA to 22:4-CoA was lowest in human liver. Differences in elongation activity can be attributed to elongase subtype expression among species. Mouse and rat liver appear to have higher elongation capacity than human liver.
Δ5 desaturase (Δ5D) and Δ6D are expressed at comparable levels in livers of all three species. Δ9D is highly expressed in mouse liver compared with rat or human livers. These results reveal important species differences in both elongase and desaturase expression in rat, mouse, and human liver.
Role of PPARα in the control of hepatic elongase and desaturase expression
Feeding rats the PPARα agonist, WY14643, induces certain hepatic fatty acid elongases and desaturases and promotes changes in hepatic and plasma lipid composition (17). Here, we further evaluated the role that PPARα plays in the control of hepatic elongase and desaturase expression. The effect of WY14643 on elongase and desaturase expression in wild-type and PPARα−/− mice was examined. Mice were fed a control diet or one containing WY14643 (at 50 or 500 mg WY14643/kg diet) for 1 week (Fig. 2). Of the four elongases expressed in mouse liver, WY14643 (500 mg/kg) induced only Elovl-5 and Elovl-6 (14- and 3.6-fold, respectively). Previous studies established that the PPARα agonist increased desaturase expression (26). Our results indicate that Δ6D and Δ9D transcript levels were induced ~6-fold by WY14643 (500 mg/kg), whereas Δ5D was weakly induced. Elovl-1 and Elovl-2 mRNA abundance was unresponsive to WY14643 treatment. The absence of a WY14643 effect on elongase and desaturase expression in PPARα−/− mice indicates that PPARα plays a role in controlling both elongase (Elovl-5 and Elovl-6) and desaturase (Δ6D and Δ9D) expression.
Fig. 2.

Role of peroxisome proliferator-activated receptor α (PPARα) in the control of hepatic elongase and desaturase expression. Homozygous wild-type (+/+) and PPARα-null (−/−) mice on a Sv/129 genetic background (19, 20) were fed either a control diet or one containing WY14643 (50 or 500 mg/kg diet; Bioserv, Piscataway, NJ) for 1 week. Liver RNA was extracted and used as a template for qRT-PCR. Results are reported as fold change in mRNA abundance (transcript/cyclophilin) for each enzyme (means ± SD; n = 4). * P ≤ 0.05 by Student’s t-test versus the wild type (+/+) on a control diet.
Regulation of elongase and desaturase expression in primary rat hepatocytes
Insulin, SREBP-1c (26, 27), the LXR agonist T0901317 (T1317), glucose, ChREBP, and MLX (24) control desaturase expression (28). The studies described below determined whether these same transcriptional regulatory systems control elongase expression in rat primary hepatocytes.
Regulation of elongases and desaturases by insulin and LXR agonist
Insulin regulates hepatic lipid synthesis, at least in part, by controlling SREBP-1 nuclear abundance (21, 29). LXR agonist stimulates lipogenesis through direct and indirect mechanisms (30). LXR/retinoid X receptor heterodimers bind LXR regulatory element in promoters of responsive lipogenic genes. LXR agonist also induces lipogenic gene expression through the induction of SREBP-1c gene transcription (29, 30). The effect of 1insulin and T1317 on hepatocyte elongase and desaturase expression was examined.
In the absence of insulin or T1317, SREBP-1 nuclear abundance in hepatocytes was low (Fig. 3, inset). Treatment of rat primary hepatocytes with insulin or T1317 induced nuclear SREBP-1 (~4-fold) but had no effect on SREBP-2 nuclear abundance. T1317 (1 μM) had no significant effect on Elovl-1, Elovl-2, or Elovl-5 expression in rat primary hepatocytes and only modestly induced Elovl-6 ~1.5-fold (Fig. 3). In contrast, all three desaturases were induced between 2- and 15-fold; Δ9D was most responsive. Insulin induced Elovl-6 and Δ5D ≤1.5-fold, whereas Δ6D and Δ9D were induced >3-fold. Cotreatment with insulin and T1317 had no additive effect on SREBP-1 nuclear abundance or the expression of any elongase or desaturase.
Fig. 3.

Effect of insulin and liver X receptor (LXR) agonist on fatty acid elongase and desaturase expression in rat primary hepatocytes. Rat primary hepatocytes were maintained in Williams E medium containing 10 mM lactate and 10 nM dexamethasone with no insulin overnight. The next day, cells were switched to Williams E medium containing 25 mM glucose and 10 nM dexamethasone [vehicle (Veh)] in the presence or absence of insulin (Ins; 1 μM) or the LXR agonist T0901317 (T1317; Cayman Chemical Co., Ann Arbor, MI) (1 μM). After 24 h of treatment, cells were harvested for RNA extraction and the measurement of nuclear sterol-regulatory element binding protein-1 (SREBP-1) and SREBP-2 by immunoblot analysis (inset; duplicate samples/treatment). Elongase and desaturase mRNA abundance was quantified by qRT-PCR. Results are expressed as fold change in mRNA versus vehicle (transcript/ cyclophilin) (means ± SD; n = 4). Results are representative of two separate studies. * P ≤ 0.05 versus vehicle by ANOVA.
These studies suggest that the induction of Elovl-6, Δ5D, Δ6D, and Δ9D by insulin and T1317 likely involves the control of SREBP-1 nuclear abundance. Although others have reported that insulin induces LXRα in primary hepatocytes (31), we found no evidence for an insulin effect on either LXRα or LXRβ mRNA abundance (data not shown). Glucocorticoids, T3, and leptin had no effect on elongase expression in primary rat hepatocytes. None of the hormones tested induced hepatic Elovl-3, Elovl-4, or Elovl-7 (data not shown).
Effect of overexpressed nuclear SREBP-1c on elongase and desaturase expression
To further evaluate the SREBP-1c control of elongase and desaturase expression, primary hepatocytes were infected with a recombinant adenovirus containing a doxycycline-inducible nuclear form of SREBP-1c (Ad-nSREBP-1c) (25). These cells received no insulin or LXR agonist. Treatment of primary hepatocytes with doxycycline significantly induced the nuclear form of SREBP-1c (data not shown) as well as the endogenous SREBP-1 transcript (Fig. 4). The endogenous SREBP-1c promoter contains an SRE and is activated by increased levels of nuclear SREBP (29). Overexpressed nSREBP-1c induced transcripts encoding Elovl-2, Elovl-6, Δ5D, Δ6D, and Δ9D ~3-fold at a doxycycline dose of 250 ng/ml. Modest induction (≤ 1.5-fold) was detected with doxycycline at 25 ng/ml.
Fig. 4.
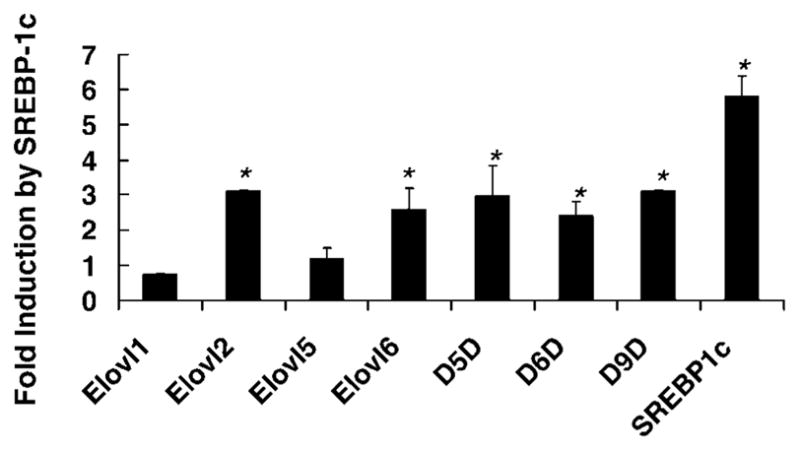
Effect of overexpressed nuclear SREBP-1c on elongase and desaturase expression. Primary rat hepatocytes in Williams E medium + 10 mM lactate + 10 nM dexamethasone but no insulin were infected with a recombinant adenovirus expressing the nuclear form of SREBP-1c under the control of doxycycline (25). Cells were switched to Williams E medium + 25 mM glucose with no insulin in the absence or presence of doxycycline (250 ng/ml). Cells were harvested 24 h afterward for RNA extraction and measurement of elongase and desaturase mRNA abundance by qRT-PCR (transcript/ cyclophilin). Endogenous SREBP-1 expression was quantified by Northern analysis. Results are represented as fold induction by SREBP-1c (means ± SD; n = 4). Results are representative of two separate studies. * P > 0.05 versus vehicle by ANOVA.
We next determined whether insulin or T1317 had any effects on elongase or desaturase expression independent of SREBP-1c. Ad-nSREBP-1c-infected cells were treated with insulin or T1317. Overexpressed SREBP-1c (Ad-SREBP-1c) induced Elovl-2 (2.6-fold) and Elovl-6 (6-fold), whereas Δ5D, Δ6D, and Δ9D transcripts were induced 3.6-, 4.8-, and 3.1-fold, respectively. Addition of insulin had no other effect on the expression of any elongase or desaturase. Addition of T1317 induced only Δ9D (~4-fold) (data not shown). The expression of no other elongase or desaturase was affected by T1317. Based on these results, the induction of Elovl-6, Δ5D, and Δ6D by insulin and T1317 (Fig. 4) is attributable to increased SREBP-1 nuclear abundance. Only Delta;9D expression was induced by increased SREBP-1 nuclear abundance and independently by LXR agonist.
Glucose, ChREBP, and MLX regulation of elongase and desaturase expression
Insulin and glucose are potent inducers of glycolysis and lipogenesis (32, 33). Insulin-stimulated glucose metabolism induces the translocation of ChREBP to the nucleus, where the ChREBP/MLX heterodimer binds carbohydrate-regulatory elements (ChoREs) in promoters of glucose-responsive genes involved in glycolysis and lipogenesis (32, 34). The effect of glucose on elongase and desaturase expression in primary hepatocytes was examined.
Primary hepatocytes were maintained in medium containing lactate (20 mM) and insulin (1 μM) or switched to medium containing 25 mM glucose plus insulin. This approach is consistent with the one used in our previous studies and by other investigators to examine glucose-regulated gene expression in primary hepatocytes (22, 24, 35–43). Glucose and insulin induced the accumulation of ChREBP in hepatocyte nuclei with no effect on MLX nuclear abundance (Fig. 5A). L-type pyruvate kinase (L-PK), a glucose-responsive transcript, is controlled at the transcriptional level by binding the ChREBP/MLX heterodimer to its promoter (24). Switching hepatocytes from lactate to glucose induced mRNAL-PK ~30-fold (Fig. 5). Elovl-6 and Δ9D mRNAs were induced 7.6- and 10-fold, respectively. No other elongase or desaturase was affected by glucose.
Fig. 5.

Effect of glucose on elongase and desaturase expression. A: Primary rat hepatocytes in Williams E medium + 10 mM lactate + dexamethasone + insulin were switched to Williams E medium + 25 mM glucose + dexamethasone + insulin. After 24 h of treatment, cells were harvested for extraction of nuclear proteins and RNA. The nuclear abundance of carbohydrate-regulatory element binding protein (ChREBP) and MAX-like factor X (MLX) was measured by immunoblotting at the times indicated (22). B: L-type pyruvate kinase (L-PK), Elovl-6, and Δ9D mRNA abundance was quantified by qRT-PCR (transcript/ cyclophilin). Results are expressed as fold induction by glucose (means ± SD; n = 4). C: In a second experiment, primary hepatocytes in Williams E medium + 10 mM lactate + dexamethasone + insulin remained uninfected (white bars) or were infected with recombinant adenovirus expressing luciferase (Ad-Luc; black bars) or dominant negative MLX (Ad-dnMLX; gray bars). After 24 h, cells were switched to Williams E medium + 25 mM glucose + dexamethasone + insulin. Twenty-four hours later, cells were harvested for RNA extraction and measurement of L-PK, Elovl-6, and Δ9D mRNA by qRT-PCR (transcript/cyclophilin). Results are represented as relative mRNA abundance relative to glucose-treated cells (means ± SD; n = 4). Results are representative of two separate studies. * P < 0.001 versus glucose-treated cells by ANOVA.
To verify the role that ChREBP/MLX heterodimers play in this regulatory process, primary hepatocytes in lactate-containing medium were infected with recombinant adenovirus expressing luciferase (Ad-Luc) or a dominant negative version of MLX (Ad-dnMLX). MLX is required for ChREBP to bind ChoREs in glucose-responsive promoters. Overexpressed dnMLX attenuates the glucose induction of L-PK (39).
Infecting cells with Ad-Luc had no effect on the glucose induction of L-PK, Elovl-6, or Δ9D (Fig. 5). Infection of cells with Ad-dnMLX completely attenuated the glucose induction of L-PK, Elovl-6, and Δ9D. Ad-Luc or Ad-dnMLX expression in primary hepatocytes had no effect on Elovl-1, Elovl-2, Elovl-5, Δ5D, or Δ6D (data not shown). These studies indicate that glucose regulates both Elovl-6 and Δ9D expression by mechanisms that control the nuclear abundance of ChREBP and MLX. ChREBP and MLX play no role in the control of Elovl-1, Elovl-2, Elovl-5, Δ5D, or Δ6D expression.
Metabolism of fatty acids by fatty acid elongases
Fatty acid elongases have overlapping substrate specificities (7, 44). Here, the substrate specificity of three fatty acid elongases was examined. Ad-Luc, Ad-Elovl-2, Ad-Elovl-5, and Ad-Elovl-6 were used to overexpress these enzymes in rat primary hepatocytes. Substrate specificity was examined using saturated (16:0), monounsaturated (16:1,n-7), and polyunsaturated (18:3,n-6, 20:5,n-3, and 22:5,n-3) fatty acids. Ad-Luc-infected cells served as a control for basal elongase activity using the various substrates. Ad-Elovl-2-infected hepatocytes elongated only 20:5,n-3 and 22:5,n-3 (Fig. 6). Ad-Elovl-5-infected cells elongated 16:1,n-7, 18:3,n-6, and 20:5,n-3. Ad-Elovl-6-infected cells elongated only 16:0 and 16:1,n-7 (Fig. 6).
Fig. 6.

Substrate specificity of hepatic fatty acid elongases. Ad-Luc, Elovl-2, Elovl-5, and Elovl-6 were used to infect primary hepatocytes (5 plaque-forming units/cell). After 24 h, cells were harvested for elongase activity using various fatty acid substrates (see Materials and Methods). Results are expressed as elongase activity (nmol [14C]malonyl-CoA assimilated into fatty acid/mg protein) (means ± SD; n = 3). Results are representative of two separate studies.
Expression of hepatic elongases and desaturases is controlled by PPARα, SREBP-1, and ChREBP/MLX (Figs. 2–5). To determine whether changes in elongase and desaturase activity affect hepatocyte fatty acid composition, primary hepatocytes incubated with insulin (induces SREBP-1), PPARα agonists, and glucose (induces ChREBP) were examined for the capacity to elongate and desaturate [14C]16:0. Primary hepatocytes were maintained in Williams E medium with lactate and no insulin overnight. This treatment effectively decreases SREBP-1 and ChREBP nuclear abundance (21, 22). The next day, cells were treated with lactate- or glucose-containing medium in the absence or presence of insulin and WY14643. All cells received 100 μM [14C]16:0. After 24 h of treatment, cells were harvested for lipid extraction and analysis of elongation and desaturation products by reverse-phase HPLC.
Cells maintained in lactate medium with no insulin or WY14643 did not desaturate 16:0 (Fig. 7), but these cells had the capacity to elongate 16:0 to 18:0. Addition of insulin or WY14643 to lactate-treated cells induced the formation of 16:1,n-7, whereas only WY14643 induced the formation of 18:1 (n-7 and n-9). The combination of these treatments had no additive effect.
Fig. 7.

Effects of insulin and WY14643 on monounsaturated fatty acid synthesis. A: The pathway for conversion of 16:0 to 16:1,n-7, 18:1,n-7, and 18:1,n-9 by Elovl-5, Elovl-6, and Δ9D. B–D: Primary rat hepatocytes in Williams E + dexamethasone + 10 mM lactate overnight were maintained in the same medium or switched to Williams E + dexamethasone + 25 mM glucose in the absence or presence of insulin (1 μM) or WY14643 (50 μM). Cells received 100 μM [14C]16:0 + 20 μM BSA for 24 h. After 24 h of treatment, cells were extracted for total lipid and the lipid was saponified. The distribution of 14C among 16:0, 16:1,n-7, 18:0, 18:1,n-7 and 18:1,n-9 was quantified by reverse-phase HPLC and a flow-through β-scintillation counter. Technical limitations preclude resolution of 18:1,n-7 and 18:1,n-9 by reverse-phase HPLC. As such, the results are reported as 18:1. Results are reported as percentage conversion of [14C]16:0 to [14C]16:1 (B), percentage conversion of [14C]16:0 to [14C]18:1 (C), and ratio of [14C]18:1 to [14C]16:1 (elongation index) (D). Results are means of duplicate samples and are representative of two separate studies.
Switching cells to glucose-containing medium promoted 16:0 desaturation to 16:1,n-7 as well as elongation and desaturation of 16:0 to 18:1 (n-7 and n-9). The combination of glucose plus insulin or glucose plus WY14643 induced the formation of both 16:1,n-7 and 18:1 (n-7 and n-9) synergistically. Glucose, insulin, and WY14643 had no apparent effect on the elongation of 16:0 to 18:0. Because 18:0 is a substrate for Δ9D, measuring changes in 18:0 may not accurately reflect changes in elongation activity. In an effort to reveal an effect on elongation, we examined the effect of glucose, insulin, and WY14643 on the 18:1-to-16:1 ratio (Fig. 7D). This ratio (elongation index) would remain constant if these treatments did not regulate elongation. The most impressive effect on the 18:1-to-16:1 ratio was seen in cells maintained in lactate-containing medium supplemented with WY14643. Such studies indicate that hepatocyte levels of 18:1 (n-7 and n-9) are controlled by both elongation and desaturation pathways. The elongation pathway is not a constitutive pathway. Cellular levels of 18:1 are not determined solely by changes in Δ9D expression.
Regulation of elongase and desaturase expression in animal models of metabolic disease
PPARα (45), SREBP-1 (46) and glucose metabolism, ChREBP and MLX (32), and LXR (47) play important roles in metabolic diseases such as diabetes and obesity. Here, we sought to determine whether changes in hepatic lipid metabolism and composition induced by diabetes and obesity can be attributed to changes in elongase and desaturase expression. Three metabolic disorders were examined: streptozotocin-induced diabetes, glucose intolerance induced by high-fat diets, and obesity induced by leptin deficiency. Nuclear levels of SREBP-1, ChREBP, MLX, and HNF-4α were monitored. We wanted to determine whether changes in the nuclear content of these transcription factors correlated with changes in elongase or desaturase expression.
Streptozotocin-induced diabetes
Rats made diabetic using streptozotocin had high blood glucose (378 ± 21 mg/dl) compared with control animals (77.9 ± 5.2 mg/dl). Liver nuclei from diabetic rats contained little detectable nuclear SREBP-1 and suppressed levels of MLX, but there was no significant change in ChREBP or HNF-4α (Fig. 8A). Diabetes suppressed the expression of lipogenic and glycolytic genes (e.g., fatty acid synthase and L-PK) by ≥70% (18), whereas expression of the gluconeogenic enzyme phosphoenolpyruvate carboxykinase was induced 3-fold (Fig. 8). The decline in the nuclear abundance of SREBP-1 and MLX correlated with an ~45% decline in Elovl-6 and a >95% decline in Δ9D mRNA abundance. Other elongases and desaturases remained unaffected. Examination of hepatic lipid composition revealed a significant 30% decline in 16:0 in diabetic animals but no change in other saturated, monounsaturated, or polyunsaturated fatty acids (data not shown). The decline in 16:0 is consistent with the decline in de novo lipogenesis in livers of diabetic rats (18).
Fig. 8.

Effect of streptozotocin-induced diabetes on hepatic elongase and desaturase expression. Male Sprague-Dawley rats were made diabetic using streptozotocin as described in Materials and Methods. Livers from control and diabetic animals were used for the isolation of nuclear and microsomal proteins for immunoblotting (A) and RNA extraction for qRT-PCR (B). A: Effect of diabetes on SREBP-1 (microsomal and nuclear), nuclear ChREBP, MLX, and hepatic nuclear factor-4 (HNF-4α) abundance. Protein levels were measured by immunoblot analysis (see Materials and Methods). Duplicate samples for each treatment are shown. The effect of diabetes on the abundance of these proteins was quantified and expressed as fold change (means; n = 5) induced by diabetes. Statistical significance (P) was assessed by Student’s t-test. B: Effect of diabetes on elongase, desaturase, and phosphoenolpyruvate carboxykinase (PepCk) expression. Transcripts encoding fatty acid elongases, fatty acid desaturases, and cyclophilin were quantified by qRT-PCR, whereas phosphoenolpyruvate kinase was quantified by Northern blot analysis. Results are expressed as fold change in expression (transcript/cyclophilin) induced by diabetes (n = 5/group). * P < 0.05 versus control by Student’s t-test.
Glucose intolerance induced by high-fat diets
High-fat diets induce glucose intolerance, insulin resistance, fatty liver, and altered hepatic metabolism (48, 49). To examine the effects of diet-induced diabetes on elongase and desaturase expression, male C57BL/6 mice were fed a diet with 10% of the calories as fat (low-fat-lard diet) or 60% of the calories as fat (high-fat-lard diet). Animals fed the low-fat diet were ~29 g and had blood glucose and insulin levels within the normal range, 121 mg/dl and 0.5 ng/ml (Table 2). Animals fed the high-fat diet were ~44 g with increased blood glucose(152mg/dl) and insulin (3.9 ng/ml). Compared with the low-fat-fed group, high-fat-fed animals were glucose-intolerant (Fig. 9A) and had fatty livers (48). Nuclear levels of SREBP-1 and MLX were suppressed 60% and 50% (Fig. 9B), whereas ChREBP and HNF-4α nuclear levels remained unchanged.
TABLE 2.
Dietary composition and physiological parameters of C57BL/6 mice
| Low Fat versus High Fat |
Lean versus Obese |
|||
|---|---|---|---|---|
| Parameter | Low Fat | High Fat | Chow | Chow |
| Calories as fat (%) | 10 | 60 | 20.3 | 20.3 |
| Calories as carbohydrate (%) | 70 | 20 | 55.4 | 55.4 |
| Calories as protein (%) | 20 | 20 | 24.4 | 24.4 |
| Body weight (g) | 29.0 ± 1.0 | 44.0 ± 1.0 | 23.7 ± 1.5 | 55.1 ± 2.8 |
| Fasting blood glucose (mg/dl) | 121.0 ± 1.0 | 152.0 ± 0.3 | 112.0 ± 11 | 266.0 ± 69.0 |
| Plasma insulin (ng/ml) | 0.5 ± 0.05 | 3.9 ± 0.4 | 0.2 1 0.06 | 15.4 ± 1.04 |
| Animals per group | 8 | 8 | 4 | 4 |
Fig. 9.

Effect of high-fat diets on hepatic elongase and desaturase expression. Male C57BL/6 mice were fed lard diets [10% calories (low fat) or 60% calories (high fat) as lard] for 10 weeks as described in Materials and Methods (48). A: After 9 weeks on the low- and high-fat diets, mice were assessed for glucose tolerance (see Materials and Methods). Blood glucose was measured at the times indicated. Results are expressed as blood glucose (mg/dl) (means ± SD; n = 8 in each group). B: Effect of dietary fat on SREBP (microsomal and nuclear), ChREBP, MLX, and HNF-4α. After 10 weeks on the diet, livers were recovered for nuclear and microsomal protein and RNA extraction as described for Fig. 8. Nuclear and microsomal proteins were measured as described in Materials and Methods. Representative immunoblots from duplicate samples for each treatment are shown. The effect of dietary fat on the abundance of these proteins was quantified and expressed as fold change (means; n = 4 animals/group) induced by the high-fat diet. Statistical significance (P) was assessed by Student’s t-test. C: Effect of dietary fat on elongase and desaturase expression. RNA was extracted and used for qRT-PCR analysis of elongase and desaturase expression. Results are expressed as fold change (transcript/cyclophilin) (means ± SD; n = 8). * P ≤ 0.05. D: Effect of dietary fat on elongase activity. Hepatic microsomal preparations were used for fatty acid elongase assays (see Materials and Methods). Results are expressed as elongase activity (nmol [14C]malonyl-CoA assimilated into fatty acids/mg protein) (means ± SD; n = 8). * P ≤ 0.05 versus 10% calories as fat by Student’s t-test.
Expression levels of Elovl-1 and Elovl-2 were not significantly affected by high dietary fat (Fig. 9C). Elovl-5 and Elovl-6 mRNA abundance, however, was suppressed by 50% and 75% with the high fat intake. The high-fat diet had no effect on Δ5D or Δ6D but significantly suppressed Δ9D expression (≥80%). High-fat diets significantly suppressed fatty acid elongation of 16:0-CoA and 20:4-CoA but not 24:0-CoA (Fig. 9D).
Palmitic (16:0), stearic (18:0), oleic (18:1,n-9), and linoleic (18:2,n-6) acids represent the major fatty acids in both diets. Analysis of hepatic lipid composition indicated that 18:2,n-6 accumulated relative to 20:4,n-6 in livers of high-fat-fed animals (data not shown). 18:2,n-6, an essential fatty acid, is converted to 20:4,n-6. Because neither diet contained 20:4,n-6, the appearance of 20:4,n-6 in the livers required conversion from 18:2,n-6 to 20:4,n-6 by elongation (Elovl-2 and Elovl-5) and desaturation (Δ5D and Δ6D). In the low-fat diet, the ratio of 20:4,n-6 to 18:2,n-6 was 0.75. In the high-fat diet, the ratio was 0.3. Failure to convert 18:2,n-6 to 20:4,n-6 is consistent with a decline in Elovl-5 expression, a key enzyme involved in PUFA synthesis.
Elongase and desaturase expression in livers of lean (Lepob/+) and obese (Lepob/ob) mice
Defective leptin expression in C57BL/6J-Lepob/ob mice leads to hyperphagia, hyperinsulinemia, insulin resistance, and obesity (50). Compared with their lean (Lepob/+) littermates, obese animals were heavier and had increased blood levels of glucose and insulin (Table 2). The livers of obese mice were massively engorged with lipid, predominantly as neutral lipid. Hepatic nuclei derived from obese mice had a 2.6- and 2-fold increase in SREBP-1 and MLX nuclear abundance but no change in ChREBP or HNF-4α compared with those of lean littermates. Expression levels of Elovl-5, Elovl-6, Δ5D, Δ6D, and Δ9D were increased in livers of obese mice compared with their lean littermates. Obesity also resulted in the induction of lipogenic gene expression (ACC, FAS) and PPARα target genes, such as cytochrome P450 4A(Cyp4A) and acyl CoA oxidase (data not shown). Fatty acid elongation of 16:0-CoA was increased 2-fold, whereas elongation of 20:4-CoA and 24:0-CoA was not affected (Fig. 10C).
Fig. 10.

Effect of leptin deficiency on hepatic elongase and desaturase expression. Male lean (C57BL/6J-Lepob/+) and obese (C57BL/6J-Lepob/ob) mice (B6.V-Lep ob/J, No. 000632; Jackson Laboratories) were maintained on a Harlan-Teklad laboratory chow (No. 8640) diet and water ad libitum. Livers from these mice were used for the isolation of nuclear and microsomal protein for immunoblotting (A) and RNA extraction for qRT-PCR (B). A: Effect of obesity on SREBP-1 (microsomal and nuclear) and nuclear ChREBP, MLX, and HNF-4α abundance. Protein levels were measured by immunoblot analysis (see Materials and Methods). Triplicate samples for each phenotype are shown. The effect of leptin deficiency on the abundance of these proteins was quantified and expressed as fold change (means; n = 4) induced by leptin deficiency. Statistical significance (P) was assessed by Student’s t-test. B: Effect of leptin deficiency on elongase and desaturase expression. RNA was extracted and used for qRT-PCR analysis of elongase and desaturase expression. Results are expressed as fold change (transcript/cyclophilin) (means ± SD; n = 4). * P < 0.001 versus lean by Student’s t-test. C: Effect of leptin deficiency on elongase activity. Hepatic microsomal preparations were used for fatty acid elongase assays (see Materials and Methods). Results are expressed as elongase activity (nmol [14C]malonyl-CoA assimilated into fatty acids/mg protein) (means ± SD; n = 4). * P ≤ 0.01 versus lean by Student’s t-test. D: Effect of leptin deficiency on hepatic lipid composition. Total lipids were extracted and saponified; fatty acid levels were quantified by reverse-phase HPLC (see Materials and Methods). Results are expressed as fatty acid mol% (means ± SD; n = 4/group). * P ≤ 0.01 versus lean animals by Student’s t-test.
Fatty acid analysis of livers from lean and obese mice revealed an ~9-fold increase in total esterified fatty acid. Much of this increase is in the form of neutral lipid esterified with 18:1 (n-7 and n-9) (Fig. 10D). Although monounsaturated fatty acid abundance increased, hepatic PUFA content (i.e., 18:2,n-6, 20:4,n-6, and 22:6,n-3) declined. This might appear inconsistent with the observed increase in fatty acid elongase activity and elongase and desaturase expression. Lepob/ob mice, however, are hyperphagic; ingestion of excessive calories as carbohydrate increased plasma insulin (Table 2) and enhanced de novo lipogenesis and monounsaturated fatty acid synthesis. Induction of Elovl-5, Elovl-6, and Δ9D expression by activated PPARα and increased SREBP-1 and MLX nuclear content facilitated monounsaturated fatty acid (18:1,n-7 and 18:1,n-9) synthesis, which was assimilated into neutral lipid. Elongation and desaturation are key steps for converting end products of de novo lipogenesis, such as 16:0, to monounsaturated fatty acids. These studies indicate that fatty acid elongation is induced along with de novo lipogenesis and Δ9-desaturation. Induction of these pathways contributes to the fatty liver phenotype characteristic of Lepob/ob mice.
DISCUSSION
Fatty acid elongation and desaturation are two key metabolic routes for the synthesis of saturated, monounsaturated, and polyunsaturated fatty acids. Of these, fatty acid desaturases have received considerable attention for their regulation by hormones and nutrients and their capacity to generate specific unsaturated fatty acids. The outcome of these studies indicates that desaturases are well-regulated enzymes that play an important role in cellular and whole body lipid composition (28, 51). One of these enzymes, Δ9D (stearoyl-CoA desaturase-1), has emerged as a key enzyme in the control of whole body lipid composition (52).
In contrast to the desaturases, fatty acid elongases have only recently been recognized as proteins regulated at the pretranslational level (11, 44, 53). Fatty acid elongases are regulated by tissue-specific and nutritional factors and during postnatal development (17). Such studies implicated certain transcription factors, such as SREBP-1 and PPARα, as regulators of both elongase and desaturase expression. This report extends those previous observations by evaluating the role of several hormones (insulin, T3, glucocorticoids, and leptin), transcription factors (SREBP-1c, PPARα, LXR, ChREBP, and MLX), and nutrients (glucose and fat) in the control of hepatic elongase and desaturase gene expression, fatty acid elongase activity, and lipid composition. Finding the involvement of these transcription factors in the control of elongase expression prompted studies to evaluate how these enzymes were regulated in metabolic disease. The outcome of these studies has provided new information on how changes in both elongase and desaturase expression in metabolic disease contribute to hepatic lipid composition.
Seven fatty acid elongase subtypes (Elovl-1 to Elovl-7) have been identified in the genomes of the rat, mouse, and human (www.ensembl.org). Of these, four elongase subtypes are expressed in rat, mouse, and human liver (Fig. 1). The hierarchy for hepatic expression of these enzymes is similar in all three species: Elovl-5 > Elovl-1 = Elovl-2 = Elovl-6. Analysis of elongase activity indicates that mouse liver has the highest elongase activity.
Elovl-1
Elovl-1 is a low-abundance elongase in liver of all three species. Based on studies in yeast, Elovl-1 elongates a broad array of saturated and monounsaturated fatty acids. Elovl-1 expression, however, is not regulated by any physiological manipulation used to date in this or our previous study (17). Thus, changes in hepatic lipid composition induced during postnatal development or in association with fasting and refeeding, diabetes, obesity, dietary fat, LXR, or PPARα agonist cannot be attributed to changes in Elovl-1 activity. Hepatic Elovl-1 appears to be expressed constitutively.
Elovl-2
Elovl-2 is also a low-abundance elongase in liver of all three species. In contrast to other elongases, Elovl-2 has a very narrow substrate preference: it elongates C20 and C22 PUFAs (Fig. 6). As such, Elovl-2 participates in the conversion of essential fatty acid precursors to end products of PUFA synthesis (i.e., 20:4,n-6 and 22:6,n-3). Like Elovl-1, Elovl-2 is not regulated by any factors examined in this or our previous report (17). The exception to this is the induction of Elovl-2 mRNA after overexpression of SREBP-1c (Fig. 3). Because insulin, LXR agonist, and glucose fail to induce this transcript, we feel that the induction of Elovl-2 by overexpressed SREBP-1c may have limited physiological significance in vivo.
Elovl-5
Elovl-5 is the most abundant elongase transcript in all three species. It also is expressed in many tissues, induced during postnatal development, and suppressed by feeding rats n-3 PUFA-enriched diets (17). Several hormones (insulin, T3, glucocorticoids, and leptin) and transcription factors (SREBP-1c, LXR, ChREBP, and MLX) have no impact on hepatic Elovl-5 expression. Only PPARα, n-3 PUFA-enriched diets (17), high-fat diets (Fig. 9), and obesity (Fig. 10) affect Elovl-5 expression. The regulation of Elovl-5 is physiologically significant. Feeding rats a high-carbohydrate diet supplemented with olive oil plus WY14643 significantly increased mead acid (20:3,n-9) production (17). Mead acid is an elongation and desaturation product of 18:1,n-9, the predominant fatty acid in olive oil. WY14643 induction of Elovl-5 likely contributes to the formation of 20:3,n-9. Elovl-5 also converts 16:1,n-7, but not 16:0, to an 18 carbon monounsaturated fatty acid (18:1,n-7) (Fig. 6) as well as the elongation of an intermediate (18:3,n-6) in the pathway for n-6 PUFA synthesis (20:4,n-6) (Fig. 6). Suppression of Elovl-5 in high-fat-fed mice correlates with a decreased hepatic 20:4,n-6-to-18:2,n-6 ratio (Fig. 9). Enhanced Elovl-5 expression correlates with the increased content of 18 carbon monounsaturated fatty acids in livers of obese mice (Lepob/ob) (Fig. 10). Many PPARα-regulated transcripts, such as acyl-CoA oxidase and Cyp4A, are induced in livers of Lepob/ob mice (data not shown). Induction of Elovl-5 in livers of obese mice is likely attributable to PPARα activation.
Despite the role that Elovl-5 plays in PUFA synthesis and its increase in livers of obese mice, hepatic lipids in obese animals are not enriched in PUFAs. In fact, obese livers are depleted of PUFA relative to other fatty acids, such as 18:1 (Fig. 10D). Δ5D, Δ6D, and Δ9D are induced in livers of obese mice, but to differing extents (Fig. 10D). Δ5D and Δ6D are induced in obese liver as a result of the increased nuclear abundance of SREBP-1 and activation of PPARα. Δ9D is induced by these same transcription factors, plus increased nuclear ChREBP/MLX (Fig. 10D). Thus, hyperphagia resulting from defective leptin production, coupled with the ingestion of the high-carbohydrate diet, stimulates de novo lipogenesis and monounsaturated fatty acid synthesis. In this instance, Elovl-5 substrates, in particular 16:1,n-7 (Fig. 6), are end products of de novo lipogenesis and Δ9D. Increased expression of Elovl-5, Elovl-6, and Δ9D, coupled with enhanced production of end products of de novo lipogenesis, increases 18:1,n7 and 18:1,n9 production.
Elovl-6
Elovl-6 is expressed at low levels in livers of all three species. Like Elovl-2, Elovl-6 has a narrow substrate preference (i.e., C12–16 saturated and unsaturated fatty acids) (Fig. 6) (10). In contrast to other elongases, Elovl-6 is regulated by multiple factors. Insulin and LXR agonist increase SREBP-1 nuclear abundance, which leads to induced Elovl-6 expression (Figs. 3, 4). Insulin-induced glucose metabolism increases ChREBP nuclear content, and the ChREBP/MLX heterodimer regulates glucose-regulated genes, including L-PK, ACC, FAS, and Δ9D. Elovl-6 is among these glucose-regulated genes (Fig. 5). PPARα activation also induces Elovl-6 (Fig. 2). Elovl-6 is regulated during postnatal development, but unlike Elovl-5, Elovl-6 expression declines at birth and is induced at weaning. Elovl-6 expression during early postnatal development parallels SREBP-1 nuclear abundance (17). The finding that both Elovl-6 and Δ9D are induced along with L-PK and FAS (Fig. 10) indicates that these enzymes play a role in the hepatic response to excess carbohydrate consumption.
Excess carbohydrate is channeled to de novo lipogenesis via enhanced L-PK activity. Insulin-stimulated glucose metabolism induces ChREBP translocation into hepatic nuclei (32, 54, 55). ChREBP and MLX heterodimers bind ChoREs in promoters of responsive genes, such as L-PK, ACC, and FAS. Insulin also increases SREBP-1 nuclear abundance, leading to increased promoter occupancy of SREBP-1 on SRE in target genes (e.g., ACC, FAS, and Δ9D). Consistent with this scenario is the increased nuclear abundance of SREBP-1 and MLX in livers derived from obese animals (Fig. 10). The end product of de novo lipogenesis, 16:0, is elongated (Elovl-6) and desaturated (Δ9D) to yield 18:1, the fatty acid that accumulates in livers of obese mice. In this metabolic scheme, there appears to be a tight coordination between glycolysis, de novo lipogenesis, fatty acid elongation (Elovl-6), and desaturation (Δ9D) that involves three transcription factors: ChREBP, MLX, and SREBP-1c.
Although these studies provide a link between ChREBP, MLX, SREBP-1, and PPARα in the control of elongase expression, the mechanism(s) for this control remains undefined. Whether this control involves direct interaction of these transcription factors with regulatory elements in the promoters of the elongases or indirect control through other mechanisms will require detailed analysis of the promoters for Elovl-5 and Elovl-6. Such studies are beyond the scope of this report.
In conclusion, we have established that specific hepatic fatty acid elongases, Elovl-5 and Elovl-6, are regulated in liver by nutrients (glucose and fat), hormones (insulin), and nuclear receptor agonists (i.e., LXR and PPARα agonist). ChREBP, MLX, SREBP-1, PPARα, and LXR control both elongase and desaturase expression. Only Δ9D is independently regulated by LXR. Metabolic diseases, such as diabetes and obesity, induce changes in hepatic lipid composition by controlling the function of key transcription factors that affect elongase and desaturase expression. These studies support the notion that the regulation of both fatty acid elongase and desaturase expression may play an important role in managing hepatic lipid composition in response to changes in dietary and hormonal status.
Acknowledgments
The authors thank Howard C. Towle (University of Minnesota) for generously providing the recombinant adenovirus expressing SREBP-1c nuclear form and the dominant negative MLX. The authors also thank Kate Claycomb and Dale Romsos (Michigan State University) for the generous supply of livers from lean and obese mice. This project was supported by the National Institutes of Health (Grant DK-43220), the National Research Initiative of the U. S. Department of Agriculture Cooperative State Research, Education, and Extension Service (2003-35200-13400), and the Michigan Agriculture Experiment Station.
Abbreviations
- ACC
acetyl-coenzyme A carboxylase
- ChoRE
carbohydrate-regulatory element
- ChREBP
carbohydrate-regulatory element binding protein
- Δ5D
Δ5 desaturase
- Elovl-1
fatty acid elongase-1
- HNF-4
hepatic nuclear factor-4
- L-PK
L-type pyruvate kinase
- Luc
luciferase
- LXR
liver X receptor
- MLX
MAX-like factor X
- PPARα
peroxisome proliferator-activated receptor α
- qRT
quantitative real-time
- SREBP-1
sterol-regulatory element binding protein-1
- T1317
T0901317
- T3
triiodothyronine
References
- 1.Jump DB, Clarke SD. Regulation of gene expression by dietary fat. Annu Rev Nutr. 1999;19:63–90. doi: 10.1146/annurev.nutr.19.1.63. [DOI] [PubMed] [Google Scholar]
- 2.Jump DB. Fatty acid regulation of gene transcription. Crit Rev Clin Lab Sci. 2004;41:41–78. doi: 10.1080/10408360490278341. [DOI] [PubMed] [Google Scholar]
- 3.Hillgartner FB, Salati LM, Goodridge AG. Physiological and molecular mechanisms involved in nutritional regulation of fatty acid synthesis. Physiol Rev. 1995;75:47–76. doi: 10.1152/physrev.1995.75.1.47. [DOI] [PubMed] [Google Scholar]
- 4.Sprecher H. Metabolism of highly unsaturated n-3 and n-6 fatty acids. Biochim Biophys Acta. 2000;1486:219–231. doi: 10.1016/s1388-1981(00)00077-9. [DOI] [PubMed] [Google Scholar]
- 5.Pawar A, Xu J, Jerks E, Mangelsdorf DJ, Jump DB. Fatty acid regulation of liver X receptors (LXR) and peroxisome proliferator-activated receptor α (PPARα) in HEK293 cells. J Biol Chem. 2002;277:39243–39250. doi: 10.1074/jbc.M206170200. [DOI] [PubMed] [Google Scholar]
- 6.Pawar A, Jump DB. Unsaturated fatty acid regulation of PPARα in rat primary hepatocytes. J Biol Chem. 2003;278:35931–35939. doi: 10.1074/jbc.M306238200. [DOI] [PubMed] [Google Scholar]
- 7.Leonard AE, Pereira SL, Sprecher H, Huang YS. Elongation of long-chain fatty acids. Prog Lipid Res. 2004;43:36–54. doi: 10.1016/s0163-7827(03)00040-7. [DOI] [PubMed] [Google Scholar]
- 8.Moon YA, Horton JD. Identification of two mammalian reductases involved in the two-carbon fatty acyl elongation cascade. J Biol Chem. 2003;278:7335–7343. doi: 10.1074/jbc.M211684200. [DOI] [PubMed] [Google Scholar]
- 9.Prasad MR, Nagi MN, Ghesquier D, Cook L, Cinti DL. Evidence for multiple condensing enzymes in rat hepatic microsomes catalyzing the condensation of saturated, monounsaturated and polyunsaturated acyl coenzyme A. J Biol Chem. 1986;261:8213–8217. [PubMed] [Google Scholar]
- 10.Moon YA, Shah NA, Mohapatra S, Warrington JA, Horton JD. Identification of a mammalian long chain fatty acyl elongase regulated by sterol regulatory element-binding proteins. J Biol Chem. 2001;276:45358–45366. doi: 10.1074/jbc.M108413200. [DOI] [PubMed] [Google Scholar]
- 11.Horton JD, Shah NA, Warrington JA, Anderson NN, Park SW, Brown MS, Goldstein JL. Combined analysis of oligonucleotide microarray data from transgenic and knockout mice identifies direct SREBP target genes. Proc Natl Acad Sci USA. 2003;100:12027–12032. doi: 10.1073/pnas.1534923100. [DOI] [PMC free article] [PubMed] [Google Scholar]
- 12.Matsuzaka T, Shimano H, Yahagi N, Yoshikawa T, Amemiya-Kudo M, Hasty AH, Okazaki H, Tamura Y, Iizuka Y, Ohashi K, et al. Cloning and characterization of a mammalian fatty acyl-CoA elongase as a lipogenic enzyme regulated by SREBPs. J Lipid Res. 2002;43:911–920. [PubMed] [Google Scholar]
- 13.Inagaki K, Aki T, Fukuda Y, Kawamoto S, Shigeta S, Ono K, Suzuki O. Identification and expression of a rat fatty acid elongase involved in the biosynthesis of C18 fatty acids. Biosci Biotechnol Biochem. 2002;66:613–621. doi: 10.1271/bbb.66.613. [DOI] [PubMed] [Google Scholar]
- 14.Westerberg R, Tvrdik P, Unden AB, Mansson JE, Norlen L, Jakobsson A, Holleran WH, Elias PM, Asadi A, Flodby P, et al. Role for ELOVL3 and fatty acid chain length in development of hair and skin function. J Biol Chem. 2004;279:5621–5629. doi: 10.1074/jbc.M310529200. [DOI] [PubMed] [Google Scholar]
- 15.Lagali PS, Liu J, Ambasudhan R, Kakuk LE, Bernstein SL, Seigel GM, Wong PW, Ayyagari R. Evolutionarily conserved ELOVL4 gene expression in the vertebrate retina. Invest Ophthalmol Vis Sci. 2003;44:2841–2850. doi: 10.1167/iovs.02-0991. [DOI] [PubMed] [Google Scholar]
- 16.Tvrdik P, Asadi A, Kozak LP, Nedergaard J, Cannon B, Jacobsson A. Cig30, a mouse member of a novel membrane protein gene family, is involved in the recruitment of brown adipose tissue. J Biol Chem. 1997;272:31738–31746. doi: 10.1074/jbc.272.50.31738. [DOI] [PubMed] [Google Scholar]
- 17.Wang Y, Botolin D, Christian B, Busik C, Xu J, Jump DB. Tissue-specific, nutritional and developmental regulation of rat fatty acid elongases. J Lipid Res. 2005;46:706–715. doi: 10.1194/jlr.M400335-JLR200. [DOI] [PMC free article] [PubMed] [Google Scholar]
- 18.Jump DB, Bell A, Lepar G, Hu D. Insulin rapidly induces rat liver S14 gene transcription. Mol Endocrinol. 1990;4:1655–1660. doi: 10.1210/mend-4-11-1655. [DOI] [PubMed] [Google Scholar]
- 19.Lee SS, Pineau T, Drago J, Lee EJ, Owens JW, Kroetz DL, Fernandez-Salguero PM, Westphal H, Gonzalez FJ. Targeted disruption of the alpha isoform of the peroxisome proliferator-activated receptor gene in mice results in abolishment of the pleiotropic effects of peroxisome proliferators. Mol Cell Biol. 1995;15:3012–3022. doi: 10.1128/mcb.15.6.3012. [DOI] [PMC free article] [PubMed] [Google Scholar]
- 20.Akiyama TE, Nicol CJ, Fievet C, Staels B, Ward JM, Auwerx J, Lee SS, Gonzalez FJ, Peters JM. Peroxisome proliferator-activated receptor-α regulates lipid homeostasis, but is not associated with obesity: studies with congenic mouse lines. J Biol Chem. 2001;276:39088–39093. doi: 10.1074/jbc.M107073200. [DOI] [PubMed] [Google Scholar]
- 21.Botolin D, Wang Y, Christian B, Jump DB. Docosahexaneoic acid [22:6, n-3] stimulates rat hepatic sterol regulatory element binding protein-1c (SREBP-1c) degradation by an Erk- and 26S proteasome-dependent pathway. J Lipid Res. 2006;47:181–192. doi: 10.1194/jlr.M500365-JLR200. [DOI] [PMC free article] [PubMed] [Google Scholar]
- 22.Xu J, Christian B, Jump DB. Regulation of rat hepatic L-pyruvate kinase promoter composition and activity by glucose, n-3 PUFA and peroxisome proliferator activated receptor-α agonist. J Biol Chem. 2006;281:18351–18362. doi: 10.1074/jbc.M601277200. [DOI] [PMC free article] [PubMed] [Google Scholar]
- 23.Botolin D, Jump DB. Selective proteolytic processing of rat hepatic sterol regulatory element binding protein-1 (SREBP-1) and SREBP-2 during postnatal development. J Biol Chem. 2003;278:6959–6962. doi: 10.1074/jbc.M212846200. [DOI] [PubMed] [Google Scholar]
- 24.Ma L, Tsatsos NG, Towle HC. Direct role of ChREBP.Mlx in regulating hepatic glucose-responsive genes. J Biol Chem. 2005;280:12019–12027. doi: 10.1074/jbc.M413063200. [DOI] [PubMed] [Google Scholar]
- 25.Stoeckman AK, Towle HC. The role of SREBP-1c in nutritional regulation of lipogenic enzyme gene expression. J Biol Chem. 2002;277:27029–27035. doi: 10.1074/jbc.M202638200. [DOI] [PubMed] [Google Scholar]
- 26.Matsuzaka T, Shimano H, Yahagi N, Amemiya-Kudo M, Yoshikawa T, Hasty AH, Tamura Y, Osuga J, Okazaki H, Iizuka Y, et al. Dual regulation of mouse Δ5- and Δ6-desaturase gene expression by SREBP-1 and PPARalpha. J Lipid Res. 2002;43:107–114. [PubMed] [Google Scholar]
- 27.Miyazaki M, Dobrzyn A, Man WC, Chu K, Sampath H, Kim HJ, Ntambi JM. Stearoyl-CoA desaturase 1 gene expression is necessary for fructose-mediated induction of lipogenic gene expression by sterol regulatory element-binding protein-1c-dependent and -independent mechanisms. J Biol Chem. 2004;279:25164–25171. doi: 10.1074/jbc.M402781200. [DOI] [PubMed] [Google Scholar]
- 28.Ntambi JM, Miyazaki M. Regulation of stearoyl-CoA desaturases and role in metabolism. Prog Lipid Res. 2004;43:91–104. doi: 10.1016/s0163-7827(03)00039-0. [DOI] [PubMed] [Google Scholar]
- 29.Schultz JR, Tu H, Luk A, Repa JJ, Medina JC, Li L, Schwendner S, Wang S, Thoolen M, Mangelsdorf DJ, et al. Role of LXRs in control of lipogenesis. Genes Dev. 2000;14:2831–2838. doi: 10.1101/gad.850400. [DOI] [PMC free article] [PubMed] [Google Scholar]
- 30.Joseph SB, Laffitte BA, Patel PH, Watson MA, Matsukuma KE, Walczak R, Collins JL, Osborne TF, Tontonoz P. Direct and indirect mechanisms for regulation of fatty acid synthase gene expression by liver X receptors. J Biol Chem. 2002;277:11019–11025. doi: 10.1074/jbc.M111041200. [DOI] [PubMed] [Google Scholar]
- 31.Tobin KA, Ulven SM, Schuster GU, Steineger HH, Andresen SM, Gustafsson JA, Nebb HI. Liver X receptors as insulin-mediating factors in fatty acid and cholesterol biosynthesis. J Biol Chem. 2002;277:10691–10697. doi: 10.1074/jbc.M109771200. [DOI] [PubMed] [Google Scholar]
- 32.Towle HC. Glucose as a regulator of eukaryotic gene transcription. Trends Endocrinol Metab. 2005;16:489–494. doi: 10.1016/j.tem.2005.10.003. [DOI] [PubMed] [Google Scholar]
- 33.Dentin R, Girard J, Postic C. Carbohydrate responsive element binding protein (ChREBP) and sterol regulatory element binding protein-1c (SREBP-1c): two key regulators of glucose metabolism and lipid synthesis in liver. Biochimie. 2005;87:81–86. doi: 10.1016/j.biochi.2004.11.008. [DOI] [PubMed] [Google Scholar]
- 34.Kawaguchi T, Takenoshita M, Kabashima T, Uyeda K. Glucose and cAMP regulate the L-type pyruvate kinase gene by phosphorylation/dephosphorylation of the carbohydrate response element binding protein. Proc Natl Acad Sci USA. 2001;98:13710–13715. doi: 10.1073/pnas.231370798. [DOI] [PMC free article] [PubMed] [Google Scholar]
- 35.Liimatta M, Towle HC, Clarke S, Jump DB. Dietary polyunsaturated fatty acids interfere with the insulin/glucose activation of L-type pyruvate kinase gene transcription. Mol Endocrinol. 1994;8:1147–1153. doi: 10.1210/mend.8.9.7838147. [DOI] [PubMed] [Google Scholar]
- 36.Pan DA, Mater MK, Thelen AP, Peters JM, Gonzalez FJ, Jump DB. Evidence against the peroxisome proliferator-activated receptor α (PPARα) as the mediator for poly-unsaturated fatty acid suppression of hepatic L-pyruvate kinase gene transcription. J Lipid Res. 2000;41:742–751. [PubMed] [Google Scholar]
- 37.Jacoby DB, Zilz ND, Towle HC. Sequences within the 5′-flanking region of the S14 gene confer responsiveness to glucose in primary hepatocytes. J Biol Chem. 1989;264:17623–17626. [PubMed] [Google Scholar]
- 38.Koo SH, Dutcher AK, Towle HC. Glucose and insulin function through two distinct transcription factors to stimulate expression of lipogenic enzyme genes in liver. J Biol Chem. 2001;276:9437–9445. doi: 10.1074/jbc.M010029200. [DOI] [PubMed] [Google Scholar]
- 39.Stoeckman AK, Ma L, Towle HC. Mlx is the functional heteromeric partner of the carbohydrate response element-binding protein in glucose regulation of lipogenic enzyme genes. J Biol Chem. 2004;279:15662–15669. doi: 10.1074/jbc.M311301200. [DOI] [PubMed] [Google Scholar]
- 40.Dentin R, Benhamed F, Pegorier JP, Foufelle F, Viollet B, Vaulont S, Girard J, Postic C. Polyunsaturated fatty acids suppress glycolytic and lipogenic genes through the inhibition of ChREBP nuclear protein translocation. J Clin Invest. 2005;115:2843–2854. doi: 10.1172/JCI25256. [DOI] [PMC free article] [PubMed] [Google Scholar]
- 41.Doiron B, Cuif MH, Kahn A, Diaz-Guerra MJ. Respective roles of glucose, fructose, and insulin in the regulation of the liver-specific pyruvate kinase gene promoter. J Biol Chem. 1994;269:10213–10216. [PubMed] [Google Scholar]
- 42.Yamashita H, Takenoshita M, Sakurai M, Bruick RK, Henzel WJ, Shillinglaw W, Arnot D, Uyeda K. A glucose-responsive transcription factor that regulates carbohydrate metabolism in the liver. Proc Natl Acad Sci USA. 2001;98:9116–9121. doi: 10.1073/pnas.161284298. [DOI] [PMC free article] [PubMed] [Google Scholar]
- 43.Kawaguchi T, Osatomi K, Yamashita H, Kabashima T, Uyeda K. Mechanism for fatty acid “sparing” effect on glucose-induced transcription: regulation of carbohydrate-responsive element-binding protein by AMP-activated protein kinase. J Biol Chem. 2002;277:3829–3835. doi: 10.1074/jbc.M107895200. [DOI] [PubMed] [Google Scholar]
- 44.Jakobsson A, Westerberg R, Jacobsson A. Fatty acid elongases in mammals: their regulation and role in metabolism. Prog Lipid Res. 2006;45:237–249. doi: 10.1016/j.plipres.2006.01.004. [DOI] [PubMed] [Google Scholar]
- 45.Chinetti-Gbaguidi G, Fruchart JC, Staels B. Role of the PPAR family of nuclear receptors in the regulation of metabolic and cardiovascular homeostasis: new approaches to therapy. Curr Opin Pharmacol. 2005;5:177–183. doi: 10.1016/j.coph.2004.11.004. [DOI] [PubMed] [Google Scholar]
- 46.Kakuma T, Lee Y, Higa M, Wang Z, Pan W, Shimomura I, Unger RH. Leptin, troglitazone, and the expression of sterol regulatory element binding proteins in liver and pancreatic islets. Proc Natl Acad Sci USA. 2000;97:8536–8541. doi: 10.1073/pnas.97.15.8536. [DOI] [PMC free article] [PubMed] [Google Scholar]
- 47.Kalaany NY, Gauthier KC, Zavacki AM, Mammen PP, Kitazume T, Peterson JA, Horton JD, Garry DJ, Bianco AC, Mangelsdorf DJ. LXRs regulate the balance between fat storage and oxidation. Cell Metab. 2005;1:231–244. doi: 10.1016/j.cmet.2005.03.001. [DOI] [PubMed] [Google Scholar]
- 48.Jayaprakasam B, Vareed SK, Olson LK, Nair MG. Insulin secretion by bioactive anthocyanins and anthocyanidins present in fruits. J Agric Food Chem. 2005;53:28–31. doi: 10.1021/jf049018+. [DOI] [PubMed] [Google Scholar]
- 49.Van Heek M, Compton DS, France CF, Tedesco RP, Fawzi AB, Graziano MP, Sybertz EJ, Strader CD, Davis HR., Jr Diet-induced obese mice develop peripheral, but not central, resistance to leptin. J Clin Invest. 1997;99:385–390. doi: 10.1172/JCI119171. [DOI] [PMC free article] [PubMed] [Google Scholar]
- 50.Halaas JL, Gajiwala KS, Maffei M, Cohen SL, Chait BT, Rabinowitz D, Lallone RL, Burley SK, Friedman JM. Weight-reducing effects of the plasma protein encoded by the obese gene. Science. 1995;269:543–546. doi: 10.1126/science.7624777. [DOI] [PubMed] [Google Scholar]
- 51.Nakamura MT, Nara TY. Structure, function and dietary regulation of Δ6, Δ5 and Δ9 desaturases. Annu Rev Nutr. 2004;24:345–376. doi: 10.1146/annurev.nutr.24.121803.063211. [DOI] [PubMed] [Google Scholar]
- 52.Cohen P, Miyazaki M, Socci ND, Hagge-Greenberg A, Liedtke W, Soukas AA, Sharma R, Hudgins LC, Ntambi JM, Friedman JM. Role for stearoyl-CoA desaturase-1 in leptin-mediated weight loss. Science. 2002;297:240–243. doi: 10.1126/science.1071527. [DOI] [PubMed] [Google Scholar]
- 53.Zhang W, Patil S, Chauhan B, Guo S, Powell DR, Le J, Klotsas A, Matika R, Xiao X, Franks R, et al. FoxO1 regulates multiple metabolic pathways in the liver: effects on gluconeogenic, glycolytic, and lipogenic gene expression. J Biol Chem. 2006;281:10105–10117. doi: 10.1074/jbc.M600272200. [DOI] [PubMed] [Google Scholar]
- 54.Uyeda K, Yamashita H, Kawaguchi T. Carbohydrate responsive element-binding protein (ChREBP): a key regulator of glucose metabolism and fat storage. Biochem Pharmacol. 2002;63:2075–2080. doi: 10.1016/s0006-2952(02)01012-2. [DOI] [PubMed] [Google Scholar]
- 55.Kabashima T, Kawaguchi T, Wadzinski BE, Uyeda K. Xylulose 5-phosphate mediates glucose-induced lipogenesis by xylulose 5-phosphate-activated protein phosphatase in rat liver. Proc Natl Acad Sci USA. 2003;100:5107–5112. doi: 10.1073/pnas.0730817100. [DOI] [PMC free article] [PubMed] [Google Scholar]