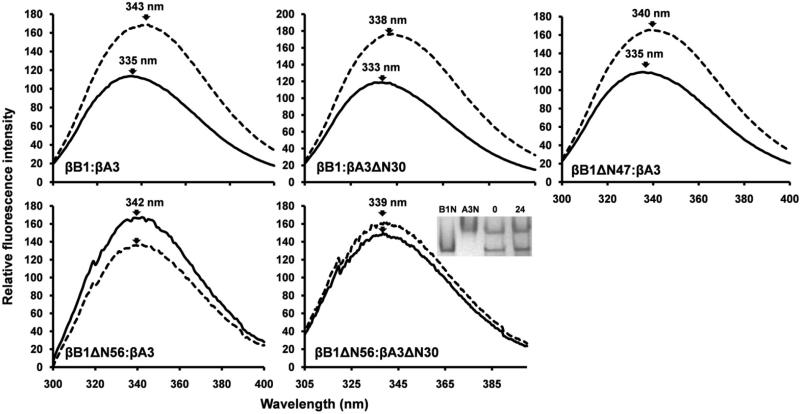
Figure 8. Tryptophan fluorescence emission spectra of β-crystallins complexes.
Spectra of equimolar mixtures following 24 h incubation are indicated by solid lines and the corresponding summated spectra of the individual (non-mixed) β-crystallin pairs by dotted lines. The insert shows native gel electrophoresis of βB1ΔN56 and βA3ΔN30 incubated for 0 and 24h, B1N and A3N refer to βB1ΔN56 and βA3ΔN30.

