Abstract
Development of optimal cryopreservation protocols requires delivery and removal of cryoprotective agents (CPAs) in such a way that negative osmotic and cytotoxic effects on cells are minimized. This is especially true for vitrification, where high CPA concentrations are employed. In this study, we report on the determination of cell membrane permeability parameters for water (Lp) and solute (Ps), and on the design and experimental verification of CPA addition and removal protocols at vitrification-relevant concentrations for a murine insulinoma cell line, βTC-tet cells. Using membrane permeability values and osmotic tolerance limits, mathematical modeling and computer simulations were used to design CPA addition and removal protocols at high concentrations. The cytotoxic effects of CPAs were also evaluated. Cells were able to tolerate the addition and removal of 2.5 M dimethyl sulfoxide (DMSO) and 2.5 M 1,2 propanediol (PD) in single steps, but required multi-step addition and removal with 3.0 M DMSO, 3.0 M PD, and a vitrification-relevant concentration of 3.0 M DMSO+3.0M PD. Cytotoxicity studies revealed that βTC-tet cells were able to tolerate the presence of single component 6.0 M DMSO and 6.0 M PD and to a lesser extent 3.0 M DMSO+3.0 M PD. These results determine the time and concentration domain of CPA exposure that cells can tolerate and are essential for designing cryopreservation protocols for free cells as well as cells in engineered tissues.
Keywords: Cryopreservation, Vitrification, Membrane permeability, Mouse insulinomas, Cryoprotectant addition-removal, Cryoprotectant cytotoxicity
The need for long-term storage is a critical issue for the preservation of cells, natural and engineered tissues and possibly organs. Cryopreservation may offer a clinically relevant solution by preservation at cryogenic temperatures allowing for off-the-shelf availability, sterility testing, and quality control monitoring.
Development of effective protocols for the cryopreservation of tissue engineered substitutes requires knowledge of fundamental biophysical characteristics of the cellular component. Permeating cryoprotective agents (CPAs) help protect cells from injury by lowering lethal concentrations of intracellular electrolytes and decreasing the amount of extracellular ice formed [10]. However, CPAs may cause cell damage due to rapid volume excursions upon exposure of cells to CPA solutions, as well as by chemical cytotoxicity, especially at high concentrations, as used in vitrification protocols. For a certain CPA concentration step change, cellular volume excursions are determined by the water (Lp, cm/s•atm) and solute (Ps, cm/s) permeabilities. When a cell is exposed to a hypertonic solution of a permeating solute, there is an initial abrupt shrinkage caused by water efflux determined by Lp, followed by a slower return to normal volume as the solute permeates at a rate determined by Ps, which is generally referred to as shrink/swell behavior [17]. To prevent large osmotically induced changes in cell volume and high water fluxes through the cell membrane which can cause damage to cells [20], CPAs are generally loaded and removed in a stepwise manner. Chemical toxicity can also be reduced by lowering the temperature or reducing the CPA loading and unloading times. Proper design of CPA loading and unloading procedures is thus essential to obtain the benefits of CPA function in cryopreservation while minimizing negative effects on cells.
Our laboratory is interested in tissue engineering a pancreatic substitute for treatment of insulin-dependent diabetes. A promising construct for laboratory and preclinical studies consists of glucose-responsive, insulin-secreting βTC-tet mouse insulinomas [11] encapsulated in a calcium alginate/poly-L-lysine/alginate (APA) matrix [21,26]. The ability to easily amplify these cells in culture as well as control their proliferation by tetracycline makes βTC-tet cells an attractive cell source for a pancreatic substitute. We have previously shown that a baseline vitrification protocol better preserves an encapsulated cell system relative to conventional freezing, in terms of both cell viability and function, as well as biomaterial structure [19,25]. However, to optimize cryopreservation protocols and minimize cell damage, a thorough characterization is required of the osmotic and cytotoxic effects of cryoprotectants used in the cryopreservation process.
In this study, we report on the determination of cell membrane permeability parameters and on the design and experimental implementation of CPA addition and removal protocols at vitrification-relevant concentrations that avoid the occurrence of damaging osmotic excursions. Besides osmotic considerations, use of CPAs at high concentrations may impose cytotoxic effects, and this is also addressed with the same cell line. With the capability to deliver high concentrations of CPAs, the proposed addition and removal protocols can be used to vitrify systems incorporating βTC-tet mouse insulinomas.
Materials and methods
Cell and cell culture
βTC-tet cells were obtained from the laboratory of Dr. Shimon Efrat, Albert Einstein College of Medicine, Bronx, NY [11]. Monolayer cultures were initiated from frozen stocks and cultured in T-flasks in complete growth medium consisting of Dulbecco’s Modified Eagle’s Medium (DMEM) (Fisher Scientific, Fairlawn, NJ) supplemented with 1% glutamine (Sigma Chemical Co, St. Louis, MO), 10% fetal bovine serum (KSE Scientific, Durham, NC) and 1% penicillin/streptomycin (Fisher Scientific). Cultures were incubated in a 37°C, 5% CO2, humidified incubator. Cells were split at a ratio of 1:5 when confluent and used between passage numbers of 33 and 40.
Measuring cell volume changes and membrane permeability
Cell volumes were measured with a Beckman Coulter™ Multisizer™ 3 Coulter Counter® (Beckman Coulter, Fullerton, CA, USA) using a 100 μm aperture and calibrated with 10μm latex beads (Beckman Coulter, Inc). To measure cell volume responses to cryoprotectants, approximately 3×10⁶ βTC-tet cells in 150–300 μL PBS were abruptly added to 90 mL of well-mixed 10% v/v solutions (1.4 M) of dimethyl sulfoxide (DMSO) (Sigma, St. Louis, MO) and 1,2 propanediol (PD) (Sigma). Collected average pulse height data were converted to cell volumes by the Coulter Counter® software using its built-in digital pulse processor. Cell volumes were normalized to the isotonic cell volume and plotted as a function of time. Measurements were carried out at 4, 22 and 37°C. CPA and water fluxes through the cell membrane were described mathematically by equations (1) and (2) presented in the Mathematical Modeling and Calculations section. Equation solutions were fitted to experimental data to obtain the CPA and water membrane permeability parameters.
Determination of osmotically- inactive volume (Vb) for βTC-tet cells
βTC-tet cells initially in isotonic (~0.272 Osm) saline were added to microcentrifuge tubes containing saline solutions ranging from 0.201 to 1.00 Osm at 22°C. The osmolarity of the solutions was measured with a freezing point osmometer (Advanced Micro- Osmometer, Advanced Instruments, Inc, Norwood, MA). Following equilibration, cell volumes were measured with the Beckman Coulter™ Multisizer™ 3 Coulter Counter®. Cell volumes were normalized to the isotonic cell volume and plotted against the reciprocal of osmolality. The osmotically inactive volume (Vb) was calculated by fitting a straight line to the data and extrapolating it to infinite concentration [8,29].
Cell osmotic tolerance
Osmotic tolerance limits of βTC-tet cells were determined by assessing cell viability following their equilibration with anisosmotic NaCl solutions ranging from 0.137–5.341 Osm (using an osmometer, as described above) at 2–4°C (using an ice bath) and 22°C (room temperature). Equilibration times were determined based on measured water permeability (Lp) values and ranged from several seconds to ten minutes, depending on the osmolality of the solutions. A fixed volume of cell suspension was added to each of several microcentrifuge tubes containing the test solutions. After the necessary equilibration period, the cells were removed from the test solution by centrifugation at 100 × g for 5 minutes, returned to isotonic saline, and assessed for cell viability. Experimental results were normalized to iso-osmotic saline controls treated in an identical fashion. Additionally, tests showed that centrifugation and resuspension in isotonic saline solution did not affect cell viability (data not shown).
Analytical techniques
Cell viability was measured by trypan blue (Sigma, St. Louis, MO) and alamarBlue® (BioSource International, Inc., Camarillo, CA). The trypan blue dye exclusion evaluates cell membrane integrity, as the dye is unable to cross intact plasma membranes labeling only dead cells. Cell suspensions were assayed with an automated Beckman Coulter® Vi-CELL™ (Beckman Coulter, Fullerton, CA, USA) cell viability analyzer. AlamarBlue® evaluates the mitochondrial metabolic activity of the cells. For this assay, approximately 2.5×10⁶ cells, 100 μL alamarBlue® and 1 mL DMEM, or only 100 μL alamarBlue® and 1 mL DMEM for controls, were placed in each well of a 24- well plate. After proper mixing, the 24- well plate was placed into a 37°C/5% CO2 incubator for 2 hours, following which 100 μL of medium from each well were transferred into a 96-well microtiter plate. The plate was read with a Spectra Max Gemini Plate Reader (Molecular Devices, Sunnyvale, CA) using an excitation wavelength of 544 nm and an emission wavelength of 590 nm.
Cryoprotectant addition-removal: Simulations and experiments
Membrane permeability values were used in equations (1) and (2) in the Mathematical modeling and calculations section to compute normalized cell volumes and intracellular CPA concentrations for βTC-tet cells exposed to various concentrations of DMSO and PD by themselves or in combination in solution. The CPAs were added and removed in a single step or in a stepwise fashion. During stepwise CPA removal, the solutions contained 0.3 M mannitol as an osmotic buffer, except for the last removal step in which isotonic culture medium was used.
Modeling results were used to design experiments involving addition and removal of cryoprotectants from cells. βTC-tet cells were plated in 12-well tissue culture plates (Beckton Dickinson Labware, Franklin City, NJ) until 80% confluent. As per the computer simulations of CPA addition (4°C) and removal (22°C), cells were exposed to solutions of 2.5 M and 3.0 M DMSO and PD, as well as a cocktail of 3.0 M DMSO + 3.0 M PD in a stepwise manner (during removal, the solutions contained 0.3 M mannitol to serve as an osmotic buffer; the last removal step was isotonic culture medium). In parallel, cells were exposed to PBS in the same stepwise addition-removal manner as the corresponding experimental group. At the end of the process, cell viability was evaluated with alamarBlue®.
Effect of cryoprotectant exposure on cell viability
βTC-tet cells were plated in a 48-well plate in 500 μL of culture medium overnight. Before being exposed to cryoprotectant solutions, the cells were cooled by placing the plate on ice. Solutions of 2–6 M DMSO and 2–6 M PD in PBS, as well as a cocktail of 3 M DMSO and 3 M PD, were tested for their cytotoxic effects on βTC-tet cells by implementing the following procedure: CPAs were added in a stepwise manner at 4°C; cells were exposed to the final CPA concentration for 15 minutes at 4°C; and the CPAs were then removed in a stepwise manner at 22°C (removal solutions contained 0.3 M mannitol; the last removal step was isotonic culture medium). In a positive control, cells were exposed to PBS in the same stepwise addition-removal manner as the corresponding experimental group. Following CPA removal, cell viability was measured using alamarBlue®.
Mathematical modeling and calculations
Membrane permeability parameters
The two-parameter model describing water and solute flux via the cell membrane is [16]:
| (1) |
| (2) |
where Vw (μm3) is the volume of water inside the cell, Lp is the water permeability (cm/sec•atm), A is the surface area of the cell (μm2), R is the universal gas constant ((μm3•atm)/(mol•K)), T is the absolute temperature (K), Me and Mi are the external and internal osmolality (osmolal), respectively, Ns is the number of moles of permeating solute inside the cell, Ps is the solute permeability (cm/s), and and are the external and internal osmolalites of the permeating CPA (osmolal), respectively. Model solutions were fit to experimental data to obtain values of the water (Lp) and solute (Ps) permeability of βTC-tet cells using a least-squares fit (Nelder-Mead Simplex direct routine) with the aid of Matlab (MathWorks, Natick, MA). Numerical integration was carried out using fourth-order Runge-Kutta. Transport across the cell membrane of the dual solute system of 3 M DMSO and 3 M PD was modeled as a single component system of the slower permeant, DMSO. An osmotic virial equation model was used to account for the non-ideality of the 6 M DMSO solution osmolality as described by Elliott et al. [12] using the quadratic form of the equation,
| (3) |
where ci is the molal concentration of solute i (moles of solute per kilogram of solvent), Bi is the second osmotic virial coefficient, taken as 0.0843 (moles of solute per kilogram of solvent)−1 for DMSO as per Elliott et al [12].
The inactive cell volume, Vb, was determined from the Boyle van’t Hoff relationship [17],
| (4) |
where πe is the extracellular osmolality of the solution (osmolal), Vb is the osmotically inactive cell volume (μm3) and Vo and are the isotonic cell volume (μm3) and isotonic extracellular osmolality (osmolal), respectively. βTC-tet cells were exposed to various anisosmotic NaCl solutions, allowed to equilibrate, and then measured for their volume using a Coulter Counter®. Extrapolation of the relative cell volume as a function of inverse osmolality to infinite osmolality (zero on the abscissa) was used to estimate the osmotically inactive cell volume.
Activation Energy (Ea)
The temperature dependence of the membrane permeability parameters, Lp and Ps, can be expressed with an associated activation energy (Ea). Assuming an Arrhenius relationship (Equation 4), the activation energy was determined by plotting ln (Lp) or ln (Ps) against inverse absolute temperature and calculating the slope of the resulting straight line.
| (5) |
In the above equation, A is the frequency factor based on the experimental data, R is the ideal gas constant, T is the absolute temperature and Ea is the activation energy.
Statistical Analysis
Statistical analyses were done using Student’s t-test (for single vs. multi-step CPA addition and removal) and ANOVA (for cytotoxicity study). Comparisons were considered significant at p<0.05.
Results
βTC-tet cell membrane permeability characteristics
βTC-tet cells followed the Boyle van’t Hoff relationship over the osmotic range tested, 0.201–1.00 Osm, as shown in Figure 1 (R2 = 0.9851). The osmotically inactive volume, Vb, was found to be 0.184 by extrapolating the relative cell volume as a function of inverse osmolality to infinite osmolality.
Figure 1.
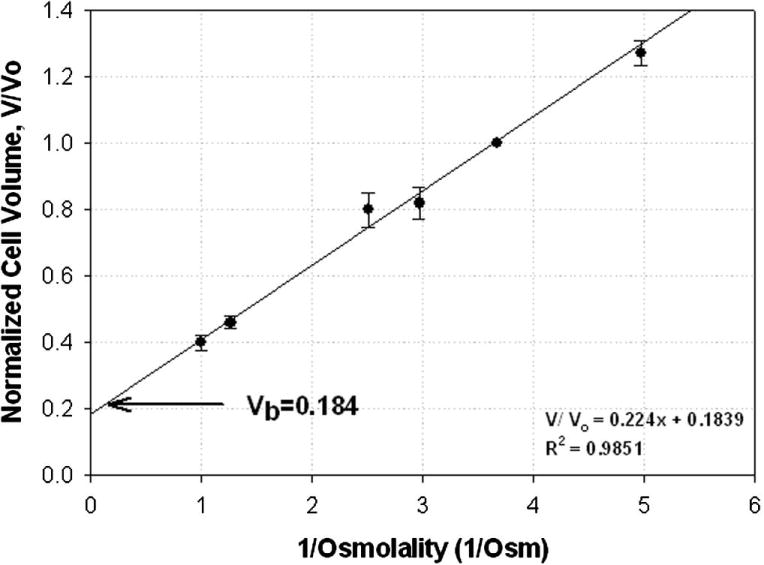
Boyle-van’t Hoff plot for βTC-tet cells. The data points represent normalized volume (mean ± SE) of cells equilibrated in NaCl solutions ranging from 0.201–1.0 Osm. The osmotically inactive volume (Vb=0.184) was found by extrapolating the concentration of the extracellular solution to infinite osmolality. Solid line indicates a best fit through the data points assuming a linear relationship. n=3 for all points except for the lowest osmolality (0.201 Osm) for which n=4.
When exposed to DMSO and PD, cells exhibited the characteristic shrink/swell behavior in response to a hypertonic solution of a permeating solute. With both CPAs, experiments were performed at 4, 22 and 35°C. A representative plot is shown in Figure 2 for βTC-tet cells exposed to 10% dimethyl sulfoxide at time 0 at 22°C. The figure shows raw pulse data obtained by the instrument, normalized to the initial pulse magnitude, which are proportional to the average cell volume at each particular instant of time; the two-parameter (Lp and Ps) fit through the data is also shown. The determined permeability parameters for each CPA at each temperature are summarized in Table 1A. PD was found to be more permeable than DMSO at all temperatures (p<0.055), consistent with literature [2,28].
Figure 2.
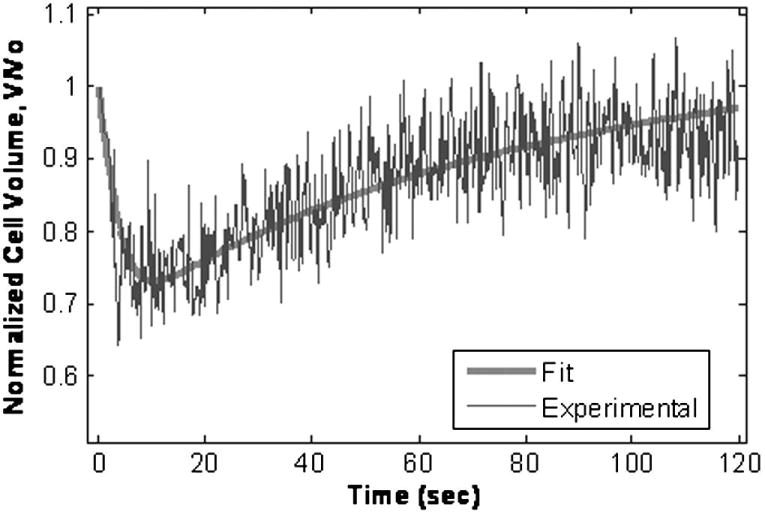
Representative plot of normalized voltage pulses vs. time generated by a Coulter Counter upon the abrupt addition at t=0 of βTC-tet cells to a 10% dimethyl sulfoxide solution at 22°C. Voltage pulses are proportional to cell volume, hence, normalized pulses represent the cell volume normalized to the volume at t=0. The solid line is the two parameter (Lp and Ps) fit through the data points.
Table 1.
A.Water (Lp) and solute (Ps) membrane permeabilities of βTC-tet cells at 4 and 22°C, mean ± SEM (standard error mean); B. Activation energies (Ea) for Lp and Ps for each CPA.
| A | |||
|---|---|---|---|
| CPA | DMSO | PD | Temp |
| Parameter | |||
| Lp (μm/atm•s) | (6.67 ± 0.88) × 10−4 | (5.0 ± 0.65) × 10−4 | 4°C |
| Ps (μm/s) | (4.73 ± 0.037) × 10−2 | (5.81 ± 0.056) × 10−2 | |
| Lp (μm/atm•s) | (3.07 ± 0.29) × 10−3 | (4.45 ± 0.15) × 10−3 | 22°C |
| Ps (μm/s) | (1.45 ± 0.077) × 10−1 | (2.32 ± 0.15) ×10−1 | |
| Lp (μm/atm•s) | (1.15 ± 0.032) × 10−2 | (6.9 ± 0.015) × 10−3 | 35°C |
| Ps (μm/s) | (6.1 ± 1.2) × 10−1 | (7.71 ± 0.135) × 10−1 | |
| B | ||
|---|---|---|
| Activation Energy (kcal/mol) | DMSO | PD |
| Lp | 15.4 | 15.4 |
| Ps | 14.1 | 14.6 |
Activation energies for Lp and Ps were calculated assuming an Arrhenius relationship (R2>0.94 for all cases). The corresponding calculated activation energies are presented in Table 1B.
βTC-tet cells osmotic tolerance
To determine the osmotic tolerances of βTC-tet cells, cells were exposed to a range of anisosmotic NaCl solutions and assessed for viability following equilibration using the trypan blue dye exclusion method and alamarBlue®. The results from both assays correlated well with each other. The Boyle van’t Hoff relationship (see Equation 4) was used to calculate the expected equilibrium cellular volume in each test solution. Comparing these volumes with the corresponding percent viability allowed for the determination of volume changes that the cells were able to tolerate. A cutoff value for viability was used to determine acceptable osmotic tolerances.
Cell viability as assessed by trypan blue and alamarBlue were found to be greater than 80% between 0.137–1.250 Osm (Figure 3). Cell viability dropped off significantly beyond this range. The corresponding volume changes calculated from the Boyle-van’t Hoff plot are +80% and −50% of the equilibrium volume, respectively.
Figure 3.
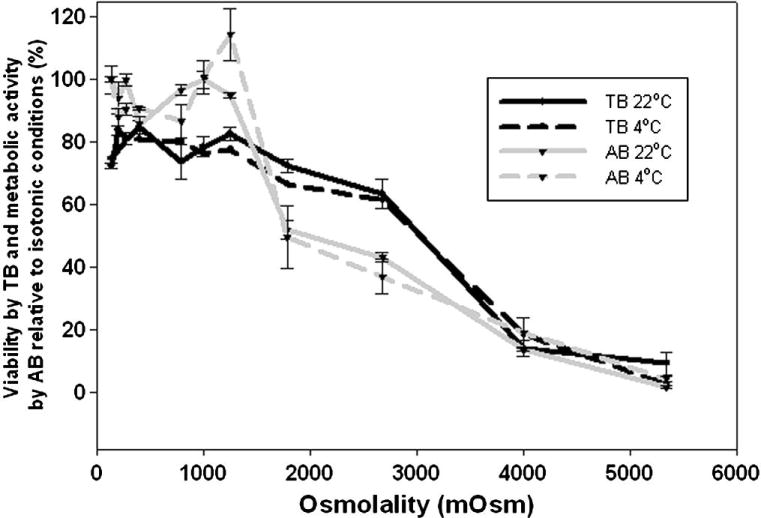
Osmotic tolerances for βTC-tet cells. βTC-tet cells were exposed to anisosmotic saline concentrations for 15 minutes at 4°C and 22°C, pelleted and then returned to isotonic saline for viability assessment using trypan blue (TB) and alamarBlue® (AB); each data point is the mean (±) standard deviation (SD) from n=5–7.
Simulations and Experimental Results for addition and removal of CPAs
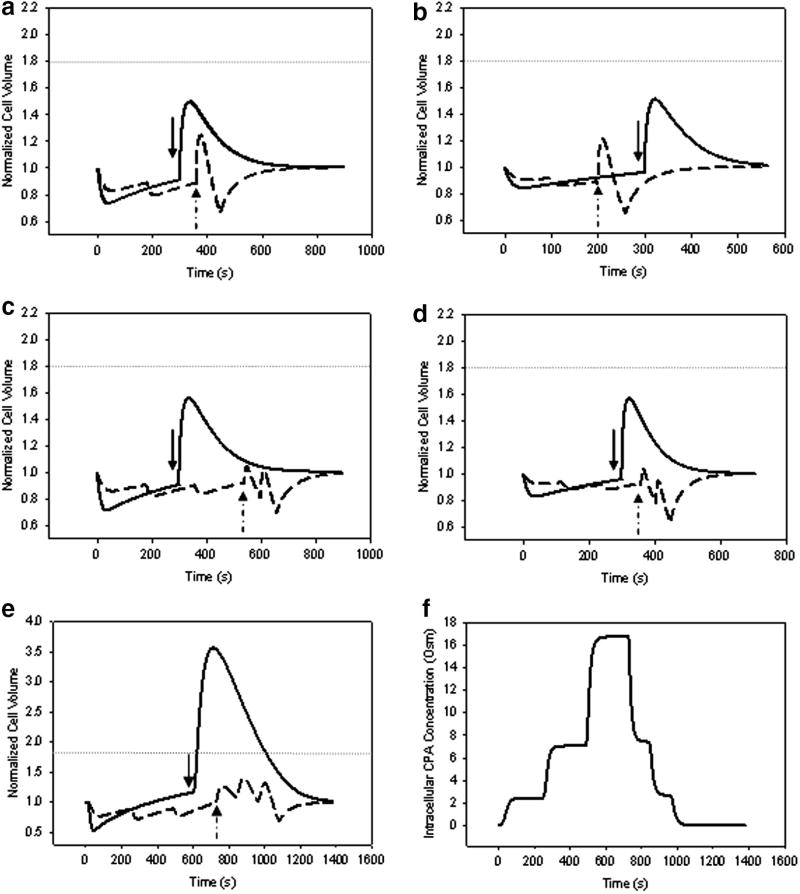
Computer simulations (Figure 4) were used to model single step and stepwise CPA addition and removal to maintain cell volume excursions within osmotically tolerable limits. Experiments were then carried out using the simulated addition and removal protocols (Figure 5). Briefly, 2.5 M DMSO was added in 2 steps at 180 s/step and removed in 2 steps at 90s and 240s; 2.5 M PD was added in 2 steps at 100s/step and removed in 2 steps at 90s and 240s; 3.0 M DMSO was added in 3 steps at 180 s/step and removed in 3 steps at 60s, 60s and 240s; 3.0 M PD was added in 3 steps at 120 s/step and removed in 3 steps at 45s, 45s and 240s; 3.0 M DMSO + 3.0 M PD was added in 3 steps at 240s/step and removed in 3 steps at 120s/step and finally 300s. The duration of the steps was determined based on maintaining the cell volume changes to within their osmotically tolerable limits. The removal steps contained 0.3 M mannitol as an osmotic buffer but the last removal step did not contain any mannitol (i.e, isotonic, culture media).
Figure 4.
Simulated volume response of βTC-tet cells during addition and removal of (A) 2.5 M DMSO, (B) 2.5 M 1,2 propanediol (PD), (C) 3.0 M DMSO, (D) 3.0 M PD, (E) 3.0 M DMSO+3.0 M PD; solid lines indicate single step addition-removal; dashed lines indicate multi-step addition-removal; arrows indicate the demarcation between CPA addition and removal; (F) Simulated intracellular solute concentration of multi-step addition and removal of 3.0 M DMSO+3.0 M PD. The horizontal dotted lines represent the upper osmotic tolerance limits for the βTC-tet cells used in the simulations (lower limit is below volume excursions exhibited in the simulations)
Figure 5.
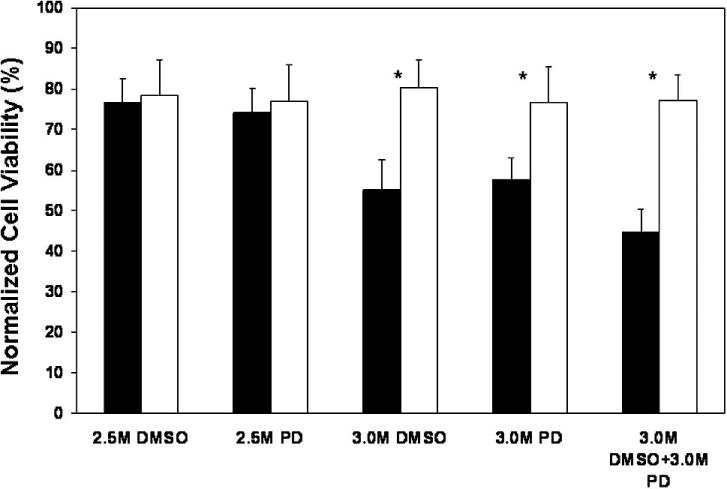
Viability of βTC-tet cells, measured by alamarBlue® and normalized to isotonic values, following single-step (filled bars) and multi-step (open bars) CPA addition and removal; each bar graph is the mean (±) SD from n=3; * indicates statistical difference between corresponding single and multi-step addition and removal with the following p-values: 3 M DMSO single-step vs. multi-step=0.0000125; 3 M PD single-step vs. multi-step=0.000392; 3 M DMSO + 3 M PD single-step vs. multi-step=0.0000489.
Although membrane permeabilities and osmotic tolerances may differ between suspended and attached cells, the simulations of Figure 4, based on parameters obtained with suspended βTC-tet cells, were used to guide the addition and removal of CPAs from monolayer βTC-tet cultures. Experimental results are shown in Figure 5. As expected, for the lower concentrations of CPAs, single or stepwise addition and removal resulted in high viability as the volume excursions did not surpass osmotic tolerances. However, single step addition and removal of 3 M DMSO and 3 M PD resulted in lower cell viability compared to the multi-step approach. The largest difference between single and multi-step addition and removal came from the use of a vitrification-relevant cocktail of 3 M DMSO+3 M PD (Figure 5). The single step addition and removal of this cocktail resulted in excessive volume excursions; however, its proper stepwise addition and removal kept the cellular volume excursions within a tolerable limit and thus enabled higher cell survival. Based on computer simulations, equilibration of intracellular cryoprotectant concentrations (shown for the vitrification-relevant CPA cocktail, Figure 4F) was rapid, occurring within a few minutes; this agrees with the results of Wusteman, et al. who found equilibration of vascular endothelial cells with 6.12 M PD to occur within 2 minutes [28].
Effects of cryoprotectant exposure on insulinomas
A concentration range of DMSO and PD were studied to determine the effects of cryoprotectant exposure on βTC-tet viability. Again, even though this experiment was conducted with βTC-tet monolayers, the simulations of Figure 4 were used to guide the stepwise addition and removal of the 4 M and 6 M concentrations of CPAs; addition and removal of the CPAs at 2 M were carried out in single steps. Cell viability decreased with increasing CPA concentration from 2 M to 4 M and from 4 M to 6 M for DMSO, and from 2 M to 4 M for PD (Figure 6). Interestingly, exposure to the CPA cocktail (3 M DMSO+3 M PD) resulted in a lower viability compared to 6 M PD; the latter was not statistically different from the viability in 6 M DMSO. Overall, these results indicate that under proper CPA loading and unloading, βTC-tet cells can tolerate high concentrations of DMSO, PD or a combination of the two. This type of study is useful for selecting low toxicity CPAs for the development of vitrification solutions.
Figure 6.
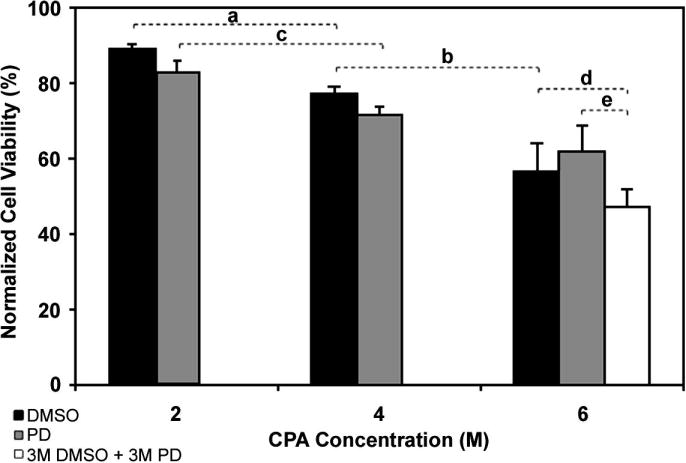
Normalized cell viability of βTC-tet cells, measured by alamarBlue®, after exposure to various concentrations of DMSO (black bars), PD (gray bars) and a cocktail of 3.0 M DMSO + 3.0 M PD (white bar); values are mean ± SD normalized to controls (using PBS only) from n=3 in each group, except with 6 M CPAs where n=5; horizontal brackets indicate comparison between groups with the following p-values: a: 0.0011; b: 0.0025; c: 0.0064; d: 0.072; e: 0.018
Discussion
In this study, membrane permeabilities as well as osmotic and cytotoxic tolerances of murine insulinomas were determined to develop a multi-step addition and removal procedure for CPAs at vitrification-relevant concentrations. This information helps in developing optimized cryopreservation protocols for cells by themselves and incorporated in a tissue engineered pancreatic substitute.
Electronic particle counters, such as the Coulter Counter®, have been used extensively to determine water and solute permeability parameters by modeling the transient kinetic behavior of cell volume changes in response to a step change in the concentration of a permeating CPA [2,3,10,23,28]. Values of Lp and Ps in the presence of DMSO and PD at 22°C were found to be similar to reported values for other cell types, including human vascular endothelial cells [28], hamster islets [6], and human platelets [4]. As with other cells, βTC-tet cells were found to be more permeable to PD than DMSO [10]. Besides cell type, membrane permeability parameters depend on temperature, CPA type, and possibly CPA concentration [10,18]. To examine the effect of CPA concentration on the membrane permeability of βTC-tet cells, kinetic cell volume changes to DMSO and PD were studied at room temperature for concentration steps of 0 to 1.5 M and of 1.5 M to 3.0 M. Volume profiles measured with the Coulter Counter® were fit to the two-parameter permeability formulism, as before.
Membrane permeability parameters can depend on several factors, including temperature, initial CPA concentration and cell culturing mode and organization. The temperature dependence usually follows the Arrhenius relationship, which was also observed in this study with insulin-producing cells. Initial CPA concentration can increase or decrease the membrane permeability depending on the cell and solute type [9,10,15] (also preliminary data from our lab, not shown). Recent work by Elliott et. al. [12] examined the dependence of osmolality on higher CPA concentrations by investigating the effect of solution non-ideality in osmotic equilibrium modeling. In this work, osmolalites from a high (6 M) CPA concentration solution was accounted for based on their model.
Another factor that can influence membrane permeability is the organization or attachment status of the cells. Membrane permeability for human dermal fibroblasts reportedly differ by more than 20-fold between cells in suspension and in tissue engineered collagen constructs (4.34×10⁻¹⁴m/Pa.s vs. 105×10−14m/Pa.s) [5]. Using this factor of 20 for membrane permeability variability, CPA addition and removal simulations were carried out for βTC-tet cells at 3 M DMSO + 3 M PD, keeping the addition and removal protocol the same as in the simulations of Figure 4. Increasing or decreasing the permeabilites together by a factor of 20 maintained the volume excursions within the osmotically tolerable limits (simulations not shown). Hence, using cell suspension-derived membrane permeabilites to design of CPA addition-removal protocols is valuable for cell monolayers, too, as done in this study. Currently, measuring membrane permeability parameters for cell monolayers remains more challenging and potentially more costly compared to cell suspensions [27]. Furthermore, cell organization may play a more significant role during cryopreservation: it has been shown that monolayers are more prone to intracellular freezing than cell suspensions due to cell-cell and cell-substrate interactions [1,22,24]. A recent study by Pegg [22] investigated the cryopreservation of human umbilical vascular endothelial cells as suspensions and monolayers on solid polystyrene microcarrier beads. Using the same arbitrarily designed CPA addition and removal protocol for both cell culture configurations, different cryopreservation protocols were tested by varying the cooling rate and then assessed for cell recovery post-thawing. Although cell recovery was similar between suspensions and monolayers at high cooling rates (10, 47 or 500 °C/min), it was different at slower cooling rates (0.3 and 1 °C/min), indicating that cell culturing mode plays a significant role in the cryopreservation outcome.
The activation energies for Lp for DMSO and PD were found to be similar to corresponding activation energies reported for human islets for the same CPAs [8]. Also, the activation energies for Ps for DMSO and PD were similar to values reported for human corneal keratocytes with the same CPAs [10]. In the osmotic tolerance studies, employed viability assays were based on cell membrane permeability (trypan blue exclusion dye) and cell metabolic activity (alamarBlue®). It was found that the two methods compared well with each other. Dye exlusion methods, such as trypan blue or propidium iodide, are end-point assays that evaluate only membrane integrity, which is indicative of necrosis or late-stage apoptosis. These assays are not sensitive to cells that might recover after stress. Pegg et al. [23] also recognized this fact by utilizing a functional assay for chondrocytes by measuring the ability of the cells to incorporate inorganic 35SO42− into newly synthesized sulfated glycosaminoglycans. Hence, dye exclusion studies in conjunction with metabolic assays may provide more insight on cellular status than either assay alone.
Computer simulations were used to predict cell volume excursions due to changes in CPA concentrations, and CPA addition/removal procedures were designed that retained cells within the osmotically tolerated domain of conditions. Moreover, CPAs were tested for their cytotoxic effects. Although cocktails have generally been used to reduce cytotoxicity of high CPA concentrations, this is empirical and thus may not be generally applicable [13]. Indeed, the 3 M DMSO+ 3 M PD cocktail was found to be more cytotoxic towards βTC-tet cells than 6 M of each CPA alone under the experimental conditions implemented in this study (Figure 6). Transport across the cell membrane of the dual-solute system of DMSO and PD was modeled as a single component system of the slower permeant, DMSO. This is a reasonable approximation, since equilibration of the more rapidly permeating CPA, PD, should occur first.
This study has defined the necessary parameters to cryopreserve murine insulinomas that have been used in model tissue engineered pancreatic substitutes [21,26]. The use of encapsulated insulin-secreting cells holds significant promise for effectively treating insulin-dependent diabetes, by providing a highly regulated system that responds to environmental glucose cues. The development and characterization of cryopreservation protocols is an integral part of making this therapeutic modality available at a clinically-relevant scale. This includes coupling information from this study with water and cryoprotectant transport rates through the matrix to provide the necessary information to effectively cryopreserve all cells in a tissue engineered construct. Although differences may arise in the osmotic behavior of cells as free in suspension compared to those embedded in a matrix, it is anticipated that such differences will be small or negligible, as is the case for chondrons relative to free chondrocytes [7,14].
Acknowledgments
The authors would like to thank Andres Lobeiras from Beckman Coulter, Inc. as well as Johnafel Crowe from GTEC for technical assistance with the Multisizer™ 3 Coulter Counter®.
Footnotes
Publisher's Disclaimer: This is a PDF file of an unedited manuscript that has been accepted for publication. As a service to our customers we are providing this early version of the manuscript. The manuscript will undergo copyediting, typesetting, and review of the resulting proof before it is published in its final citable form. Please note that during the production process errors may be discovered which could affect the content, and all legal disclaimers that apply to the journal pertain.
References
- 1.Acker JP, McGann LE. Cell-cell contact affects membrane integrity after intracellular freezing. Cryobiology. 2000;40:54–63. doi: 10.1006/cryo.1999.2221. [DOI] [PubMed] [Google Scholar]
- 2.Adams SL, Kleinhans FW, Mladenov PV, Hessian PA. Membrane permeability characteristics and osmotic tolerance limits of sea urchin (Evechinus chloroticus) eggs. Cryobiology. 2003;47:1–13. doi: 10.1016/s0011-2240(03)00063-4. [DOI] [PubMed] [Google Scholar]
- 3.Agca Y, Mullen S, Liu J, Johnson-Ward J, Gould K, Chan A, Critser J. Osmotic tolerance and membrane permeability characteristics of rhesus monkey (Macaca mulatta) spermatozoa. Cryobiology. 2005;51:1–14. doi: 10.1016/j.cryobiol.2005.04.004. [DOI] [PubMed] [Google Scholar]
- 4.Arnaud FG, Pegg DE. Permeation of glycerol and propane-1,2-diol into human platelets. Cryobiology. 1990;27:107–18. doi: 10.1016/0011-2240(90)90002-l. [DOI] [PubMed] [Google Scholar]
- 5.Balasubramanian SK, Bischof JC, Hubel A. Water transport and IIF parameters for a connective tissue equivalent. Cryobiology. 2006;52:62–73. doi: 10.1016/j.cryobiol.2005.09.009. [DOI] [PubMed] [Google Scholar]
- 6.Benson CT, Liu C, Gao DY, Critser ES, Benson JD, Critser JK. Hydraulic conductivity (Lp) and its activation energy (Ea), cryoprotectant agent permeability (Ps) and its Ea, and reflection coefficients (sigma) for golden hamster individual pancreatic islet cell membranes. Cryobiology. 1998;37:290–9. doi: 10.1006/cryo.1998.2124. [DOI] [PubMed] [Google Scholar]
- 7.Bush PG, Hall AC. The osmotic sensitivity of isolated and in situ bovine articular chondrocytes. J Orthop Res. 2001;19:768–78. doi: 10.1016/S0736-0266(01)00013-4. [DOI] [PubMed] [Google Scholar]
- 8.de Freitas RC, Diller KR, Lakey JR, Rajotte RV. Osmotic behavior and transport properties of human islets in a dimethyl sulfoxide solution. Cryobiology. 1997;35:230–9. doi: 10.1006/cryo.1997.2045. [DOI] [PubMed] [Google Scholar]
- 9.Devireddy RV, Leibo SP. Calculated permeability coefficients for water and cryoprotective additives of ovine primordial follicles at suprazero temperatures, Cryo 2006. Hamburg: Germany; 2006. [Google Scholar]
- 10.Ebertz SL, McGann LE. Cryoprotectant permeability parameters for cells used in a bioengineered human corneal equivalent and applications for cryopreservation. Cryobiology. 2004;49:169–80. doi: 10.1016/j.cryobiol.2004.06.005. [DOI] [PubMed] [Google Scholar]
- 11.Efrat S, Fusco-DeMane D, Lemberg H, al Emran O, Wang X. Conditional transformation of a pancreatic beta-cell line derived from transgenic mice expressing a tetracycline-regulated oncogene. Proc Natl Acad Sci U S A. 1995;92:3576–80. doi: 10.1073/pnas.92.8.3576. [DOI] [PMC free article] [PubMed] [Google Scholar]
- 12.Elliott JA, Prickett RC, Elmoazzen HY, Porter KR, McGann LE. A multisolute osmotic virial equation for solutions of interest in biology. J Phys Chem B. 2007;111:1775–85. doi: 10.1021/jp0680342. [DOI] [PubMed] [Google Scholar]
- 13.Elmoazzen HY, Poovadan A, Law GK, Elliott JA, McGann LE, Jomha NM. Dimethyl sulfoxide toxicity kinetics in intact articular cartilage. Cell Tissue Bank. 2006 doi: 10.1007/s10561-006-9023-y. [DOI] [PubMed] [Google Scholar]
- 14.Hing WA, Poole CA, Jensen CG, Watson M. An integrated environmental perfusion chamber and heating system for long-term, high resolution imaging of living cells. J Microsc. 2000;199( Pt 2):90–5. doi: 10.1046/j.1365-2818.2000.00727.x. [DOI] [PubMed] [Google Scholar]
- 15.Kardak A, Leibo SP, Devireddy RV. Freezing characteristics of macawue and equine ovarian tissue sections in mixtures of dimethyl sulfoxide and ethylene glycol, Cryo 2006. Hamburg: Germany; 2006. [Google Scholar]
- 16.Kleinhans FW. Membrane permeability modeling: Kedem-Katchalsky vs a two-parameter formalism. Cryobiology. 1998;37:271–89. doi: 10.1006/cryo.1998.2135. [DOI] [PubMed] [Google Scholar]
- 17.Mazur P. Principles of Cryobiology. in: F. In: Benson B, Lane N, editors. Life in the Frozen State. Taylor and Francis Books: London; 2004. pp. 3–65. [Google Scholar]
- 18.McGrath JJ. Quantitative measurement of cell membrane transport: technology and applications. Cryobiology. 1997;34:315–34. doi: 10.1006/cryo.1997.2013. [DOI] [PubMed] [Google Scholar]
- 19.Mukherjee N, Chen Z, Sambanis A, Song Y. Effects of cryopreservation on cell viability and insulin secretion in a model tissue-engineered pancreatic substitute (TEPS) Cell Transplant. 2005;14:449–56. doi: 10.3727/000000005783982882. [DOI] [PubMed] [Google Scholar]
- 20.Muldrew K, McGann LE. Mechanisms of intracellular ice formation. Biophys J. 1990;57:525–32. doi: 10.1016/S0006-3495(90)82568-6. [DOI] [PMC free article] [PubMed] [Google Scholar]
- 21.Papas KK, Long RC, Jr, Constantinidis I, Sambanis A. Role of ATP and Pi in the mechanism of insulin secretion in the mouse insulinoma betaTC3 cell line. Biochem J. 1997;326( Pt 3):807–14. doi: 10.1042/bj3260807. [DOI] [PMC free article] [PubMed] [Google Scholar]
- 22.Pegg DE. Cryopreservation of vascular endothelial cells as isolated cells and as monolayers. Cryobiology. 2002;44:46–53. doi: 10.1016/S0011-2240(02)00003-2. [DOI] [PubMed] [Google Scholar]
- 23.Pegg DE, Wusteman MC, Wang L. Cryopreservation of articular cartilage 1: Conventional cryopreservation methods. Cryobiology. 2006;52:335–346. doi: 10.1016/j.cryobiol.2006.01.005. [DOI] [PubMed] [Google Scholar]
- 24.Porcshe AM, Korber C, Rau G. Freeze-thaw behaviour of cultured (bovine corneal) endothelial cells: Suspension vs. monolayer. Cryobiology. 1991;28:545. [Google Scholar]
- 25.Song YC, Chen ZZ, Mukherjee N, Lightfoot FG, Taylor MJ, Brockbank KG, Sambanis A. Vitrification of tissue engineered pancreatic substitute. Transplant Proc. 2005;37:253–5. doi: 10.1016/j.transproceed.2004.11.027. [DOI] [PubMed] [Google Scholar]
- 26.Tziampazis E, Sambanis A. Tissue engineering of a bioartificial pancreas: modeling the cell environment and device function. Biotechnol Prog. 1995;11:115–26. doi: 10.1021/bp00032a001. [DOI] [PubMed] [Google Scholar]
- 27.Verkman AS. Water permeability measurement in living cells and complex tissues. J Membr Biol. 2000;173:73–87. doi: 10.1007/s002320001009. [DOI] [PubMed] [Google Scholar]
- 28.Wusteman MC, Pegg DE, Robinson MP, Wang LH, Fitch P. Vitrification media: toxicity, permeability, and dielectric properties. Cryobiology. 2002;44:24–37. doi: 10.1016/S0011-2240(02)00002-0. [DOI] [PubMed] [Google Scholar]
- 29.Zhao G, He L, Zhang H, Ding W, Liu Z, Luo D, Gao D. Trapped water of human erythrocytes and its application in cryopreservation. Biophys Chem. 2004;107:189–95. doi: 10.1016/S0301-4622(03)00211-4. [DOI] [PubMed] [Google Scholar]


