Abstract
The identification of RNases or RNase effectors is a continuous challenge, particularly given the current importance of RNAs in the control of genome expression. Here, we show that a fluorogenic RNA–DNA hybrid is a powerful tool for a real-time fluorescence detection and assay of exoribonucleases (RT-FeDEx). This RT-FeDEx assay provides a new strategy for the isolation, purification, and assay of known and unknown exoribonucleases.
Keywords: exoribonuclease, purification, detection, inhibitor, activator, screening
INTRODUCTION
RNA plays a key role in the majority of cellular functions. Determining which processes involve ribonuclease activities and influence RNA stability is therefore essential. A number of different approaches can be used to study exoribonuclease activities in vitro. Assays that measure the release of TCA-soluble radioactive nucleotides or polyacrylamide gel-based assays are commonly used to quantify exoribonuclease activity (Pellegrini et al. 2008). These assays are time consuming, require handling of radioactivity, polyacrylamide, centrifugation, or scintillation counting. We therefore tested the feasibility of a real-time (RT) exoribonuclease assay based on fluorescence resonance energy transfer (FRET).
RESULTS AND DISCUSSION
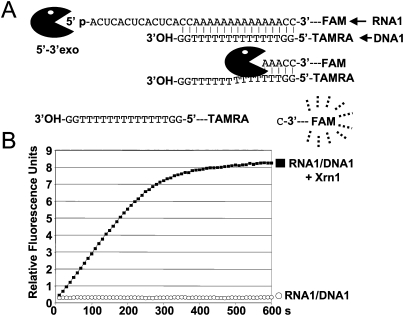
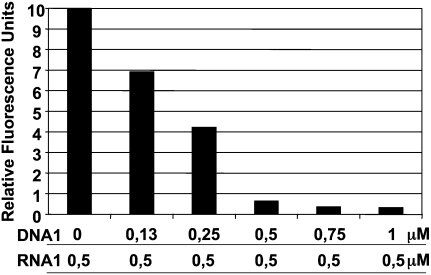
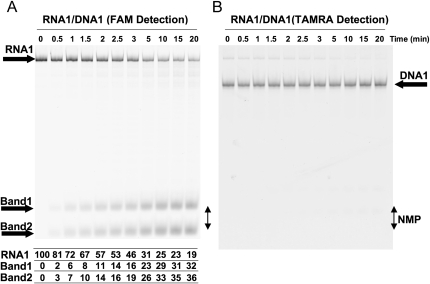
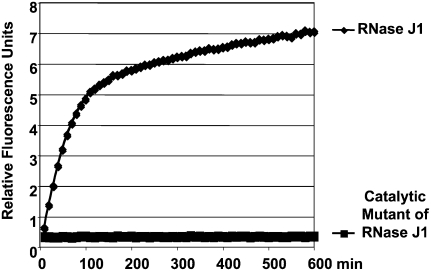
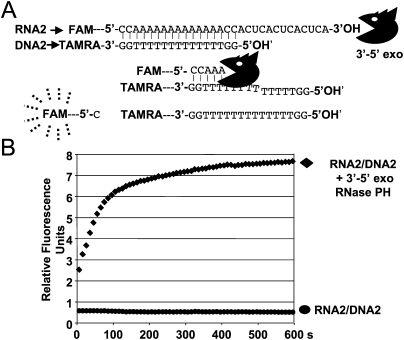
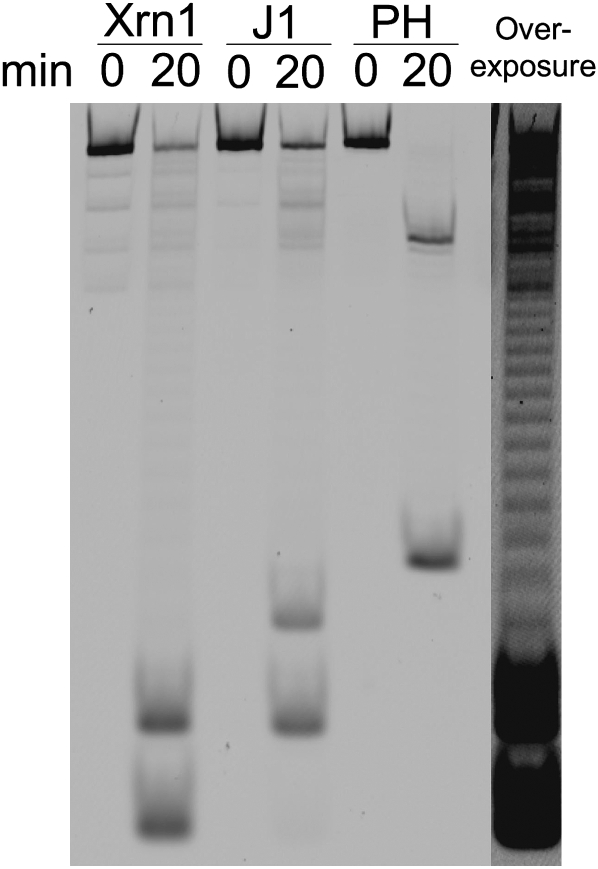
This approach uses the release of fluorescence from a fluorescent RNA substrate hybridized to a quencher DNA to quantify enzymatic activity and facilitate the detection of exoribonuclease activity with purified proteins or in cellular extracts (Fig. 1A). The assays can be monitored with a fluorimeter or real-time polymerase chain reaction (RT-PCR) instrument. In the assay we developed here, the fluorophore carboxyfluorescein (FAM) linked to RNA was hybridized to a DNA oligonucleotide containing a quencher carboxytetramethylrhodamine (TAMRA) (Fig. 1A). At 30°C, the duplex forms instantly and a stoichiometry of two molecules of TAMRA–DNA for one molecule of FAM–RNA was shown to cause a 30-fold reduction in the fluorescence emitted by the FAM-linked RNA (Fig. 2). We have primarily tested the 5′–3′ exoribonuclease Xrn1 from Saccharomyces cerevisiae to validate this new approach (Pellegrini et al. 2008), and have observed that incubation of the FAM–RNA/TAMRA–DNA hybrid with the exoribonuclease leads to a rapid release of fluorescence (Fig. 1B). The products of the reaction were also verified directly by separating the digestion products of the DNA–RNA duplex on a polyacrylamide gel (Fig. 3). The gel was scanned on a Typhoon (GE Healthcare) to detect FAM- or TAMRA-associated fluorescence, and bands were quantified. The quantification of the FAM-associated bands confirmed that the RNA is digested to release products migrating in the size range of very short oligonucleotides (Fig. 3A). Quantification of these FAM-associated species revealed that the vast majority of the emitted fluorescence signal is therefore due to these two short FAM-linked species. The TAMRA-linked DNA remains intact during this assay, as DNA is not a substrate for Xrn1. Two pieces of evidence suggest that the DNA oligonucleotide does not impede the progression of Xrn1: (1) we do not see an accumulation of a species corresponding to the position of hybridization of the DNA oligonucleotide (Fig. 3), and (2) the kinetics of release of mononucleotide is identical in reactions with or without the DNA oligonucleotide (data not shown). Other 5′–3′ exoribonucleases, namely, Rat1 from S. cerevisiae, Rat1 from S. pombe (Xiang et al. 2009), and the 5′–3′ exoribonuclease RNase J1 from B. subtilis (Mathy et al. 2007), were also assayed successfully using this technique (Fig. 4). To demonstrate that the real-time fluorescence detection and assay of exoribonucleases (RT-FeDEx) assay is not limited to 5′–3′ exoribonucleases, another RNA–DNA duplex, RNA2/DNA2, was designed to be sensitive toward 3′–5′ exoribonucleases (Fig. 5). This duplex was used to detect the 3′–5′ exoribonuclease activity of RNase PH (Condon et al. 2008) from B. subtilis through an increase in the fluorescence signal (Fig. 5). We also analyzed the decay products on polyacrylamide gels after digestion by RNase J1 or RNase PH. These enzymes release longer FAM-linked oligoribonucleotides (Fig. 6) that are shown to be associated with increased fluorescence (Figs. 4, 5). We, therefore, propose that once the RNA is short enough, it is released from the quenching DNA oligonucleotide. From these experiments, it is clear that even enzymes exhibiting low processivity can be detected using this approach.
FIGURE 1.
Real-time fluorescence-based analysis of RNA hydrolysis by Xrn1 exoribonuclease. (A) The formation of the RNA–DNA duplex brings the TAMRA into the vicinity of FAM to quench FAM fluorescence emission (see Fig. 2). Digestion of RNA1 releases the FAM from the oligonucleotide and permits FAM fluorescence to be detected at 520 nm. (B) In the presence of 50 nM Xrn1 exoribonuclease and 500 nM of RNA1, an immediate generation of FAM fluorescence signal can be monitored in real time.
FIGURE 2.
Fluorescence quenching of FAM by TAMRA. The following assays were monitored on a Rotor Gene apparatus at 30°C, set up to detect FAM fluorescence. A concentration of 0.5 μM of RNA1 (FAM-linked) was incubated with various concentrations of DNA1 (TAMRA-linked). At 30°C, quenching of FAM fluorescence confirms that the duplex forms instantly (the duplex was designed with a Tm of 34°C). A stoichiometry of two molecules of TAMRA for one molecule of FAM leads to a 30-fold reduction in the fluorescence emitted by the FAM-linked RNA. Reproducible results were obtained with various RNA1 concentrations (ratio 1/2 for FAM/TAMRA).
FIGURE 3.
Typhoon analysis of the products of the RT-FeDEx reaction. Separation on 20% polyacrylamide gel (5 M urea). (A) The gel was scanned on a Typhoon to detect the fluorescence associated with FAM. RNA1 is principally digested to the size of short oligonucleotides linked to FAM; Bands 1 and 2 are likely to correspond to very short oligoribonucleotides linked to FAM, one or two cytosines linked to FAM if we consider that FAM molecules are expected to not strongly alter the migration of linked nucleotides. The position of the migration of radiolabeled UMP or GMP is indicated by a double arrowhead and NMP. Results of a quantification of FAM-associated bands 1 and 2 and full-length RNA1 are shown at the bottom in A in percentage of the full-length RNA1 input. Quantification was performed with an Image Quant software; (B) The same gel was scanned to detect the fluorescence associated with TAMRA. The TAMRA-linked DNA remains intact during the assay. Xylene cyanol and bromophenol blue are not present in the loading buffer in order to prevent a parasitic fluorescence signal. Faint bands are also due to some emission of fluorescence of FAM at 580 nm.
FIGURE 4.
Real-time fluorescence-based analysis of RNA hydrolysis by a catalytic mutant of an exoribonuclease. FAM-linked RNA1 hydrolysis by RNase J1 or by a catalytic mutant of RNase J1 (Mathy et al. 2007) is analyzed by the release of a fluorescence signal. The experiment was performed in similar conditions to those in Figure 1. RT-FeDEx analysis demonstrates that a catalytic mutant of RNase J1 is unable to produce an increase in a fluorescence signal.
FIGURE 5.
Real-time fluorescence-based analysis of RNA digestion by the 3′–5′ exoribonuclease activity of RNase PH. (A) RNA2 was designed to be sensitive to potential 3′–5′ exoribonucleases. Based on the same procedure mentioned in Figure 1, RNA2–DNA2 duplex formation brings the TAMRA into the vicinity of FAM and to quench FAM fluorescence emission. (B) In the presence of RNase PH exoribonuclease, the increase in FAM fluorescence signal can be analyzed in real time. RNA2 and DNA2 concentrations are, respectively, 0.5 μM and 1 μM.
FIGURE 6.
Typhoon analysis of the products of the RT-FeDEx reaction released by the 5′–3′ exoribonuclease J1 or the 3′–5′ exoribonuclease RNase PH. Separation on 20% polyacrylamide gel (5 M urea). The gel was scanned on a Typhoon to detect the fluorescence associated with FAM. RNA1/DNA1 duplexes are incubated in the presence of Xrn1 or RNase J1, RNA2/DNA2 duplexes in the presence of RNase PH. RNA1 and RNA2 are principally digested to the size of short oligonucleotides linked to FAM. Analysis of an overexposed gel (only lane in the presence of Xrn1 [20 min] is shown on the right) suggest that RNase J1 (J1) and RNase PH (PH) produce short oligonucleotides of 2–3 nucleotides (nt) and 4 or 5 nt, respectively, if one considers that the fast migrating band produced by Xrn1 is a single nucleotide linked to FAM. In the particular case of the RNase PH digestion, a slow migrating band, about 17 nucleotides in length, is likely to correspond to the 5′ proximal sequence of RNA2, protected by base pairings with DNA2 during RNase PH digestion. RNA and DNA concentrations are 0.5 μM and 1 μM, respectively; enzyme concentrations are 50 nM.
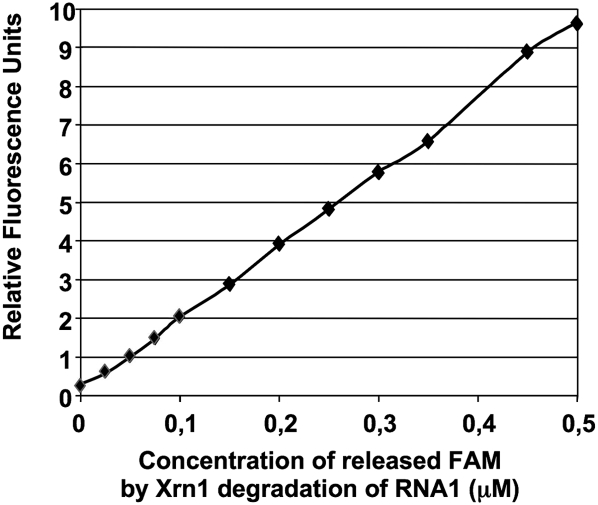
The fluorimeter can easily be calibrated to identify the linear range of correlation between the relative fluorescence units and the concentration of digested RNA (Fig. 7). Figures 2 and 7 also show that the digestion of 0.5 μM of RNA by Xrn1, whether in the presence or absence of a quenching DNA oligonucleotide, gives an identical value of about 10 units of relative fluorescence. This shows that the presence of the quenching DNA has no impact on the emission of fluorescence and that the reaction essentially goes to completion; a value above 8 (see Fig. 1) means that Xrn1 degrades more than 80% of RNA molecules within 10 min. Analysis of the products on gels by Typhoon confirms that about 75% of the full-length RNA is degraded after 10 min (81% after 20 min) (see the quantifications shown in Fig. 3A). We have observed highly reproducible kinetics when initial RNA concentrations are above 0.1 μM. These constraints, which depend on fluorimeter sensitivity and on the affinity of the exoribonuclease for the substrate, were easily circumvented for all of the tested ribonucleases.
FIGURE 7.
Correlation between relative fluorescence units and concentrations of released FAM-labeled nucleotides. A linear correlation between fluorescence units and digested RNA concentrations was determined. The increase of fluorescence signal (in relative units) reflect, therefore, directly and linearily the increase in total RNA digestion in molarity (see Materials and Methods).
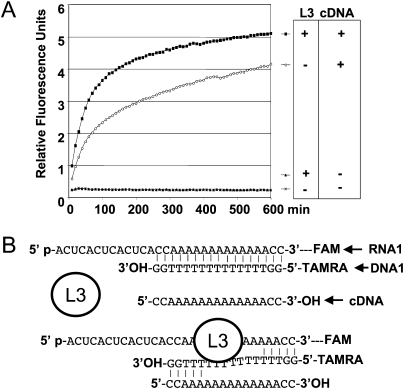
To demonstrate that the binding of the nuclease is not sufficient to cause strand separation without degradation, we addressed this question by first testing a catalytic mutant of the 5′–3′ exoribonuclease J1 (Fig. 4; Mathy et al. 2007). Unlike the wild-type protein, this mutant is incapable of releasing fluorescence. Since it could be argued that this catalytic mutant might also have a lower affinity for RNA, we also tested the impact of a protein having a well-known affinity for RNA but no nuclease activity (Fig. 8). The ribosomal protein L3 was assayed to investigate the impact of a nonspecific RNA binding protein on the separation of the RNA:DNA hybrid (Redko and Condon 2009). We observed that the increase of a fluorescence signal cannot be detected unless competitor DNA is added to the reaction mix. This competitor is a complementary oligonucleotide, designed to trap the quenching DNA strand when released from the duplex (Fig. 8B). The requirement of a trap for the separation of two RNA strands has already been employed to assay RNA helicase activities (Bizebard et al. 2004). These results taken together suggest that the mere binding of the exonuclease is not sufficient to stably displace the equilibrium of the reaction toward the separation of the two strands. In the absence of a competitor, RNA digestion is therefore necessary for the increase of a fluorescence signal.
FIGURE 8.
Impact of an RNA binding protein with no nuclease activity. (A) The following assays were monitored on a Rotor Gene apparatus at 30°C, in the conditions described in Figure 1 (identical assay buffer and concentration of 0.5 μM of RNA1 [FAM-linked], 1 μM of DNA1 [TAMRA-linked]). In the presence of the ribosomal protein L3, 100 nM (Redko and Condon 2009), the lack of an increase in FAM fluorescence confirms that the duplex continues to form sufficiently. Thus, the RNA binding of a protein, per se, does not produce a fluorescence signal. However, the addition of 2 μM of a complementary DNA of DNA1, cDNA, used as a trap, leads to an increase in the fluorescence signal, more rapid if L3 is present. Sequence of cDNA is 5′-CCAAAAAAAAAAAAACC-3′. This observation is similar to what is known from the experiments on RNA helicase activity measurements (Bizebard et al. 2004). (B) Schematic representation of how the presence of cDNA and/or L3 can separate the two strands of the RNA1/DNA1 duplex. This approach is potentially adaptable to RNA helicase activity measurements.
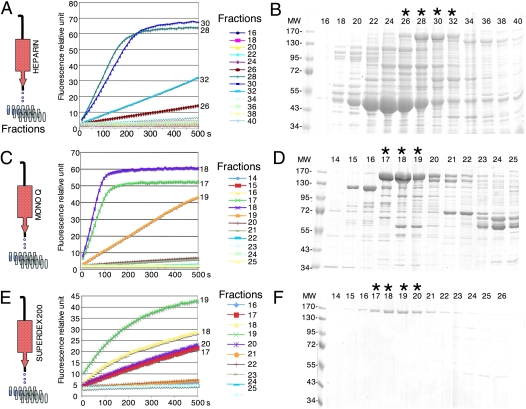
We propose that the purification of known or unknown exoribonucleases can also be easily performed using RT-FedEx. We purified Xrn1 protein from yeast extracts by following a classic three-step protocol employed in our laboratory (Fig. 9; Pellegrini et al. 2008). Because of the presence of background activities, it is indeed difficult to detect a difference in fluorescence release in wild-type versus Δxrn1 cell extracts. Although it is not possible to distinguish between RNase, DNase, helicase, or RNA chaperon activities in a crude extract, a single-column chromatography step (DE52) (see Materials and Methods; data not shown) was sufficient to separate Xrn1 from parasitic nuclease activities, however. Furthermore, the assay can be modified to determine the exact nature of the active fraction. A modified DNA oligonucleotide as a 2′-O′-modified DNA or locked nucleic acids (LNA) could also be used to increase the resistance to nucleases. Using this procedure, we easily followed the 5′–3′ exoribonuclease activity of Xrn1 present in the samples. Assays for the presence or absence of Xrn1 activity were performed in real time during the different elution and column wash steps. The classic protocol typically takes about 10 d to perform. Using this protocol, we shortened the Xrn1 purification period to less than 3 d, with a guarantee of following an active enzyme (rather than a band on a protein gel) for the whole procedure (Fig. 9; see Materials and Methods).
FIGURE 9.
Purification of a 5′–3′ exoribonuclease, Xrn1 from S. cerevisiae. The protocol used for this purification is identical to a previously published protocol (Pellegrini et al. 2008) using radiolabeled RNA to test for the Xrn1 activity. Samples from successive elutions (see Materials and Methods), Heparin (A), Mono Q (C), and Superdex 200 (E), were diluted 100-fold and assayed in the presence of the fluorogenic RNA1/DNA1 duplex. Only samples of interest are shown. After the purification, samples were analyzed by Coomassie blue-stained SDS-PAGE (heparin [B]), Mono Q [D], and Superdex 200 [F] showing the successive steps of Xrn1 purification (band at 175 kDa). Equal volumes of dilutions of the different fractions were assayed independently of total protein concentrations. For example, the fraction 19 (C) has an apparently lower activity than fractions 17 and 18, but this fraction is less concentrated in Xrn1 protein (B). (MW) Protein size standard in kilodaltons. Lanes noted with an asterisk (*) correspond to fractions with peaks of Xrn1 activity.
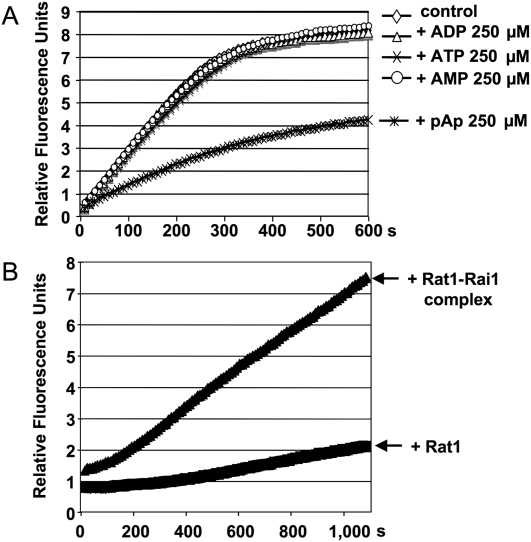
Testing potential regulators of exoribonuclease activity can also be considered. For example, Xrn1 is known to be inhibited by 3′-phopho-Adenosine-5′-phosphate (pAp) in vitro (Dichtl et al. 1997). The accumulation of pAp was also shown to be down-regulated during salt stress in vivo (Todeschini et al. 2006). Using this assay, we were able to follow the inhibitory action of pAp on Xrn1 activity immediately and in real time (Fig. 10A). High-throughput screening facilities are nowadays equipped with fluorescence detectors to screen libraries of active compounds. RT-FeDEx thus is readily adaptable to large-scale screenings of RNase effectors.
FIGURE 10.
Real-time fluorescence-based analysis of RNA hydrolysis by an exoribonuclease under various conditions. The experiment was performed in similar conditions to those in Figure 1. (A) Detection of an inhibitor of Xrn1 activity. Kinetics of RNA hydrolysis by Xrn1 alone or in the presence of ATP, ADP, AMP, or pAp. A specific inhibition of Xrn1 by pAp can be detected, as has been previously published (Dichtl et al. 1997). (B) Detection of protein complex activity. Hydrolysis of 500 nM of RNA1 by Rat1 of S. pombe alone (150 nM) or in the presence of Rai1 (150 nM) (Xiang et al. 2009). RT-FeDEx analysis shows the increased activity of Rat1 in the Rat1–Rai1 complex, as has been reported (Xue et al. 2000, 2009).
Exoribonucleases belonging to complexes can harbor differential levels of exonucleolytic activity compared with the exoribonuclease itself. The RT-FeDEx assay may help screen for new interacting partners. The Rat1–Rai1 complex was shown to have an increased exonucleolytic activity in vitro compared with the 5′–3′ exoribonuclease Rat1 itself (Xue et al. 2000; Xiang et al. 2009). This activation was easily confirmed by this fluorescence-based assay (Fig. 10B).
Here, we have developed a simple in vitro real-time exoribonuclease assay that can be performed with either 5′–3′ or 3′–5′ exoribonucleases. Similar approaches had been developed to detect endoribonuclease activity by using a target RNA that harbors an internal cleavage site framed by a fluorophore and a quencher (Jiang and Belasco 2004). We observed that this kind of construction does not allow the detection of exoribonuclease activity (data not shown), presumably because fluorophore-labeled nucleotides block the progression of exoribonucleases. With RT-FedEx, known and unknown exoribonucleases, active protein complexes can be detected and purified, and effectors of their activity can be screened. This approach greatly simplifies classic exoribonuclease purification protocols. The development of fluorogenic nucleic acid technology makes this approach more and more affordable. Moreover, these fluorogenic oligonucleotides have remained stable at –20°C for more than 2 yr. Numerous assays have been performed and were ultimately less costly than classic assays requiring radiolabeled RNAs. Modified oligonucleotides can also be designed in accordance with the enzymatic constraints of the protein of interest. Finally, RT-FeDEx will enrich our understanding of ribonuclease functions.
MATERIALS AND METHODS
Fluorescence analysis
FAM-modified RNA, RNA1, and RNA2, and TAMRA-modified DNA, DNA1, and DNA2, were produced by Eurogentec. FAM peaks of absorbance and emission are determined at 494 nm and 520 nm, respectively. TAMRA peaks of absorbance and emission are determined at 565 nm and 580 nm, respectively. The fluorescence assay was performed at 30°C on a real-time rotor gene PCR instrument (Corbett Research) (source, 470 nm; detector, 510 nm [to detect FAM-associated fluorescence]). For FAM analysis with a Typhoon, the emission filter was set up at 520 nm and detector at 532 nm. For TAMRA analysis with a typhoon, emission filter was set up at 580 nm and detector at 488 nm. Assay reaction buffer of Xrn1, RNase J1, Rat1, or Rat1-Rai1 contains 30 mM Tris-Hcl (pH 8.0), 2 mM MgCl2, 50 mM NH4Cl, 0.5 mM DTT, 20 μg/mL Acetylated Bovine Serum. Assay reaction buffer of RNase PH contains 50 mM Tris-HCl (pH 8.0), 2.5 mM MgCl2, 30 mM NaCl, 10 mM K2HPO4, 0.1 mM DTT.
Correlation between relative fluorescence units and concentrations of released FAM-labeled nucleotides
A total digestion of RNA1 was performed in the presence of Xrn1, 4 h at 30°C in the Xrn1 reaction buffer. Xrn1 was heat inactivated (3 min at 80°C). At a final concentration of 1 μM, TAMRA-linked DNA, a range of different concentrations of the digested RNA1 was mixed to the full-length RNA1 to make a final concentration of 0.5 μM of all relative FAM-containing molecules. This preparation mimics the RNA1 digestion by Xrn1, with the advantage of knowing the concentration of digested RNA1 in the mix. All samples were prepared in 20 μL Xrn1 reaction buffer and were analyzed at 30°c with a Rotor Gene apparatus (source at 470 nm, detector at 510 nm).
Xrn1 purification
Protocol for Xrn1 purification was adapted from different protocols (Pellegrini et al. 2008). S. cerevisiae Xrn1 was purified from the strain C131BYS86/pRDK249 grown in HC-Ura medium containing the nonfermentable carbon sources lactic acid (2%) and glycerol (3%). The cells are harvested 16 h after the addition of 2% galactose, pelleted, and frozen at −80°C until further use. All procedures are performed at 4°C. In a typical preparation, 6.5 g of cells are resuspended in 20 mL Buffer B (20 mM Tris-HCl at pH 7.5, 10% glycerol, 0.5 mM DTT, 1 mM EDTA, 0.1 mM PMSF) containing 150 mM NaCl and 5 μg/mL DNase I. The cells are disrupted by French press and then centrifuged at 10,000 rpm. The resulting supernatant is applied to a DE52 (Whatman) column equilibrated in buffer B containing 150 mM NaCl and washed with the same buffer. The flowthrough fraction is loaded on a 5 mL HiTrap heparin (GE healthcare) column also equilibrated in buffer B. Then the column is washed extensively in buffer B containing 300 mM NaCl and eluted with a linear gradient (40 mL) from 300 mM to 1 M NaCl in buffer B. The fractions containing Xrn1 activity are applied to Mono Q HR 5/5 column (GE Healthcare) equilibrated in the same buffer. The peak fractions of Xrn1 activity are pooled and loaded on a Superdex 200 HR 26/60 column (GE Healthcare) equilibrated in buffer B containing 250 mM NaCl. Peak fractions containing Xrn1 are pooled.
ACKNOWLEDGMENTS
We thank Arlen W. Johnson for plasmid pRDK249 and Yulia Redko for the ribosomal protein L3. This work was supported by funds from the Centre National de la Recherche Scientifique (UPR9073 CNRS), Université Paris VII-Denis Diderot, from the Association pour la Recherche sur le Cancer (ARC A07/2/4831), and from ANR blanc (REGULncRNA). F.S. was a recipient of a fellowship from the Ministère pour la Recherche et la Technologie (MNRT).
Footnotes
Article published online ahead of print. Article and publication date are at http://www.rnajournal.org/cgi/doi/10.1261/rna.1670909.
REFERENCES
- Bizebard T, Ferlenghi I, Iost I, Dreyfus M. Studies on three E. coli DEAD-box helicases point to an unwinding mechanism different from that of model DNA helicases. Biochemistry. 2004;43:7857–7866. doi: 10.1021/bi049852s. [DOI] [PubMed] [Google Scholar]
- Condon C, Pellegrini O, Mathy N, Benard L, Redko Y, Oussenko IA, Deikus G, Bechhofer DH. Assay of Bacillus subtilis ribonucleases in vitro. Methods Enzymol. 2008;447:277–308. doi: 10.1016/S0076-6879(08)02215-5. [DOI] [PubMed] [Google Scholar]
- Dichtl B, Stevens A, Tollervey D. Lithium toxicity in yeast is due to the inhibition of RNA processing enzymes. EMBO J. 1997;16:7184–7195. doi: 10.1093/emboj/16.23.7184. [DOI] [PMC free article] [PubMed] [Google Scholar]
- Jiang X, Belasco JG. Catalytic activation of multimeric RNase E and RNase G by 5′-monophosphorylated RNA. Proc Natl Acad Sci. 2004;101:9211–9216. doi: 10.1073/pnas.0401382101. [DOI] [PMC free article] [PubMed] [Google Scholar]
- Mathy N, Benard L, Pellegrini O, Daou R, Wen T, Condon C. 5′-to-3′ exoribonuclease activity in bacteria: Role of RNase J1 in rRNA maturation and 5′ stability of mRNA. Cell. 2007;129:681–692. doi: 10.1016/j.cell.2007.02.051. [DOI] [PubMed] [Google Scholar]
- Pellegrini O, Mathy N, Condon C, Benard L. In vitro assays of 5′ to 3′-exoribonuclease activity. Methods Enzymol. 2008;448:167–183. doi: 10.1016/S0076-6879(08)02609-8. [DOI] [PubMed] [Google Scholar]
- Redko Y, Condon C. Ribosomal protein L3 bound to 23S precursor rRNA stimulates its maturation by Mini-III ribonuclease. Mol Microbiol. 2009;71:1145–1154. doi: 10.1111/j.1365-2958.2008.06591.x. [DOI] [PubMed] [Google Scholar]
- Todeschini AL, Condon C, Benard L. Sodium-induced GCN4 expression controls the accumulation of the 5′ to 3′ RNA degradation inhibitor, 3′-phosphoadenosine 5′-phosphate. J Biol Chem. 2006;281:3276–3282. doi: 10.1074/jbc.M511688200. [DOI] [PubMed] [Google Scholar]
- Xiang S, Cooper-Morgan A, Jiao X, Kiledjian M, Manley JL, Tong L. Structure and function of the 5′→3′ exoribonuclease Rat1 and its activating partner Rai1. Nature. 2009;458:784–788. doi: 10.1038/nature07731. [DOI] [PMC free article] [PubMed] [Google Scholar]
- Xue Y, Bai X, Lee I, Kallstrom G, Ho J, Brown J, Stevens A, Johnson AW. Saccharomyces cerevisiae RAI1 (YGL246c) is homologous to human DOM3Z and encodes a protein that binds the nuclear exoribonuclease Rat1p. Mol Cell Biol. 2000;20:4006–4015. doi: 10.1128/mcb.20.11.4006-4015.2000. [DOI] [PMC free article] [PubMed] [Google Scholar]


