

Abstract
NikD catalyzes a remarkable aromatization reaction that converts piperideine-2-carboxylate (P2C) to picolinate, a key component of the nonribosomal peptide in nikkomycin antibiotics. The enzyme exhibits a FAD-Trp355 charge-transfer band at weakly alkaline pH that is abolished upon protonation of an unknown ionizable residue that exhibits a pKa of 7.3. Stopped-flow studies of the reductive half-reaction with wild-type nikD and P2C show that the enzyme oxidizes the enamine tautomer of P2C but do not distinguish among several possible paths for the initial 2-electron oxidation step. Replacement of Glu101 or Asp276 by a neutral residue does not eliminate the ionizable group, although the observed pKa is 1 or 2 pH units higher, respectively, compared with wild-type nikD. Importantly, the mutations cause only a modest decrease (< 5-fold) in the observed rate of oxidation of P2C to dihydropicolinate. The results rule out the only possible candidates for a catalytic base in the initial 2-electron oxidation step. This outcome provides compelling evidence that nikD oxidizes the bond between N(1) and C(6) in the enamine tautomer of P2C, ruling out alternative paths that require an active site base to mediate the oxidation of a carbon-carbon bond. Because the same restraint applies to the second 2-electron oxidation step, the dihydropicolinate intermediate must be converted to an isomer that contains an oxidizable carbon-nitrogen bond. A novel role is proposed for reduced FAD as an acid-base catalyst in the isomerization of dihydropicolinate.
Nonribosomal peptides constitute an important group of natural products that display a broad range of useful therapeutic properties, including antifungal, antibacterial, immunosuppressive and anticancer activities. The diversity of these natural products is achieved, in part, by the incorporation of a wide variety of nonproteogenic amino acids. Nikkomycins are potent antifungal agents that act by blocking the biosynthesis of chitin, the second most abundant polysaccharide in nature (1, 2). The nonribosomal peptide moiety of nikkomycins features an N-terminal pyridyl residue, derived from L-lysine, that is essential for antibiotic activity. Synthesis of the pyridyl moiety requires a L-lysine α-aminotransferase (3) and nikD, an unusual amino acid oxidase that contains one mol of covalently bound FAD (4) and acts as an obligate 2-electron acceptor (5). The α-aminotransferase converts L-lysine to piperideine-2-carboxylate (P2C), a compound that can exist in imine and enamine tautomeric forms (6-8). NikD catalyzes a remarkable aromatization reaction that converts P2C to picolinate, accompanied by the reduction of 2 mol of oxygen to hydrogen peroxide (Scheme 1) (5).
Scheme 1.

The nikD-catalyzed 4-electron oxidation of P2C to picolinate.
The first step in the nikD reaction involves formation of an enzyme•substrate charge-transfer complex with the electron-rich P2C enamine. The ES complex is converted into a reduced enzyme•dihydropicolinate (DHP) complex in a second step that exhibits a hyperbolic dependence on substrate concentration (9). There are several possible paths for this initial 2-electron oxidation step (Scheme 2). Oxidation of the bond between N(1) and C(6) in the enamine tautomer (Scheme 2 path A) is consistent with results obtained in structural and biochemical studies (4, 10). In addition, nikD exhibits homology with monomeric sarcosine oxidase (MSOX) and other members of a flavoenzyme family that oxidize carbon-nitrogen bonds in various amino acid substrates (11-16). The available data do not, however, provide definitive evidence to rule out alternate reaction paths, such as oxidation of a carbon-carbon bond between C(4) and C(5) or C(5) and C(6) in the enamine (Scheme 2, paths B or C, respectively).
Scheme 2.

Possible paths for the two-electron oxidation of the enamine tautomer of P2C to isomeric dihydropicolinates.
The product of the initial 2-electron oxidation step, a reduced enzyme•DHP complex, reacts with oxygen to produce hydrogen peroxide plus an oxidized enzyme•DHP complex that can undergo a second redox cycle. It has been suggested that the second redox cycle may require prior conversion of the initially formed DHP intermediate to another isomer that can be oxidized to picolinate in a reaction that does not involve a change in regiospecificity as compared with the first redox cycle (9).
The active site in nikD is located at the interface between flavin- and substrate-binding domains. Crystal structures have been determined for two forms of a complex of wild-type enzyme with picolinate (10). In the closed form, the active site is inaccessible to solvent. Picolinate is bound close to and parallel with the flavin ring whereas the indole ring of Trp355 is perpendicular to the flavin ring (Figure 1). The ligand binding mode in this form is compatible with redox catalysis and resembles that observed with ligand-bound forms of MSOX. In the open form, the active site in nikD is accessible to solvent. However, the picolinate ligand and Trp355 have reoriented in the open form so that picolinate is perpendicular to the flavin and the indole ring of Trp355 is stacked atop the flavin ring.
Figure 1.
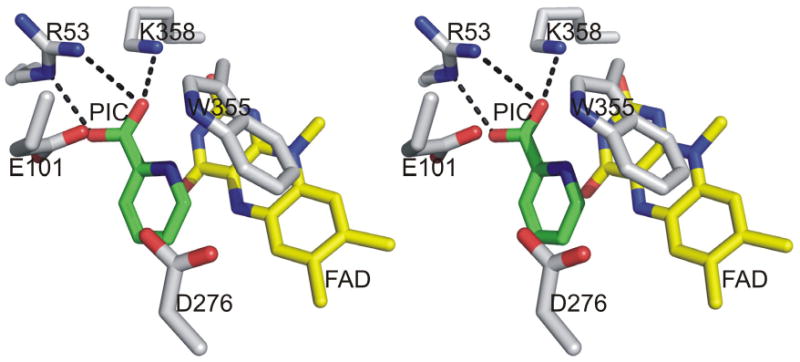
Stereoview of the nikD active site in the closed form (PDB code 2OLN0). Carbons are yellow in FAD, green in picolinate (PIC) and white in amino acid residues. Oxygen and nitrogen are colored red and blue, respectively, in all structures. Hydrogen bonds are indicated by dotted lines.
Solutions of ligand-free nikD at weakly alkaline pH exhibit two typical flavin absorption maxima at λ > 300 nm plus an unusual long-wavelength absorption band due to charge-transfer interaction between FAD and Trp355 (17). The charge-transfer interaction requires a coplanar configuration of the flavin and indole rings, as observed in the crystal structure of the open form of the enzyme•picolinate complex. A long-wavelength absorption band is not observed with solutions of free nikD at weakly acidic pH owing to protonation of an unknown residue that exhibits a pKa of 7.3 (4). The results suggest that, depending on pH, the side chain of Trp355 in solutions of free nikD may assume either of the conformations observed in the two crystal forms. However, the closed form of the enzyme•picolinate complex is likely to be the major species present in solutions of this complex, as judged by the absence of a charge-transfer band even at weakly alkaline pH.
Flavin-dependent oxidation of carbon-nitrogen or carbon-carbon bonds has been shown to involve hydride transfer from substrate C-H to flavin N(5) (18, 19). An active site base is required for oxidation of carbon-carbon bonds because, prior to or concomitant with hydride transfer, a proton must be abstracted from the adjacent carbon (18, 20). An active site base is not, however, required for oxidation of carbon-nitrogen bonds. We reasoned that this feature might therefore permit at least partial discrimination among the several possible paths for the 2-electron oxidation of the P2C enamine (Scheme 2). There are only four ionizable residues within a ∼5 Å radius of the bound ligand in the closed form of the nikD•picolinate complex (Figure 1). The carboxylate of picolinate is hydrogen bonded to the side chains of Arg53 and Lys358, which are homologous to Arg52 and Lys348 in MSOX. Asp276 in nikD aligns with His269, a catalytically important residue in MSOX (21). Glu101 in nikD is part of a mobile hairpin loop (Asp94-Gly102) that blocks access to the active site in the closed form. There is no counterpart of this loop in MSOX. Although not optimally positioned, a possible role for Glu101 or Asp276 as a catalytic base cannot be ruled out based on the observed crystal structure of the enzyme•product complex because the latter may exhibit conformational differences compared with the reactive enzyme•substrate charge-transfer complex.
In this paper, we investigate the effect of replacing Asp276 or Glu101 with a neutral residue on steady-state turnover and the reductive-half reaction with P2C. We have also examined the effect of these substitutions on the spectral properties of the mutant enzymes to determine whether Asp276 or Glu101 might correspond to the ionizable group that appears to modulate the conformation of the indole ring of Trp355 in wild-type nikD. The results provide compelling evidence in favor of one of the possible paths for the initial 2-electron oxidation of P2C and place important constraints on the mechanism of the second 2-electron oxidation step.
Experimental Procedures
Materials
Methylselenoacetate was a generous gift from Dr. Louis Silks (National Stable Isotope Resource at Los Alamos). 1-Cyclohexenoate was obtained from Aldrich. P2C was prepared as described by Bruckner et al. (5). Restriction enzymes and T4 DNA ligase were purchased from New England Biolabs. Pfu DNA polymerase was obtained from Stratagene.
Mutation of Asp276 to Asn or Glu101 to Gln
Mutations were generated by using the plasmid pDV101 (4) as template and the overlap extension PCR method described by Ho et al. (22). PCR reactions were conducted using a Hybaid Touchdown Thermocycler or a Perkin Elmer 9600 GeneAmp PCR System and products were purified as previously described (17). The left-hand fragment was generated using START (external primer) as forward primer and an internal backward primer containing the desired mutation (see Table 1). The right-hand fragment was generated using an internal forward primer containing the desired mutation and END (external primer) as backward primer. The purified left- and right-hand fragments were combined using START and END as forward and backward primers, respectively. The final PCR product was purified, digested with NdeI and XhoI, purified again and then subcloned between the NdeI and XhoI sites of plasmid pET23a. The resulting construct was used to transform E. coli BL21(DE3) cells to ampicillin resistance. For screening, plasmid DNA was isolated from randomly selected clones and digested with NdeI and XhoI. Plasmids that exhibited the expected insert size (D276N pGPZ19 and E101Q pGPZ19 for the Asp276Asn and Glu101Gln mutations, respectively) were isolated and sequenced across the entire insert. Sequencing was conducted by MWG Biotech.
Table 1.
Primers used for mutagenesisa
| Primer Type | Forward | Backward |
|---|---|---|
| External | START 5′-GACTCACTATAGGGAGACCACAACGGTTTCCCTCTAG-3′ |
END 5′-GTCGCCACCGTCGTCGGTTGAGTCGAAGGAAAGCCC-3′ |
| Internal | ||
| Asp276Asn | 5′-GTGCGCTGCGGGCCGaatTTCGAGGTGGAC-3′ | 5′-CACGCGACGCCCGGCttaAAGCTCCACCTG-3′ |
| Glu101Gln | 5′-GACGTCGTCACCAACcAGGGCCAGATCTCGGGG-3′ | 5′-CTGCAGCAGTTGTTGgTCCCGGTCTAGAGCCCC-3′ |
Mutagenic sites in the primers are shown in lower case; the codon targeted for mutagenesis is underlined.
Enzyme Isolation
Recombinant wild-type nikD or Trp355Phe was isolated from cells grown in Terrific Broth, as previously described (4, 17). The same procedure was used for expression and purification of Asp276Asn or Glu101Gln.
Steady-State Kinetic Studies
Steady-state kinetic studies with Asp276Asn or Glu101Gln were conducted by monitoring picolinate formation at 264 nm (ε = 3980 M-1 cm-1) (5) in 100 mM potassium phosphate buffer, pH 8.0, equilibrated at 25 °C with water-saturated gas mixtures containing 10, 21, 44 or 100 % oxygen (balance nitrogen), as previously described (9). Steady-state kinetic parameters were estimated by fitting an equation for a sequential (equation 1) or a ping-pong (equation 2) mechanism to data obtained with Asp276Asn or Glu101Gln, respectively (A = P2C, B = O2).
| (1) |
| (2) |
Steady-state Spectroscopy
Absorption spectra were recorded using an Agilent Technologies 8453 diode array spectrometer. All spectra are corrected for dilution. The concentration of mutant or wild-type enzyme was determined at pH 8.0 based on its absorbance at 456 nm and the extinction coefficients listed in Table 2. Extinction coefficients and the stoichiometry of covalent flavin incorporation were determined after denaturation of the mutant enzymes with 3 M guanidine hydrochloride, as previously described (15). Dissociation constants for complexes formed with the mutant enzymes and methylselenoacetate were determined by fitting a standard binding curve (ΔAobs = ΔAmax[ligand]/(Kd + [ligand]) to the data. Titration data with picolinate or 1-cyclohexenoate were analyzed by using an equation for a tight binding inhibitor (equation 3, XT and ET are total ligand and enzyme concentrations,
Table 2.
Spectral properties of Asp276Asn, Glu101Gln or wild-type nikDa
| (3) |
respectively). Spectra corresponding to 100% complex formation with methylselenoacetate, picolinate or 1-cyclohexenoate were calculated as previously described (23). pH titrations with wild-type or mutant nikD were conducted as detailed in the legends to Figures 5 or 6, respectively. pKa values were determined by fitting a theoretical pH titration curve (Y = (AH+ + BKa)/(H+ + Ka) to the data. Fitting of binding or pH titration equations was conducted by using Sigma Plot 10 (Systat Software).
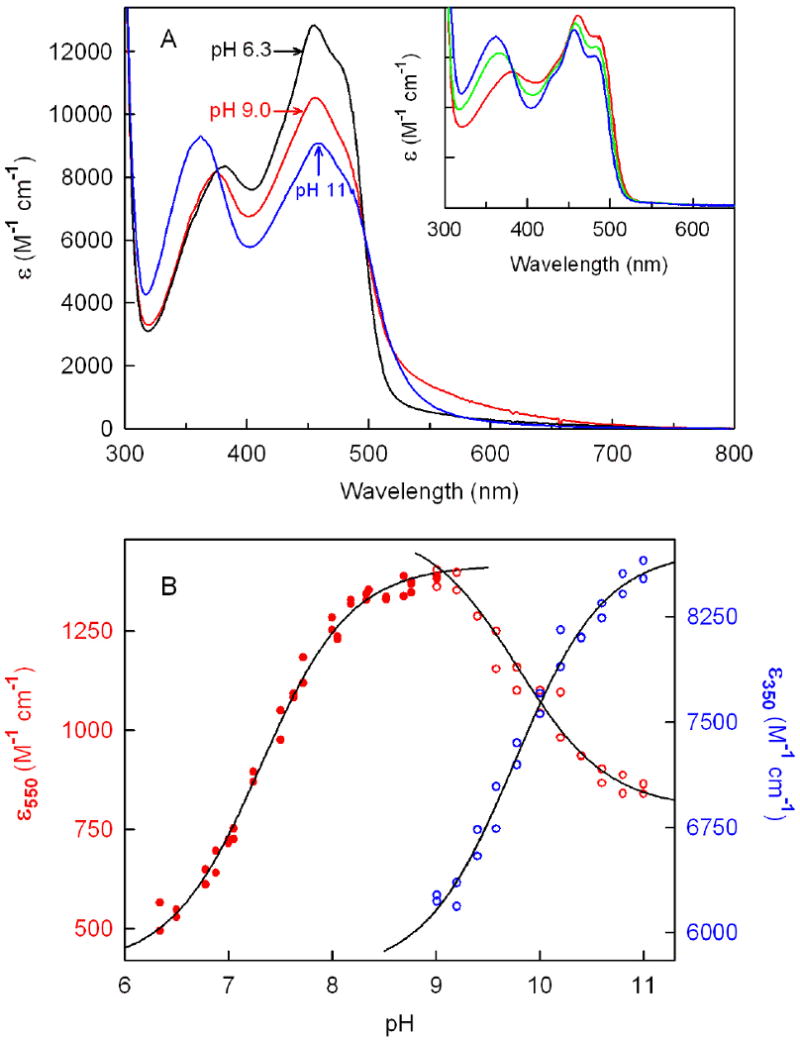
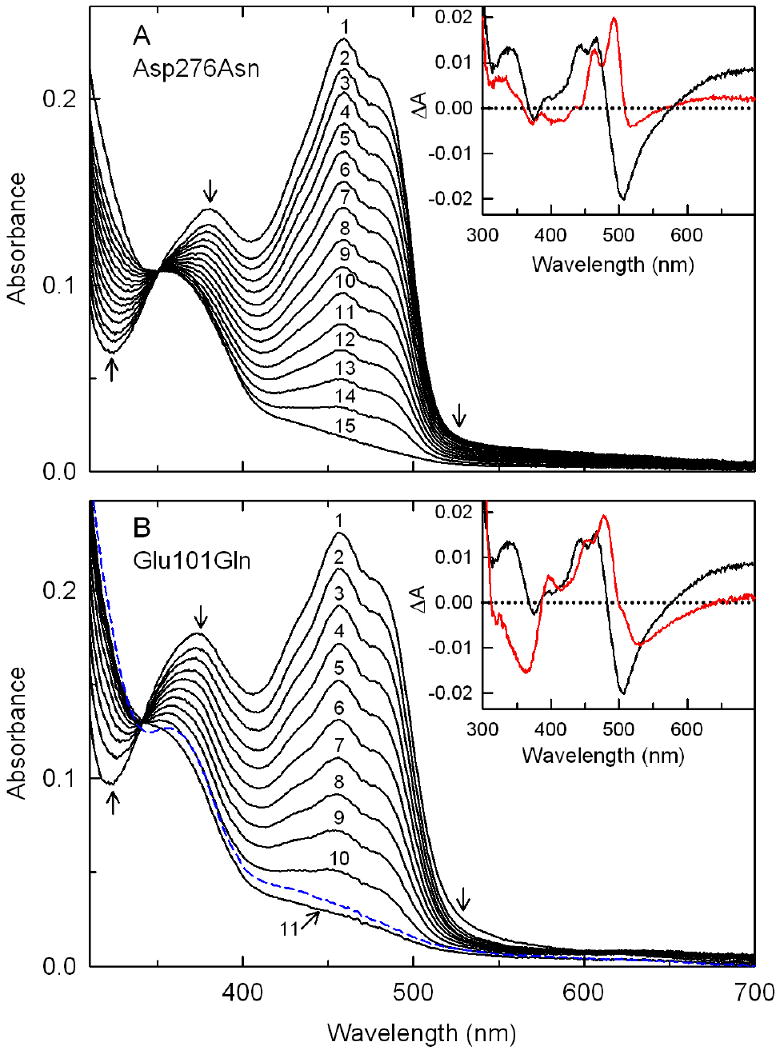
Figure 5.
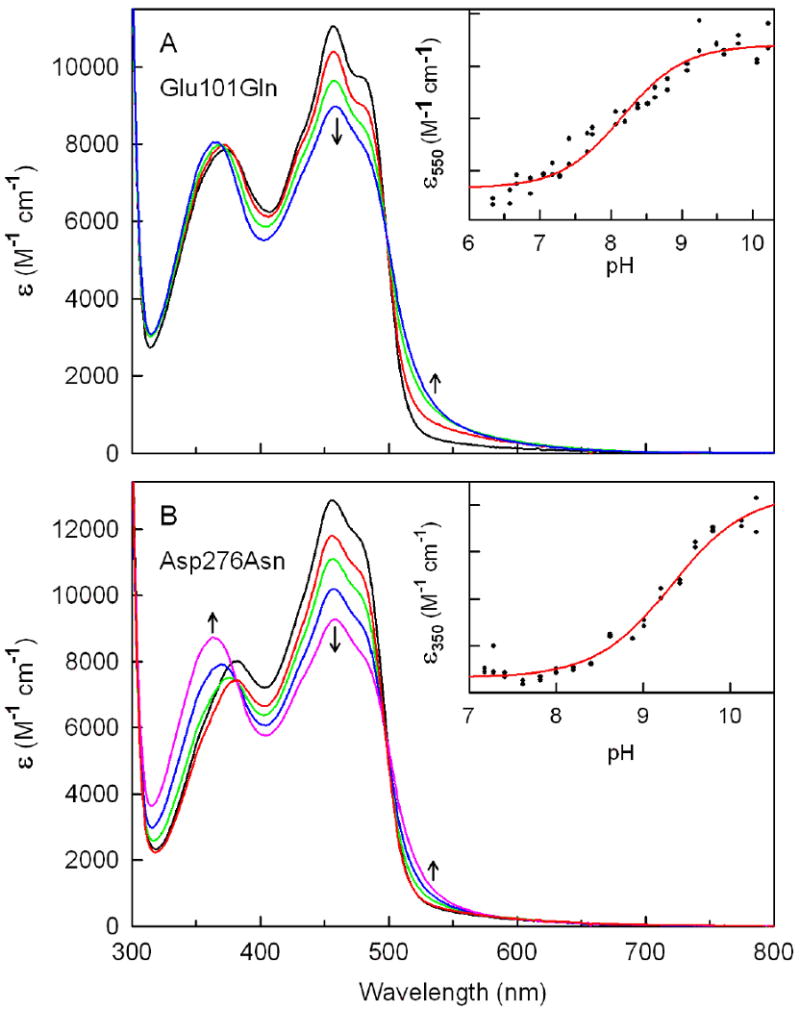
Effect of pH on the absorption spectrum of Glu101Gln or Asp276Asn. All spectra are averages of duplicate dilutions of concentrated stock solutions of the mutant enzymes into 100 mM potassium phosphate (pH 6.34 to pH 8.80), potassium pyrophosphate (pH 9.01 to pH 9.58) or sodium carbonate (pH 9.78 to pH 10.3) buffer at 10 °C. Arrows indicate the direction of the spectral changes observed with increasing pH. Panel A: Absorption spectra of Glu101Gln at pH 6.34, 8.07, 9.08 and 10.06 are shown in the black, red, green and blue curves, respectively. Panel B: Absorption spectra of Asp276Asn at pH 7.28, 7.62, 8.62, 9.42 and 10.30 are shown in the black, red, green, blue, and magenta curves, respectively. The inset in panel A or B shows a plot of extinction changes at 550 or 350 nm, respectively, as a function of pH. The solid black lines were obtained by fitting a theoretical pH titration curve (Y = (AH+ + BKa)/(H+ + Ka) to the data.
Figure 6.
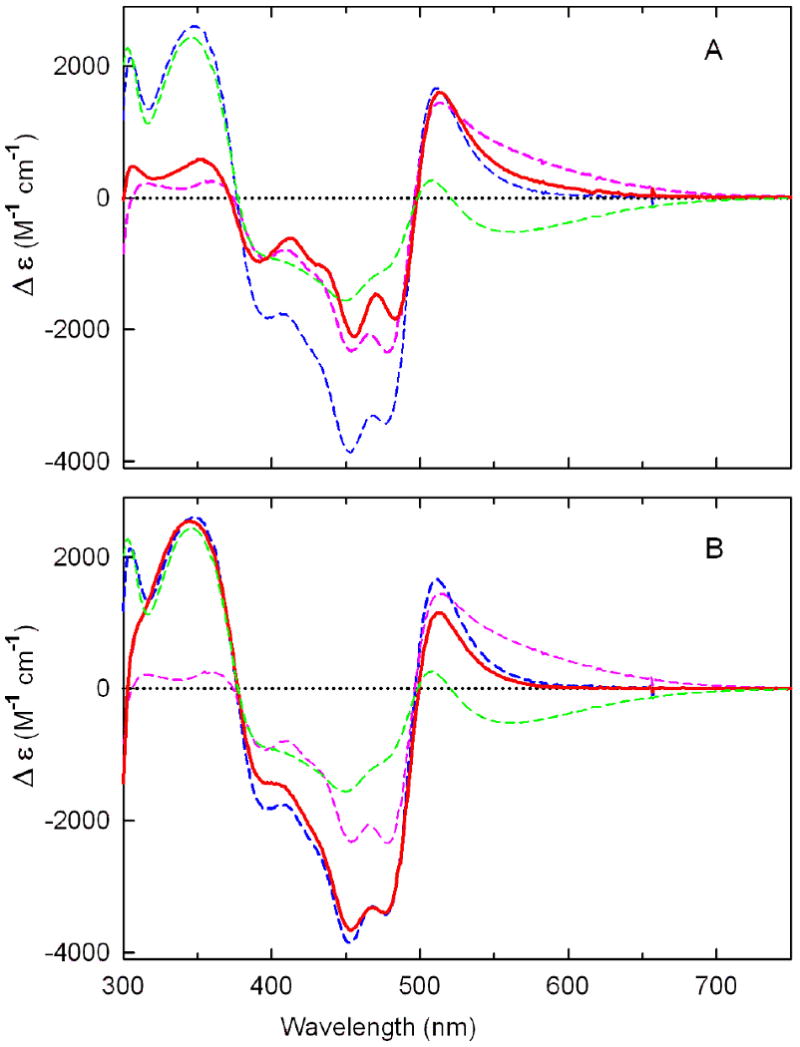
Comparison of difference spectra obtained for pH-dependent absorbance changes observed with Glu101Gln (panel A) or Asp276Asn (panel B) with those observed with wild-type nikD. Panel A: The solid red line was obtained by subtracting the spectrum observed with Glu101Gln at pH 6.34 from that observed at pH10.06. Panel B: The solid red line was obtained by subtracting the spectrum observed with Asp276Asn at pH 7.28 from that observed at pH 10.3. Results obtained with wild-type nikD are indicated by the dashed spectra in each panel. The dashed magenta and blue curves were generated by subtracting the spectrum observed at pH 6.34 from spectra obtained at pH 9.01 and pH 11.0, respectively. The dashed green was generated by subtracting the spectrum observed at pH 9.01 from that observed at pH 11.0.
Rapid Reaction Spectroscopy
Rapid reaction kinetic measurements were performed by using a Hi-Tech Scientific SF-61DX2 stopped-flow spectrometer. Data were collected in log mode to maximize the number of points acquired during the early phase of each reaction. All spectra or single-wavelength kinetic traces are the averages of at least three replicate shots. Reductive half-reactions with Asp276Asn or Glu101Gln and P2C were monitored by using diode array detection in anaerobic 100 mM potassium phosphate buffer, pH 8.0, containing 50 mM glucose and glucose oxidase (14.7 units/mL). All components, except glucose oxidase, were placed in the main compartment of a tonometer. Glucose oxidase was tipped from a sidearm into the main compartment after the solutions were made anaerobic by multiple cycles of evacuation, followed by flushing with oxygen-scrubbed argon. The entire flow circuit of the stopped-flow spectrometer was made anaerobic by an overnight incubation with anaerobic buffer containing 50 mM glucose and glucose oxidase (14.7 units/mL). All spectra are corrected for a small spectral contribution from P2C in the near-ultraviolet region. The kinetics of picolinate binding to Glu101Gln were monitored in aerobic 100 mM potassium phosphate buffer, pH 8.0, at 25 °C by using photomultiplier detection. Fitting of single-wavelength kinetic traces was conducted by using Sigma Plot 10 (Systat Software), KinetAsyst 3 (TgK Scientifc) or Kinetic Studio (TgK Scientific).
Results
Spectral Properties of Ligand-Free Asp276Asn and Glu101Gln
Wild-type nikD contains covalently bound FAD and exhibits two characteristic flavin absorption maxima at λ > 300 nm at pH 8.0 plus an unusual long-wavelength absorption band due to charge-transfer interaction between FAD and Trp355. Although these general features are observed with Asp276Asn or Glu101Gln, the spectral properties of mutants and wild-type enzyme exhibit certain distinct features. Thus, both mutants exhibit a ∼50% decrease in the intensity of the long-wavelength absorption band. The Glu101Gln mutant displays a hypsochromic shift (6 nm) of the near-UV absorption maximum. The mutant and wild-type enzymes also exhibit differences in the extinction coefficient of the peak at 456 nm (Figure 2A, Table 2).
Figure 2.
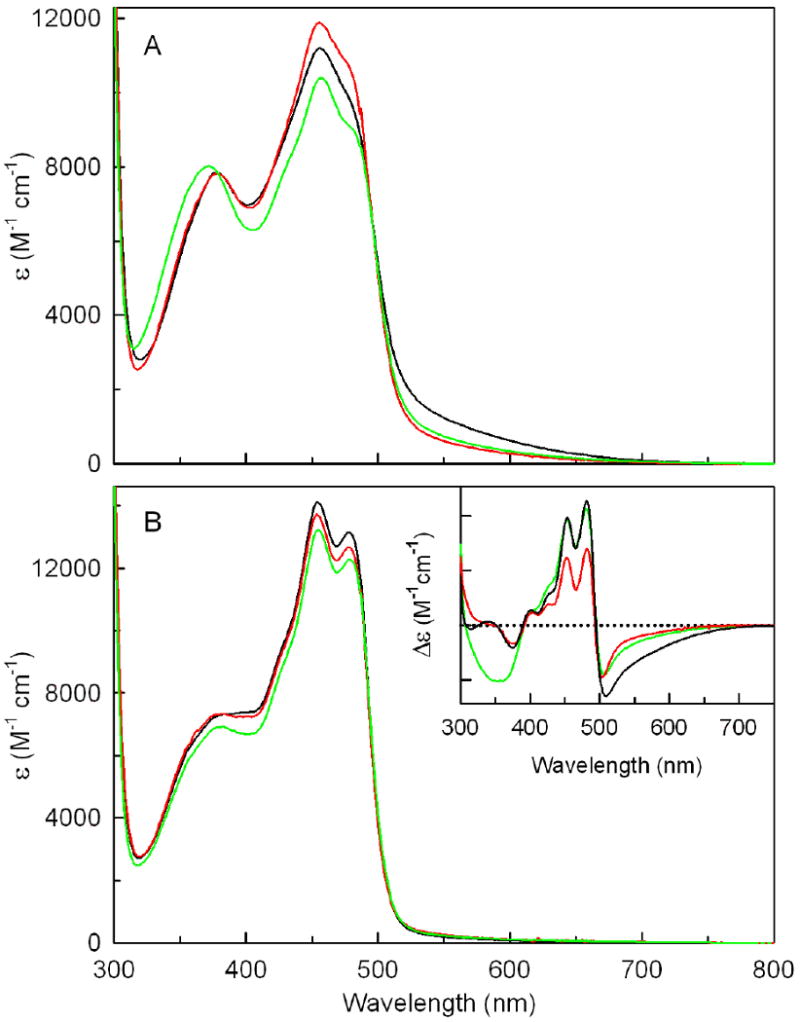
Spectral properties of free wild-type nikD, Asp276Asn or Glu101Gln and the corresponding picolinate complexes. All spectra were recorded in 100 mM potassium phosphate buffer, pH 8.0, at 25 °C. In each panel or inset, spectra obtained with wild-type nikD, Asp276Asn or Glu101Gln are shown in the black, red or green curves, respectively. Panel A shows spectra obtained with the ligand-free enzymes. Panel B shows spectra calculated for 100% picolinate complex formation using data obtained in spectral titrations, as detailed in Experimental Procedures. The inset shows difference spectra obtained by subtracting the spectrum of the free enzyme from the spectrum calculated for 100% complex formation.
Does Mutation of Asp276 or Glu101 Affect the Binding of Substrate Analogs?
Wild-type nikD forms spectrally similar complexes with various electron-poor analogs of P2C, such as picolinate, the product of the physiological reaction, or 1-cyclohexenoate (CHA), a 1-deaza analog of the enamine tautomer of P2C. In each case, ligand binding at pH 8.0 eliminates the long-wavelength absorption band and increases the extinction coefficient of the band at 456 nm, accompanied by an enhancement of its vibronic resolution (4). Unlike the free enzymes, complexes formed by Asp276Asn or Glu101Gln with picolinate or CHA exhibit absorption spectra that are remarkably similar to those observed with wild-type nikD, as illustrated by results obtained with picolinate (Figure 2B). As can be seen in the corresponding difference spectra (Figure 2B, inset), this outcome reflects differences in the nature of the ligand-induced perturbation that effectively counterbalance the spectral differences observed with the ligand-free enzymes.
Unlike picolinate or CHA, methylselenoacetate (MeSeA) is an electron-rich analog of the reactive center in the enamine tautomer of P2C and forms a charge-transfer complex with wild-type nikD (9). A charge-transfer complex is also formed with the mutant enzymes, as judged by the diagnostic increase in absorption in the long-wavelength region observed upon titration with MeSeA (data not shown, see Supporting Information Figure S1). The mutant charge-transfer bands are, however, shifted to higher energy compared with wild-type enzyme, as estimated by the position of peaks observed in the corresponding difference spectra (λmax = 512, 530 or 581 nm with Asp276Asn, Glu101Gln or wild-type nikD, respectively) (Figure 3A). The observed increase in charge-transfer band energy suggests that the mutations may cause a decrease in flavin reduction potential. The mutant enzymes, especially Glu101Gln, appear to exhibit more intense charge-transfer bands than wild-type nikD, as estimated by the amplitude of charge-transfer peaks observed in difference spectra (Figure 3A). This feature is not, however, apparent in the absolute spectrum of the Asp276Asn complex, as judged by its lower absorption in the long-wavelength region (λ > 550 nm) (Figure 3B). This difference arises because the hypsochromically shifted mutant charge-transfer band is partially obscured in the absolute spectrum by the red edge of the flavin absorption band.
Figure 3.
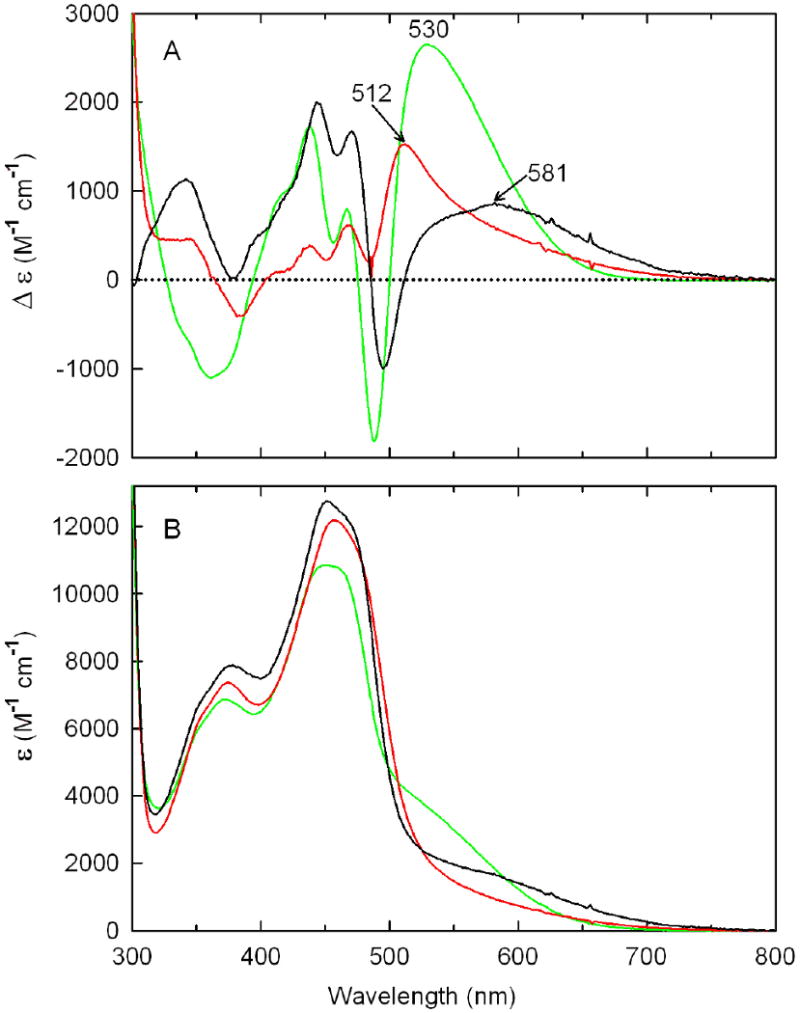
Comparison of difference (panel A) or absolute (panel B) spectra calculated for 100% complex formation with methylselenoacetate (MeSeA) and wild-type nikD (black curve), Asp276Asn (red curve) or Glu101Gln (green curve). The data for wild-type nikD were taken from Bruckner and Jorns (9).
Overall, the Asp276Asn mutation results in only minor changes in the stability of complexes formed with picolinate, CHA, or MeSeA, as judged by comparison of dissociation constants obtained with mutant or wild-type enzyme. The complexes formed with the Glu101Gln mutant tend, however, to be more stable (2- to 14-fold) than the corresponding wild-type complexes (Table 3).
Table 3.
Properties of complexes formed with wild-type or mutant nikD and various substrate analogsa
| complex | wild typeb | Asp276Asn | Glu101Gln |
|---|---|---|---|
| picolinate | |||
| Kd (μM) | 290 ± 40 | 420 ± 20 | 151 ± 2 |
| 1-cyclohexenoate | |||
| Kd (μM) | 12.8 ± 0.9 | 6.5 ± 0.9 | 0.9 ± 0.1 |
| methylselenoacetate | |||
| Kd (mM) | 1.07 ± 0.04 | 1.00 ± 0.03 | 0.112 ± 0.003 |
| λmax (CT band) (nm) | 581 | 512 | 530 |
Dissociation constants were determined based on absorbance changes observed in spectral titrations conducted in 100 mM potassium phosphate buffer, pH 8.0, at 25 °C.
Data previously reported (9).
Spectrally Detectable Ionizable Groups in Wild-type NikD or Trp355Phe
Solutions of ligand-free wild-type nikD do not exhibit a FAD-Trp355 charge-transfer band at weakly acidic pH. Increasing the pH from 6.3 to 9.0 at 10 °C results in the recovery of the charge-transfer band, accompanied by a decrease in absorbance at 456 nm (Figure 4A). Analysis of the increase in long-wavelength absorbance at 550 nm as a function of pH provides evidence for a single ionizable group with a pKa of 7.31 ± 0.01 (Figure 4B). The observed pKa is in excellent agreement with a value obtained in previous studies (pKa = 7.3) that were conducted at 25 °C within a relatively narrow pH range (6.5 to 8.6) (4).
Figure 4.
Effect of pH on the absorption spectrum of wild-type nikD or Trp355Phe. All spectra are averages of duplicate dilutions of a concentrated stock enzyme solution into 100 mM potassium phosphate (pH 6.34 to pH 8.05), potassium pyrophosphate (pH 8.05 to pH 9.58) or sodium carbonate (pH 9.78 to pH 11.0) buffer at 10 °C. Data in the pH range from 6.34 to 9.01 or from 9.01 to 11.0 with wild-type nikD were collected in two separate experiments and normalized to the same enzyme concentration. Panel A: Absorption spectra of wild-type nikD at pH 6.34, 9.01 and 11.0 are shown in the black, red and blue curves, respectively. Inset: Absorption spectra of Trp355Phe at pH 8.02, 9.40 and 10.4 are shown in the red, green, and blue curves, respectively. Panel B: The solid and open red circles show extinction changes at 550 nm in the pH range 6.34 to 9.01 and from 9.01 to 11.0, respectively. The open blue circles show extinction changes at 350 nm in the pH range from 9.01 to 11.0. The solid black lines were obtained by fitting a theoretical pH titration curve (Y = (AH+ + BKa)/(H+ + Ka) to each data set where Y is the observed extinction and A and B are calculated extinction values at low and high pH, respectively.
The lower temperature used in the current studies extended the accessible pH range up to pH 11. Increasing the pH from 9.0 to 11.0 results in a loss of long wavelength-absorption, a decrease in absorbance at 456 nm, and a pronounced hypsochromic shift of the near-UV band from 375 to 362 nm, accompanied by an increase in absorbance at 350 nm (Figure 4A). Similar values for the spectral pKa are obtained upon analysis of the absorbance decrease at 550 nm or the absorbance increase at 350 nm (pKa = 9.8 ± 0.1 or 9.75 ± 0.06, respectively) (Figure 4B). The observed spectral changes are fully reversible upon acidification and, except for the long-wavelength region, are strikingly similar to those observed upon ionization at the N(3)H position in free FAD (pKa = 10.4) (24).
Mutation of Trp355 to Phe eliminates the long-wavelength absorption band observed with wild-type nikD at slightly alkaline pH (17). Significantly, titration of Trp355Phe from pH 8.0 to 10.4 results in spectral changes that are fully characteristic of FAD ionization at N(3)H (pKa = 9.15 ± 0.05) (Figure 4A, inset). The results indicate that the FAD-Trp355 charge-transfer band observed with wild-type nikD at slightly alkaline pH is eliminated at higher pH values owing to ionization at N(3)H in FAD or at acidic pH due to protonation of an unknown amino acid residue. It is worth noting that protonation of both groups results in an enormous (40%) increase in the extinction coefficient at 456 nm, as can be seen by comparison of spectra observed with wild-type enzyme at pH 6.3 and 11.0 (Figure 4A).
Are the Ionizable Groups Observed with Wild-type NikD Affected by Mutation of Glu101 or Asp276?
Solutions of ligand-free Glu101Gln at pH 6.3 exhibit negligible absorbance in the long-wavelength region. Increasing the pH from 6.3 to 10.0 results in an increase in long-wavelength absorption, accompanied by a decrease in absorption at 456 nm (Figure 5A). The observed spectral change is strikingly similar to that observed upon ionization of a residue that exhibits a pKa of 7.31 in wild-type nikD, as judged by comparison of the corresponding difference spectra (Figure 6A). Analysis of the absorbance increase observed with Glu101Gln at 550 nm as a function of pH provides evidence for a single ionizable group with a pKa of 8.16 ± 0.07 (Figure 5A, inset). The results show that the pKa is perturbed but not eliminated in the mutant, ruling out Glu101 as a possible candidate for the unknown ionizable residue in wild-type nikD. The effect of the Glu101Gln mutation on the ionization of N(3)H in FAD is unclear. A relatively small hypsochromic shift (7 nm) of the near-UV band is observed above pH 8, but spectral changes characteristic of flavin ionization are not apparent at pH ≤10, the upper pH limit accessible with this mutant.
Titration of Asp276Asn in the pH range from 7.3 to 10.3 results in a modest increase in absorbance at λ > 500 nm, an enormous decrease (30%) in absorbance at 456 nm, and a pronounced hypsochromic shift (20 nm) of the near-UV band, accompanied by a substantial increase in absorbance at 350 nm (Figure 5B). The overall spectral change is not cleanly isosbestic. Nevertheless, results obtained upon analysis of absorbance changes observed at four different wavelengths (550, 510, 453, or 350 nm) are consistent with the presence of a single ionizable group that exhibits a pKa between 8.9 and 9.3 (Figure 5B, inset and Table 4). On the other hand, difference spectra show that the overall spectral change observed with the mutant is remarkably similar to that observed with wild-type nikD when the pH is increased from 6.3 to 11.0 (Figure 6B). Importantly, the latter pH shift results in the ionization of two groups in wild-type nikD, an unknown residue and FAD. The results strongly suggest that the pH-dependent spectral changes observed with Asp276Asn reflect ionization of the same two groups. Unlike wild-type nikD, the two groups are likely to exhibit very similar pKa values in Asp276Asn, a scenario consistent with the titration behavior observed with this mutant.
Table 4.
Spectrally detectable ionizable groups in wild-type nikD or active site mutantsa
| wild type | Trp355Phe | Asp276Asn | Glu101Gln | |||||
|---|---|---|---|---|---|---|---|---|
| pKa | λ (nm) |
pKa | λ (nm) |
pKab | λ (nm) |
pKa | λ (nm) |
|
| pKa1 | 7.31 ± 0.03c | 550 | ndd | 8.9 ± 0.1 | 550 | 8.16 ± 0.07 | 550 | |
| 9.29 ± 0.06 | 510 | |||||||
| 9.1 ± 0.1 | 453 | |||||||
| 9.32 ± 0.06 | 350 | |||||||
| pKa2 | 9.8 ± 0.1 | 550 | 9.15 ± 0.05 | 350 | ||||
| 9.75 ± 0.06 | 350 | |||||||
Spectral pKa values were determined at 10 °C based on absorbance changes at the indicated wavelength, as detailed in the text and the legends to Figures 5 and 6.
The observed pKa is likely to reflect an average value for two ionizable groups that exhibit very similar pKa values, as discussed in the text.
A value of 7.3 was previously reported for pKa1 by Venci et al. (4).
Not detectable
Effect of Changing Asp276 to Asn on Turnover and the Kinetics of the Reductive Half-reaction with P2C
Turnover rates with P2C and oxygen were measured at pH 8.0 by monitoring picolinate formation at 264 nm (5). Double reciprocal plots of reaction rate versus P2C concentration at different oxygen concentrations or versus oxygen concentration at different P2C concentrations are linear and intersect to the left of the Y-axis, just below the X-axis (data not shown, see Supporting Information Figure S2), as observed with wild-type nikD at pH 8.0 (9). The results are consistent with a sequential mechanism where oxygen reacts with a reduced enzyme•DHP complex to yield an oxidized enzyme•DHP complex that can undergo a second redox cycle to produce picolinate (Scheme 3). The steady-state kinetic parameters listed in Table 5 were obtained by fitting an equation for a sequential mechanism (equation 1) to the data obtained with Asp276Asn.
Scheme 3.

A minimal steady-state kinetic mechanism for the nikD-catalyzed conversion of P2C to picolinate (P). The red box indicates the portion of the overall reaction that is monitored in reductive half-reaction studies.
Table 5.
Kinetic parameters for the reaction of wild-type or mutant nikD with P2C at pH 8.0. 25 °C.
| Enzyme | Reductive half-reactiona | Steady-state Turnoverb | |||||
|---|---|---|---|---|---|---|---|
| klim (s-1) |
kslow (s-1) |
Kd app (μM) |
klim/Kd app (M-1 s-1) |
kcat (s-1) |
kcat/Km P2C (M-1 s-1) |
kcat/Km O2 (M-1 s-1) |
|
| wild-type | 53 ±1 | 2.7 ±0.1 | 260 ± 20 | 2.0 ± 0.2 × 10⁵ | 2.3 ± 0.2 | 2.0 ± 0.3 × 10⁵ | 2.6 ± 0.2 × 10³ |
| Asp276Asn | 11.1 ±0.2 | 3.0 ±0.3 | 110 ± 10 | 1.01 ± 0.09 × 10⁵ | 1.22 ± 0.04 | 0.9 ± 0.1 × 10⁵ | 2.0 ± 0.2 × 10³ |
| Glu101Gln | 13.9 ±0.9 | - | 1400 ± 200 | 9 ± 1 × 10³ | 0.50 ± 0.01 | 4.9 ± 0.2 × 10³ | 1.25 ±0.07 × 10³ |
A biphasic decrease in absorbance at 456 nm is observed with wild-type nikD, Asp276Asn or Glu101Gln. All three preparations exhibit a rapid phase (kfast) that comprises most of the observed absorbance change and exhibits a hyperbolic dependence on the concentration of P2C (kobs = klim[P2C]/(Kd app + [P2C]). With wild-type nikD and Asp276Asn, the rapid phase is followed by a slow phase (kslow) that is independent of the concentration of P2C. With Glu101Gln, the rapid phase is preceded by a very fast phase (kvery fast) that exhibits a linear dependence on the concentration of P2C (slope = 8.8 ± 0.2 × 10³ M-1 s-1; Y-intercept = 10.1 ± 0.9 s-1). The biphasic absorbance decrease at 456 nm is preceded by an initial lag phase (wild-type nikD, Asp276Asn) or followed by a very slow absorbance increase (Glu101Gln), as described in the text.
Double reciprocal plots obtained with wild-type nikD or Asp276Asn exhibit intersecting lines (Ki P2C = 2.9 ± 0.8 or 8 ± 2 μM, respectively). The corresponding plots with Glu101Gln exhibit parallel lines.
The turnover rate observed with Asp276Asn at saturating concentrations of P2C and oxygen is about 2-fold slower than the rate observed with wild-type nikD. This outcome does not, however, preclude a catalytically important role for Asp276 in the oxidation of P2C to DHP because this step may not be rate-limiting during turnover, as observed with wild-type nikD (9). The effect of the Asp276Asn mutation on the kinetics of P2C oxidation to DHP was investigated by monitoring the anaerobic reduction of the mutant with various concentrations of P2C in a stopped-flow spectrophotometer. The reaction observed with 100 μM P2C exhibits an initial lag, followed by a decrease in absorbance at 456 nm. The lag becomes progressively smaller at higher P2C concentrations and is barely detectable at 2500 μM P2C (Figure 7A). A similar feature is observed with wild-type nikD and reflects a relatively slow formation of the enzyme•P2C complex (9).
Figure 7.
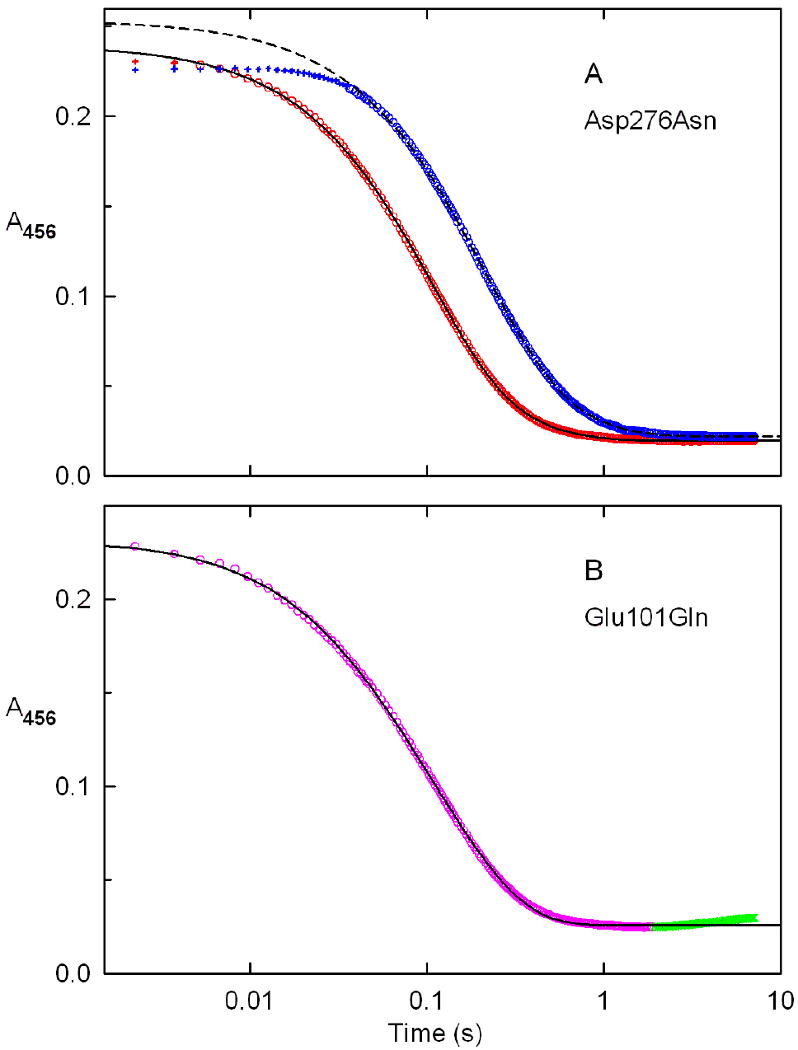
Kinetics of the anaerobic reduction of Asp276Asn (panel A) or Glu101Gln (panel B) with P2C. Reactions were conducted at 25 °C in 100 mM potassium phosphate buffer, pH 8.0, containing 50 mM glucose and 14.7 U/mL glucose oxidase. Panel A: The solid black line was obtained by fitting a double-exponential equation (y = Ae-kat + Be-kbt + C) to absorbance changes observed for the reaction of Asp276Asn with 2500 μM P2C (open red circles). The dashed black line is the corresponding fit obtained for reaction of Asp276Asn with 100 μM P2C (open blue circles). Data points in the initial lag phases (red or blue pluses) were not used in fitting. Panel B: The black line was obtained by fitting a double-exponential equation (y = Ae-kat + Be-kbt + C) to absorbance changes observed for the reaction of Glu101Gln with 1500 μM P2C (open magenta circles). A slow small increase in absorbance at 456 nm observed at longer times (green X's) was not used in the fitting.
The decrease in absorbance at 456 nm observed with Asp276Asn exhibits biphasic kinetics (y = Ae-kfastt +Be-kslowt + C) over the entire range of P2C concentrations. About 85% of the total absorbance decrease occurs in a fast phase and is attributed to the formation of a reduced enzyme•DHP complex. The rate observed for the fast phase exhibits a hyperbolic dependence on the concentration of P2C (kobs = klim[P2C]/(Kd app +[P2C]) (Figure 8A), as observed with wild-type nikD (9). The apparent second-order rate constant for the reaction of Asp276Asn with P2C, as estimated from stopped-flow data (klim/Kd app = 1.01 ± 0.01 × 10⁵ M-1 s-1), is in excellent agreement with a value calculated using steady-state kinetic parameters (kcat/Km P2C = 0.9 ± 0.1 × 10⁵ M-1 s-1) (Table 5). The limiting rate observed with Asp276Asn at saturating P2C (klim = 11.1 ± 0.2 s-1) is about 10-fold faster than the observed turnover rate (kcat = 1.22 ± 0.04 s-1) and about 5-fold slower than the limiting rate observed with wild-type nikD (klim = 53 ± 1 s-1). The modest effect of the Asp276Asn mutation on the limiting rate of the fast phase rules out a role for Asp276 as a critical active site base in the oxidation of P2C to DHP.
Figure 8.
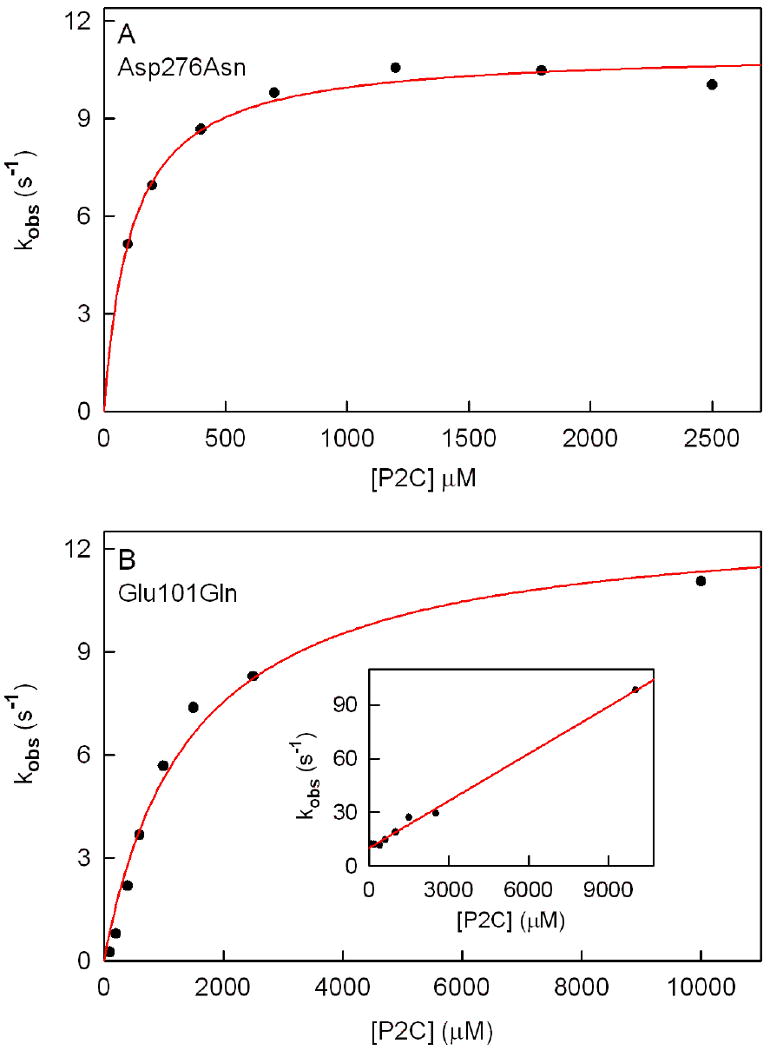
Dependence of rate constants observed for the anaerobic reduction of Asp276Asn (panel A) or Glu101Gln (panel B) on the concentration of P2C. Reactions were conducted at 25 °C in 100 mM potassium phosphate buffer, pH 8.0, containing 50 mM glucose and 14.7 U/mL glucose oxidase.
Panels A and B show plots of rate constants observed for the fast phase of the anaerobic reduction of Asp276Asn and Glu101Gln, respectively. The solid red line in each panel was obtained by fitting a hyperbolic equation (kobs = klim[P2C]/(Kd app + [P2C]) to the data (black circles). The inset in panel B is a plot of rate constants observed for the very fast phase of the anaerobic half-reaction with Glu101Gln. The red line is a linear regression analysis of the data (slope = 8.8 ± 0.2 × 10³ M-1 s-1; Y-intercept = 10.1 ± 0.9 s-1; r2 = 0.9955).
The rate observed with Asp276Asn for the slow phase of the reductive half-reaction is independent of the concentration of P2C (kslow = 3.0 ± 0.3 s-1), at least partially rate-limiting during turnover (kcat = 1.22 ± 0.04 s-1), and, within experimental error, identical to the rate obtained for the corresponding step with wild-type nikD (kslow = 2.7 ± 0.1 s-1). Our previous studies with wild-type nikD indicate that the slow step is likely to involve isomerization of an initially formed reduced enzyme•DHP complex (9).
Effect of the Glu101Gln Mutation on Turnover and the Kinetics of the Reductive Half-reaction with P2C
Double reciprocal plots obtained for the aerobic turnover of Glu101Gln with P2C at pH 8.0 exhibit parallel lines (data not shown, see Supporting Information Figure S3), in contrast to the intersecting pattern observed with wild-type nikD at this pH. The results indicate that an irreversible step occurs prior to reaction of the reduced mutant enzyme with oxygen, as will be discussed. The steady-state kinetic parameters listed in Table 5 were obtained by fitting an equation for a ping-pong mechanism (equation 2) to the data obtained with Glu101Gln.
The turnover rate observed with Glu101Gln at saturating concentrations of P2C and oxygen is about 5-fold slower than the rate observed with wild-type nikD. To directly assess the effect of the Glu101Gln mutation on the rate of P2C oxidation to DHP, we investigated the kinetics of the reductive half-reaction over a wide range of P2C concentrations (100 to 10000 μM). A lag is not observed when the reduction of Glu101Gln is monitored at 456 nm at any substrate concentration tested whereas a very slow, small increase in absorbance is observed at the end of the reaction, unlike results obtained with wild-type nikD or Asp276Asn.
The decrease in absorbance at 456 nm observed with Glu101Gln exhibits biphasic kinetics (y = Ae-kvery fastt +Be-kfastt + C) (Figure 7B). About 80% of the total absorbance decrease occurs in the fast phase and is attributed to the formation of a reduced enzyme•DHP complex. The rate observed for the fast phase exhibits a hyperbolic dependence on the concentration of P2C (kobs = klim[P2C]/(Kd app +[P2C]) (Figure 8B), as observed with wild-type nikD (9). The apparent second-order rate constant for the reaction of Glu101Gln with P2C, as estimated from stopped-flow data (klim/Kd app = 9 ± 1 × 10³ M-1 s-1), is in fairly good agreement with a value calculated using steady-state kinetic parameters (kcat/Km P2C = 4.9 ± 0.2 × 10³ M-1 s-1) (Table 5). The limiting rate observed with Glu101Gln at saturating P2C (klim = 13.9 ± 0.9 s-1) is about 30-fold faster than the observed turnover rate (kcat = 0.50 ± 0.01 s-1) and about 4-fold slower than the limiting rate observed with wild-type nikD (klim = 53 ± 1 s-1). The small effect of the Glu101Gln mutation on the limiting rate of the fast phase rules out a possible role for Glu101 as a catalytic base in the oxidation of P2C to DHP.
With the Glu101Gln mutant, the fast phase is preceded by a very fast phase (kvery fast) that exhibits a linear dependence on the concentration of P2C and a finite Y-intercept (Figure 8B, inset). The nature of the very rapid phase is unclear.
Spectral Properties of the ES Complex formed with Asp276Asn or Glu101Gln
Studies with wild-type nikD show that ES complex formation with P2C partially overlaps with the onset of enzyme reduction (9). The initial lag observed when the reaction is monitored at 456 nm arises because the absorbance decrease due to enzyme reduction is counterbalanced by an absorbance increase in this region due to ES complex formation. This feature is apparent in the difference spectrum obtained for ES complex formation, as estimated by the spectral perturbation observed 0.74 ms after mixing wild-type nikD with 2500 μM P2C (Figure 9A or B, inset, black curve). The ES complex also exhibits a broad increase in absorption in the long-wavelength region (λ > 570 nm) which is attributed to charge-transfer interaction between FAD and the electron-rich enamine tautomer of P2C (9). Although not detectable with unlabeled P2C, a time-dependent formation of the ES complex is observed in reductive half-reaction studies with wild-type nikD and [4,4,5,5,6,6,-D6]-P2C (9).
Figure 9.
Spectral course of the anaerobic reduction of Asp276Asn (panel A) or Glu101Gln (panel B) with P2C. Reactions were conducted at 25 °C in 100 mM potassium phosphate buffer, pH 8.0, containing 50 mM glucose and 14.7 U/mL glucose oxidase. Panel A: Curves 1 to 15 were recorded 0.00224, 0.0142, 0.0217, 0.0322, 0.0427, 0.0555, 0.0675, 0.0855, 0.1035, 0.1245, 0.1560, 0.1920, 0.2520, 0.3630, and 7.125 s, respectively, after mixing 18.5 μM Asp276Asn with 2500 μM P2C. Arrows indicate the direction of the observed spectral changes. Inset: The red curve is the difference spectrum obtained when the absorption spectrum of free Asp276Asn was subtracted from the spectrum observed 0.74 ms after mixing the enzyme with 2500 μM P2C. The black curve is the corresponding difference spectrum obtained for the reaction of 18.6 μM wild-type nikD with 2500 μM P2C. Panel B: Curves 1 to 11 (solid black lines) show spectra recorded 0.00074, 0.0112, 0.0217, 0.0352, 0.0525, 0.0735, 0.1005, 0.1335, 0.1800, 0.2700, and 1.875 s, respectively, after mixing 21.1 μM Glu101Gln with 1500 μM P2C. Arrows indicate the direction of the observed spectral changes during this portion of the reaction. The dashed blue curve was recorded at 7.125 s after mixing. Inset: The red curve is the difference spectrum obtained by subtracting the spectrum of free Glu101Gln from the spectrum observed 0.74 ms after mixing the enzyme with 10000 μM P2C. The black curve is the corresponding difference spectrum observed 0.74 ms with after mixing 18.6 μM wild-type nikD with 2500 μM P2C.
The spectral perturbation due to ES complex formation with Asp276Asn exhibits prominent positive bands at 464 and 492 nm and a weak negative band at 517 nm that are bathochromically shifted compared with the corresponding bands observed with wild-type nikD (442, 467, and 507 nm, respectively). The mutant complex also exhibits a broad increase in absorption at λ > 570 nm, similar to the wild-type complex, albeit considerably lower in intensity (Figure 9A, inset, red curve).
The difference spectrum obtained for the ES complex formed with Glu101Gln features a positive band at 477 nm with a pronounced shoulder at 455 nm, and broad negative peaks at 525 and 365 nm (Figure 9B, inset, red curve) but does not exhibit an increase in absorbance within the accessible long-wavelength region (λ ≤ 700 nm), unlike wild-type nikD. It is worth noting that a negative difference peak around 365 nm appears to be a signature motif of Glu101Gln complexes with active site ligands, as judged by results obtained with P2C, picolinate, CHA and MeSeA (λmin = 365, 361, 364, and 361 nm, respectively).
Spectral Course of the Reductive-half Reaction with Asp276Asn or Glu101Gln with P2C
The reaction of Asp276Asn with various concentrations of P2C exhibits an apparently isosbestic loss of bands due to oxidized flavin at 456 and 378 nm (Figure 9A). Similar results are obtained with Glu101Gln except the isosbestic point is lost when the reaction is followed for longer times, accompanied by a very slow increase in absorbance at 456 nm (Figure 9B). The nature of this very slow spectral change is unclear. Reduction of both mutants is accompanied by a progressive loss of long-wavelength absorption whereas a small transient increase in long-wavelength absorption is observed during reduction of wild-type nikD (9).
Kinetics of Picolinate Binding to Glu101Gln
Unlike wild-type nikD or other mutants, a initial lag is not detected when reduction of Glu101Gln with P2C is monitored at 456 nm. We reasoned that an initial lag might not be detectable if the mutation accelerates the rate of ES complex formation. Evidence to evaluate this hypothesis was sought by determining the effect of the mutation on the rate of complex formation with picolinate. Studies with wild-type nikD show that picolinate binding is readily monitored by using a stopped-flow spectrometer. The observed rate of complex formation with wild-type enzyme exhibits a linear dependence on ligand concentration with a finite Y-intercept (kobs = k1[L] +k2), as expected for a simple one-step approach to equilibrium (Kd = k2/k1) (9).
Picolinate binding to Glu101Gln was measured by monitoring the accompanying increase in absorbance at 480 nm. Reaction traces acquired over a 20-fold range of ligand concentrations exhibit monophasic kinetics (y = Ae-kt + B), as illustrated by results obtained with 1500 μM picolinate (Figure 10A). Unlike wild-type nikD, the observed rate of complex formation with Glu101Gln exhibits a hyperbolic dependence on picolinate concentration with a finite Y-intercept (Figure 10B). This behavior is expected in the case of a two-step binding mechanism where formation of an initial complex is followed by an isomerization reaction to yield a more stable complex (25, 26) (Scheme 4). Fitting equation 4 to the data provides an
Figure 10.
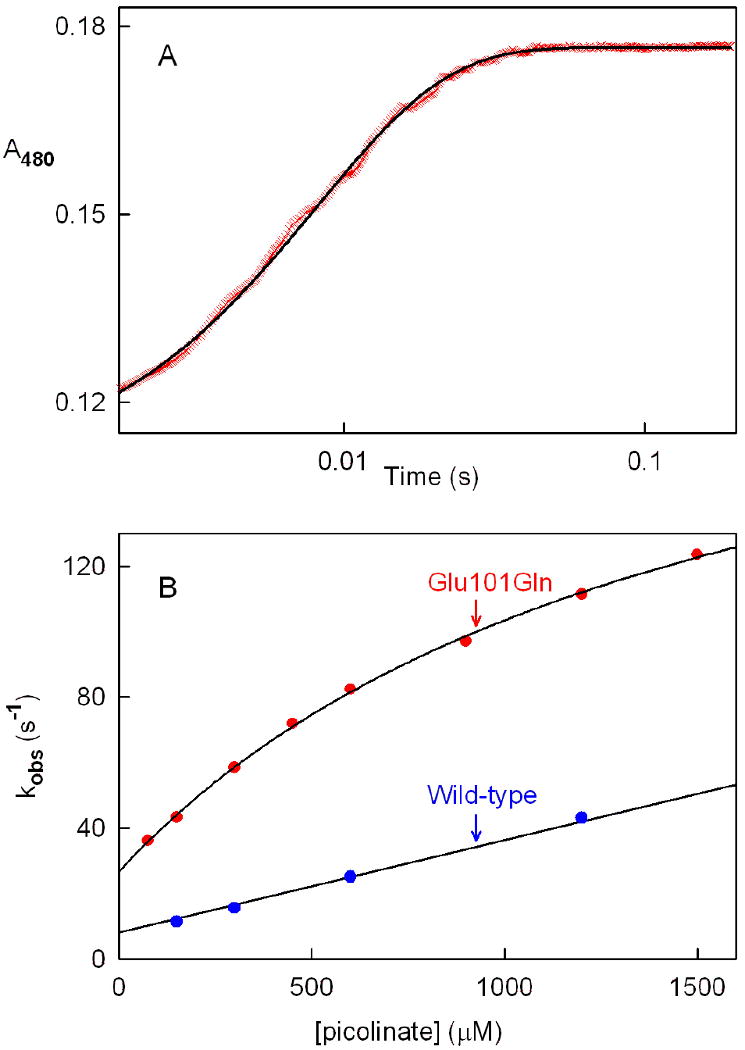
Kinetics of picolinate binding to Glu101Gln or wild-type nikD. Reactions were conducted in 100 mM potassium phosphate buffer, pH 8.0, at 25 °C. Complex formation was monitored at 480 nm using a stopped-flow spectrometer in photomultipler mode. Panel A shows the reaction observed with Glu101Gln and 1500 μM picolinate. The black line was obtained by fitting a single-exponential equation (y = Ae-kt + B) to the data (red X's). Panel B: Effect of picolinate concentration on the observed rate of complex formation. The black curve was obtained by fitting a hyperbola (equation 4) to data obtained with Glu101Gln (red circles). The black line was obtained by linear regression analysis of data obtained with wild-type nikD (blue cicles). The wild-type nikD data were taken from Bruckner and Jorns (9).
Scheme 4.

Two-step mechanism for ligand binding.
| (4) |
estimated value of the microscopic Kd for the primary binding step (k2/k1), and rate constants for the reversible interconversion of the two complexes (k3, k4) (Table 6). The overall macroscopic dissociation constant was calculated using these parameters and equation 5. The calculated
Table 6.
Kinetics of complex formation with picolinate and Glu101Gln or wild-type nikDa
| Glu101Glnb | Wild-typec | |
|---|---|---|
| k1 (M-1 s-1) | - | 2.83 ± 0.04 × 10⁴ |
| k2 (s-1) | - | 8.0 ± 0.7 |
| k2/k1 (μM) | 1500 ± 200 | - |
| k3 (s-1) | 192 ± 9 | - |
| k4 (s-1) | 27 ± 1 | - |
| Kd macroscopic (μM) | 180 ± 30 (calc) | 280 ±30 (calc) |
| 151 ± 2 (obs) | 290 ±40 (obs) |
Reactions were conducted in 100 mM potassium phosphate buffer, pH 8.0, at 25 °C.
Values for k2/k1, k3, and k4 were determined by fitting equation 4 to the observed rate of complex formation at different picolinate concentrations. The value for the macroscopic Kd was calculated using equation 5, as described in the text.
Data previously reported (9). The calculated macroscopic Kd equals k2/k1.
| (5) |
value (Kd = 180 ± 30 μM) is, within experimental error, identical to the value obtained by spectral titration (Kd = 151 ± 2 μM). Significantly, the observed rate of complex formation with Glu101Gln at a given picolinate concentration is 3- to 4-fold faster than the corresponding reaction with wild-type nikD (see Figure 10B). Assuming a similar enhanced rate of ES complex formation and taking into account the ∼4-fold slower rate of P2C oxidation to DHP, we estimate that mutation of Glu101 to Gln increases the kinetic resolution of binding and redox steps about 10-fold. This difference may be sufficient to account for the absence of a lag in the Glu101Gln reductive half-reaction.
Discussion
NikD catalyzes a remarkable aromatization reaction, involving two redox cycles, that converts P2C to picolinate, a key component of the nonribosomal peptide moiety in nikkomycin antibiotics. Stopped-flow studies of the reductive half-reaction with wild-type nikD showed that the enzyme oxidizes the enamine tautomer of P2C (9) but did not distinguish among several possible paths for the initial 2-electron oxidation step (Scheme 2). In the current study, we show that replacement of Glu101 or Asp276 by a neutral residue causes only a modest decrease (< 5-fold) in the observed rate of oxidation of P2C to DHP. The results rule out the only possible candidates for a catalytic base in the initial 2-electron oxidation step. This outcome provides compelling evidence that nikD oxidizes the bond between N(1) and C(6) in the enamine tautomer of P2C (Scheme 2 path A), ruling out alternative paths that require an active site base to mediate the oxidation of a carbon-carbon bond (Scheme 2, paths B or C).
NikD exhibits a FAD-Trp355 charge-transfer band at weakly alkaline pH that is abolished upon protonation of an unknown ionizable residue that exhibits a pKa of 7.3 in wild-type enzyme (4). The loss of the charge-transfer band may reflect a pH-induced change from a coplanar to a perpendicular configuration of the flavin and indole rings, as observed in the open and closed crystal forms, respectively, of the nikD•picolinate complex (10). Protonation of the unknown residue is required for ligand binding, as judged by the observed effect of pH on the stability of enzyme•inhibitor complexes2. On the basis of its observed proximity, we hypothesized that the conformation of the Trp355 side chain might be affected by the protonation state of Glu101 or Asp276. However, substitution of Glu101 or Asp276 with a neutral amino acid does not eliminate the ionizable group, although the pKa observed with the mutant enzymes is 1 or 2 pH units higher, respectively, compared with wild-type nikD. Mutagenesis studies that target more distal residues are currently in progress.
Although the critical redox step is only minimally effected, the Glu101Gln mutation results in an apparent change in the steady-state kinetic mechanism, as judged by the parallel line double-reciprocal plots observed under conditions (pH 8.0) where wild-type enzyme or Asp276Asn exhibit an intersecting line pattern. The parallel line pattern indicates that an irreversible step occurs prior to reaction of the reduced mutant enzyme with oxygen. This criterion might be satisfied by an irreversible oxidation of P2C to DHP (Scheme 3, k-2 = 0) or by dissociation of the reduced enzyme•DHP complex. The second alternative is unlikely because studies with wild-type nikD show that the free reduced enzyme is not a kinetically competent intermediate3. An intersecting line pattern clearly requires a reversible oxidation of P2C to DHP. However, the observed rate of reduction of wild-type nikD or either mutant at pH 8.0 exhibits a hyperbolic dependence on P2C concentration (kobs = klim[P2C]/(Kd app + [P2C]), indicating that the oxidation step is practically irreversible (25). Interestingly, although an intersecting line pattern is observed with wild-type nikD at pH ≥ 8.0, parallel line double-reciprocal plots are obtained at lower pH values4. Overall, the results suggest that the steady-state kinetics observed with Glu101Gln do not reflect a fundamental mechanistic difference as compared with wild-type enzyme.
The observed rate of formation of the Glu101Gln•picolinate complex exhibits a hyperbolic dependence on ligand concentration, indicative of a two-step binding mechanism where an initial unstable complex, (E-L)*, is produced and then converted to a more stable species (Scheme 4). Interestingly, the crystal structures of the open and closed forms of the picolinate complex with wild-type nikD led us to propose a two-step binding mechanism. In this model, ligands were thought to form an initial open complex with the indole ring of Trp355 parallel to the flavin ring, followed by displacement of Trp355 to produce a more stable complex with ligand stacked above the flavin ring (17). However, the observed rate of complex formation with wild-type enzyme was found to exhibit a linear dependence on picolinate concentration, consistent with a simple one-step approach to equilibrium (9). On the other hand, it should be noted that the results obtained with wild-type nikD do not rule out a limiting case of a two-step mechanism where apparently linear kinetics are observed because the dissociation constant of the (E-L)* complex greatly exceeds the tested range of ligand concentrations. It is thus conceivable that the Glu101 mutation may unmask the true binding mechanism by somehow increasing the stability of the (E-L)* complex.
Concluding Remarks
The studies described in this paper rule out Glu101 and Asp276, the only possible candidates for a catalytic base at the active site of nikD. The results not only provide compelling evidence regarding the nature of the initial 2-electron oxidation step but also place an important constraint on the possible mechanism of DHP oxidation. Namely, picolinate formation must be also accomplished by a pathway that does not involve oxidation of a carbon-carbon bond. This constraint prohibits further oxidation of DHP isomer A, the intermediate produced in the initial 2-electron oxidation step, but is compatible with the oxidation of DHP isomer B (see Scheme 2). Importantly, the slow phase of the reductive half-reaction observed with wild-type nikD and [4,4,5,5,6,6,-D6]-P2C exhibits a kinetic isotope effect, indicating that this phase must involve cleavage of one or more C-H bonds in DHP isomer A (9).
DHP isomer A can be converted to DHP isomer B via a two-step isomerization reaction, as previously noted (9). We postulate that the 1,5-dihydroflavin anion (FADH-) in the reduced enzyme•DHP complex acts as the acid-base catalyst required for DHP isomerization (Scheme 5). Significantly, the N(5) position in FADH- is close to the C(5) and C(6) positions in DHP (3.66 and 3.41 Å, respectively) and C(4)O in FADH- is near C(4) in DHP (3.77 Å), as judged by the structure of the closed nikD•picolinate complex (10). Conversion of DHP isomer A to DHP isomer C (Scheme 5, step 1) requires abstraction of a proton from C(5)H in isomer A and is likely to exhibit a pKa ∼ 8, as judged by the value obtained for the analogous ionization of P2C (pKa = 8.2) (7, 8). We propose that N(5)H in FADH- (pKa > 4) (27) acts as the proton acceptor in this step. Isomerization of isomer C (Scheme 5, step 2) requires a proton donor at C(6) and a proton acceptor at C(4). We propose that the proton donor and acceptor functions are performed by N(5)H2+ and C(4)O in FADH-, respectively. The postulated role of FADH- as an acid-base catalyst in DHP isomerization is similar to that recently proposed for the reduced flavin cofactor in type 2 isopentenyl-diphosphate isomerase (28). To our knowledge, nikD may provide the first example where the impressive versatility of the flavin cofactor as a redox and an acid-base catalyst has been harnessed to accomplish a remarkable aromatization reaction.
Scheme 5.

Postulated role of reduced flavin as an acid-base catalyst in the isomerization of DHP.
Supplementary Material
Acknowledgments
We are grateful to Dr. Louis Silks (National Stable Isotope Resource at Los Alamos) for his generous gift of methylselenoacetate.
Abbreviations
- FAD
flavin adenine dinucleotide
- P2C
piperideine-2-carboxylate
- CHA
1-cyclohexenoate
- MeSeA
methylselenoacetate
- KIE
kinetic isotope effect
- ES complex
enzyme•substrate complex
- MSOX
monomeric sarcosine oxidase
- DHP
dihydropicolinate
Footnotes
This work was supported in part by Grant AI 55590 (M. S. J.) from the National Institutes of Health.
R. C. Bruckner and M. S. Jorns, unpublished results.
P. R. Kommoju, R. C. Bruckner and M. S. Jorns, unpublished results.
R. C. Bruckner and M. S. Jorns, unpublished results.
Supporting Information Available: Spectral properties of complexes formed with Glu101Gln or Asp276Asn and methylselenoacetate (Figure S1), steady-state kinetic analysis of P2C oxidation by Asp276Asn (Figure S2), steady-state kinetic analysis of P2C oxidation by Glu101Gln (Figure S3). This material is available free of charge via the Internet at http://pubs.acs.org.
References
- 1.Lauer B, Russwurm R, Schwarz W, Kalmanczhelyi A, Bruntner C, Rosemeier A, Bormann C. Molecular characterization of co-transcribed genes from Streptomyces tendae Tu901 involved in the biosynthesis of the peptidyl moiety and assembly of the peptidyl nucleoside antibiotic nikkomycin. Mol Gen Genet. 2001;264:662–673. doi: 10.1007/s004380000352. [DOI] [PubMed] [Google Scholar]
- 2.Hector RF. Compounds active against cell walls of medically important fungi. Clin Microb Rev. 1993;6:1–21. doi: 10.1128/cmr.6.1.1. [DOI] [PMC free article] [PubMed] [Google Scholar]
- 3.Bruntner C, Bormann C. The Streptomyces tendae Tu901 L-lysine 2-aminotransferase catalyzes the initial reaction in nikkomycin D biosynthesis. Eur J Biochem. 1998;254:347–355. doi: 10.1046/j.1432-1327.1998.2540347.x. [DOI] [PubMed] [Google Scholar]
- 4.Venci D, Zhao G, Jorns MS. Molecular characterization of nikD, a new flavoenzyme important in the biosynthesis of nikkomycin antibiotics. Biochemistry. 2002;41:15795–15802. doi: 10.1021/bi020515y. [DOI] [PubMed] [Google Scholar]
- 5.Bruckner RC, Zhao G, Venci D, Jorns MS. Nikkomycin biosynthesis: Formation of a 4-electron oxidation product during turnover of nikD with its physiological substrate. Biochemistry. 2004;43:9160–9167. doi: 10.1021/bi0493618. [DOI] [PubMed] [Google Scholar]
- 6.Macholan L, Svatek E. Aminoketocarbonsauren VL: Über die konstitution and strukturformen der α-keto-analoga natürlichler diaminosäuren. Collection Czechoslov Chem Commun. 1960;25:2564–2575. [Google Scholar]
- 7.Srinivasan R, Fisher HF. Structural features facilitating the glutamate dehydrogenase catalyzed α-imino acid-α-amino acid interconversion. Arch Biochem Biophys. 1986;246:743–750. doi: 10.1016/0003-9861(86)90331-0. [DOI] [PubMed] [Google Scholar]
- 8.Jorns MS, Bruckner RC, Zhao G, Carrell CJ, Mathews FS. NikD: Crystal structures, charge transfer complex and endogenous ligands. In: Nishino T, Miura R, Tanokura M, Fukui K, editors. Flavins and Flavoproteins 2005. ARchiTech Inc.; Tokyo: 2005. pp. 773–785. [Google Scholar]
- 9.Bruckner RC, Jorns MS. Spectral and kinetic characterization of intermediates in the aromatization reaction catalyzed by nikD, an unusual amino acid oxidase. Biochemistry. 2009;48:4455–4465. doi: 10.1021/bi900179j. [DOI] [PMC free article] [PubMed] [Google Scholar]
- 10.Carrell CJ, Bruckner RC, Venci D, Zhao G, Jorns MS, Mathews FS. NikD, an unusual amino acid oxidase essential for nikkomycin biosynthesis: Structures of closed and open forms at 1.15 and 1.90 Å resolution. Structure. 2007;15:928–941. doi: 10.1016/j.str.2007.06.010. [DOI] [PMC free article] [PubMed] [Google Scholar]
- 11.Khanna P, Jorns MS. Characterization of the FAD-containing N-methyltryptophan oxidase from Escherichia coli. Biochemistry. 2001;40:1441–1450. doi: 10.1021/bi0024411. [DOI] [PubMed] [Google Scholar]
- 12.Wu XL, Takahashi M, Chen SG, Monnier VM. Cloning of amadoriase I isoenzyme from Aspergillus sp.: Evidence of FAD covalently linked to Cys342. Biochemistry. 2000;39:1515–1521. doi: 10.1021/bi992031g. [DOI] [PubMed] [Google Scholar]
- 13.Miura S, Ferri S, Tsugawa W, Kiin S, Sode K. Active site analysis of fructosyl amine oxidase using homology modeling and site-directed mutagenesis. Biotechnol Lett. 2006;28:1895–1900. doi: 10.1007/s10529-006-9173-9. [DOI] [PubMed] [Google Scholar]
- 14.Dodt G, Kim DG, Reimann SA, Reuber BE, McCabe K, Gould SJ, Mihalik SJ. L-pipecolic acid oxidase, a human enzyme essential for the degradation of L-pipecolic acid, is most similar to the monomeric sarcosine oxidases. Biochem J. 2000;345:487–494. [PMC free article] [PubMed] [Google Scholar]
- 15.Wagner MA, Khanna P, Jorns MS. Structure of the flavocoenzyme of two homologous amine oxidases: Monomeric sarcosine oxidase and N-methyltryptophan oxidase. Biochemistry. 1999;38:5588–5595. doi: 10.1021/bi982955o. [DOI] [PubMed] [Google Scholar]
- 16.Trickey P, Wagner MA, Jorns MS, Mathews FS. Monomeric sarcosine oxidase: Structure of a covalently-flavinylated secondary amine oxidizing enzyme. Structure. 1999;7:331–345. doi: 10.1016/s0969-2126(99)80043-4. [DOI] [PubMed] [Google Scholar]
- 17.Bruckner RC, Zhao G, Ferreira P, Jorns MS. A mobile tryptophan is the intrinsic charge transfer donor in a flavoenzyme essential for nikkomycin antibiotic biosynthesis. Biochemistry. 2007;46:819–827. doi: 10.1021/bi062087s. [DOI] [PMC free article] [PubMed] [Google Scholar]
- 18.Palfey BA, Massey V. Flavin-dependent enzymes. In: Sinnott M, editor. Comprehensive Biological Catalysis. Academic Press; New York: 1998. pp. 83–154. [Google Scholar]
- 19.Fitzpatrick PF. Insights into the mechanisms of flavoprotein oxidases from kinetic isotope effects. Journal of Labelled Compounds & Radiopharmaceuticals. 2007;50:1016–1025. doi: 10.1002/jlcr.1400. [DOI] [PMC free article] [PubMed] [Google Scholar]
- 20.Silverman RB. The organic chemistry of enzyme-catalyzed reactions. Academic Press; San Diego: 2000. [Google Scholar]
- 21.Zhao G, Song H, Chen Z, Mathews FS, Jorns MS. Monomeric sarcosine oxidase: Role of histidine 269 in catalysis. Biochemistry. 2002;41:9751–9764. doi: 10.1021/bi020286f. [DOI] [PubMed] [Google Scholar]
- 22.Ho SN, Hunt HD, Horton RM, Pullen JK, Pease LR. Site-directed mutagenesis by overlap extension using the polymerase chain reaction. Gene. 1989;77:51–59. doi: 10.1016/0378-1119(89)90358-2. [DOI] [PubMed] [Google Scholar]
- 23.Zhao G, Jorns MS. Spectral and kinetic characterization of the Michaelis charge transfer complex in monomeric sarcosine oxidase. Biochemistry. 2006;45:5985–5992. doi: 10.1021/bi0600852. [DOI] [PMC free article] [PubMed] [Google Scholar]
- 24.Massey V, Ganther H. On the interpretation of the absorption spectra of flavoproteins with special reference to D-amino acid oxidase. Biochemistry. 1965;4:1161–1173. doi: 10.1021/bi00882a027. [DOI] [PubMed] [Google Scholar]
- 25.Strickland S, Palmer G, Massey V. Determination of dissociation constants and specific rate constants of enzyme-substrate (or protein-ligand) interactions from rapid reaction kinetic data. J Biol Chem. 1975;250:4048–4052. [PubMed] [Google Scholar]
- 26.Chaiyen P, Brissette P, Ballou DP, Massey V. Thermodynamics and reduction kinetics properties of 2-methyl-3-hydroxypryidine-5-carboxylic acid oxygenase. Biochemistry. 1997;36:2612–2621. doi: 10.1021/bi962325r. [DOI] [PubMed] [Google Scholar]
- 27.Macheroux P, Ghisla S, Sanner C, Rüterjans H, Müller F. Reduced flavin: NMR investigation of N(5)-H exchange mechanism, estimation of ionisation constants and assessment of properties as biological catalyst. BMC Biochem. 2005;6:26–35. doi: 10.1186/1471-2091-6-26. [DOI] [PMC free article] [PubMed] [Google Scholar]
- 28.Unno H, Yamashita S, Ikeda Y, Sekiguchi S, Yoshida N, Yoshimura T, Kusunoki M, Nakayama T, Nishino T, Hemmi H. New role of flavin as a general acid-base catalyst with no redox function in type 2 isopentenyl-diphosphate isomerase. J Biol Chem. 2009;284:9160–9167. doi: 10.1074/jbc.M808438200. [DOI] [PMC free article] [PubMed] [Google Scholar]
Associated Data
This section collects any data citations, data availability statements, or supplementary materials included in this article.