

Abstract
Background:
PET imaging using [18F]fluorodeoxyglucose (FDG) and [11C]Pittsburgh compound B (PIB) have been proposed as biomarkers of Alzheimer disease (AD), as have CSF measures of the 42 amino acid β-amyloid protein (Aβ1-42) and total and phosphorylated tau (t-tau and p-tau). Relationships between biomarkers and with disease severity are incompletely understood.
Methods:
Ten subjects with AD, 11 control subjects, and 34 subjects with mild cognitive impairment from the Alzheimer’s Disease Neuroimaging Initiative underwent clinical evaluation; CSF measurement of Aβ1-42, t-tau, and p-tau; and PIB-PET and FDG-PET scanning. Data were analyzed using continuous regression and dichotomous outcomes with subjects classified as “positive” or “negative” for AD based on cutoffs established in patients with AD and controls from other cohorts.
Results:
Dichotomous categorization showed substantial agreement between PIB-PET and CSF Aβ1-42 measures (91% agreement, κ = 0.74), modest agreement between PIB-PET and p-tau (76% agreement, κ = 0.50), and minimal agreement for other comparisons (κ <0.3). Mini-Mental State Examination score was significantly correlated with FDG-PET but not with PIB-PET or CSF Aβ1-42. Regression models adjusted for diagnosis showed that PIB-PET was significantly correlated with Aβ1-42, t-tau, and p-tau181p, whereas FDG-PET was correlated only with Aβ1-42.
Conclusions:
PET and CSF biomarkers of Aβ agree with one another but are not related to cognitive impairment. [18F]fluorodeoxyglucose-PET is modestly related to other biomarkers but is better related to cognition. Different biomarkers for Alzheimer disease provide different information from one another that is likely to be complementary.
GLOSSARY
- A
β1-42 = 42 amino acid β-amyloid protein;
- AD
= Alzheimer disease;
- ADNI
= Alzheimer’s Disease Neuroimaging Initiative;
- CDR
= Clinical Dementia Rating;
- CI
= confidence interval;
- FDG
= [18F]fluorodeoxyglucose;
- MCI
= mild cognitive impairment;
- MMSE
= Mini-Mental State Examination;
- MR
= magnetic resonance;
- PIB
= [11C]Pittsburgh compound B;
- p-tau
= phosphorylated tau;
- ROC
= receiver operating characteristic;
- ROI
= region of interest;
- SUVR
= standardized uptake value ratio;
- t-tau
= total tau;
- WMS-R
= Wechsler Memory Scale–Revised.
Interest in biomarkers for Alzheimer disease (AD) stems from recent advances showing their potential use in diagnosis and prediction of AD, along with the promise of effective disease-modifying therapies that will require early and accurate diagnosis. In particular, the 42 amino acid amyloid-β peptide (Aβ1-42) is reduced in the CSF of patients with AD, and both total tau (t-tau) and phosphorylated tau (p-tau) are increased.1 Together, these CSF measures have been proposed as biomarkers that might be useful in the diagnosis of AD or in the prediction of who might develop it.2–4
PET with the metabolic tracer [18F]fluorodeoxyglucose (FDG) or the Aβ imaging agent [11C]Pittsburgh compound B (PIB)5 may also be useful biomarkers. FDG-PET shows reduced metabolism that is related to the neuropathologic and clinical diagnosis of AD.6–8 PIB-PET may also be useful in the diagnosis and prediction of dementia.9–11 Although some studies have evaluated some of the relationships between imaging and CSF biomarkers,12–14 results are not entirely consistent.
The Alzheimer’s Disease Neuroimaging Initiative (ADNI) is a multicenter project supported by the NIH, private pharmaceutical companies, and nonprofit organizations with the primary goal of evaluating MRI, PET, CSF, and clinical measures as biomarkers for monitoring the progression of mild cognitive impairment (MCI) and AD. We used data from ADNI to investigate the relationships between CSF and PET biomarkers and clinical disease severity.
METHODS
Subjects.
ADNI subjects undergo clinical evaluation and MRI scanning at baseline and then, depending on diagnosis, at 6, 12, 24, and 36 months (controls); 6, 12, 18, 24, and 36 months (patients with MCI); or 6, 12, and 24 months (patients with AD). The data for this report includes all ADNI subjects who had PIB-PET scans and CSF biomarkers measured by the end of 2008. Approximately 50% of all recruited ADNI subjects had CSF samples obtained at the baseline exam. An “add-on” study using PIB-PET was begun toward the end of the first year of the ADNI project and recruited 103 subjects for PIB-PET imaging; hence, most recruited subjects did not have their initial PIB scan at the actual baseline examination but at month 12 or 24. All subjects who underwent PIB scanning also had FDG scans at the same time point as well as at the baseline examination. The final sample reflects the combination of all PIB-PET subjects and an approximately 50% lumbar puncture rate so that 55 subjects (10 AD, 11 control, and 34 MCI diagnosed at study enrollment) were available who had a full data set including PIB and FDG-PET, CSF biomarkers, and clinical evaluation.
Patients with AD met criteria for probable AD15 and had Mini-Mental State Examination (MMSE) scores of 20 to 26 and Clinical Dementia Rating (CDR) scores of 0.5 or 1.16 Patients with MCI have MMSE scores between 24 and 30 and CDR scores of 0.5, and must have a memory complaint verified by an informant, documented abnormal memory function on 1 paragraph recall on the Wechsler Memory Scale–Revised (WMS-R) paragraph recall,17 and preserved general cognition. Normal controls were required to have MMSE scores of 24 to 30, no memory complaints, and normal documented memory function on the WMS-R and Logical Memory II subscale. Further information can be found at www.adni-info.org.
Standard protocol approvals, registrations and patient consents.
The procedures for this study were approved by institutional review boards of all participating institutions. Written informed consent was obtained from all participants or surrogates.
CSF and PET measurements.
Methods for CSF acquisition and biomarker measurement have been reported previously for this sample.18 In brief, CSF was collected, transferred to polypropylene tubes, and frozen on dry ice within an hour after collection. Samples were divided into aliquots at the University of Pennsylvania ADNI Biomarker Core Laboratory, stored at −80°C, and measured using the multiplex xMAP Luminex platform (Luminex Corp, Austin TX) with Innogenetics (INNO-BIA AlzBio3, Ghent, Belgium) immunoassay kit–based reagents as previously described.19 The reagents included monoclonal antibodies specific for Aβ1-42 (4D7A3), t-tau (AT120) and p-tau phosphorylated at threonine 181 (AT270), and analyte-specific detector antibodies (HT7, 3D6). Because results for t-tau and p-tau181p were similar, we generally report results for t-tau, noting similarities and differences where appropriate.
PET scanning was performed on multiple PET instruments of differing resolutions. PIB scans were collected as 4 × 5-minute frames from 50 to 70 minutes after injection of approximately 15 mCi of tracer. FDG scans were collected on the same day as the PIB scans, as 6 × 5-minute frames from 30 to 60 minutes after injection of approximately 5 mCi of tracer (and 120 minutes after injection of PIB). Scans were corrected with either segmented transmission data or CT scans, depending on instrumentation. All scans underwent quality control and were realigned and averaged, intensity normalized using a subject-specific mask with an average voxel intensity of 1, set to a standard orientation and voxel size, and smoothed to a common resolution of 8 mm full-width at half-maximum. More detailed information can be found at http://www.loni.ucla.edu/ADNI/Data/ADNI_Data.shtml.
All PET data were analyzed using regions of interest (ROIs) that were specified a priori. FDG data were first intensity normalized to a reference ROI that was comprised of averaged pons and cerebellar vermis. For the FDG analyses, we generated a group of ROIs based on regions that were frequently cited in the literature as showing differences between patients with AD and controls. These regions included the bilateral angular gyrus, posterior cingulate/precuneus, and inferior temporal cortex of both hemispheres. The ROIs were defined using coordinates from the Montreal Neurological Institute atlas. Each individual’s PET scan was then spatially normalized to the SPM5 PET template, and mean FDG counts were extracted from each ROI. These ROI mean counts were then averaged to form a single “composite” FDG ROI that was the variable used in all FDG-PET analyses.
PIB data were normalized to the cerebellum to create standardized uptake ratio (SUVR) images.20 All ROIs were drawn on a structural magnetic resonance (MR) template from a single 79-year-old MCI subject scanned at the University of Pittsburgh (an “average” elderly individual representative of atrophy and ventricular size). Each subject’s PIB-PET data were coregistered to his or her MRI using SPM5. The individual’s MR was then normalized to the MCI template using linear and nonlinear parameters implemented in SPM5; these parameters were then used to transform the subject’s PIB-PET scan to the template space. The PIB-PET data were resliced to the dimensions of the MCI template, and normalized counts were extracted from each ROI. A total of 14 ROIs were generated using the MCI template; for this report, we averaged bilateral cortical ROIs in which PIB uptake has previously been shown to occur: anterior cingulate, prefrontal, lateral temporal, and parietal cortex, and posterior cingulate/precuneus. This produced a mean cortical PIB SUVR,9,21 which was the variable used in all PIB-PET analyses.
Data analysis.
For the comparison among biomarkers (CSF measures, PIB- and FDG-PET), we evaluated relationships as both continuous and dichotomous measures. Dichotomous measures were defined using cutoffs obtained from samples other than these ADNI subjects. For the CSF variables, these cutoffs were established with receiver operating characteristic (ROC) analyses performed on a group of 56 subjects with autopsy-confirmed AD and 52 cognitively normal elderly controls evaluated and followed at the University of Pennsylvania Alzheimer’s Disease Clinical Core using the same CSF analytic protocol as the ADNI sample.18 In these individuals, the Aβ1-42 value of 192 pg/mL was the upper limit to diagnose AD with a sensitivity of 96.4% and specificity of 76.9%. For t-tau, the optimal cutoff was 93 pg/mL (sensitivity 69.6%, specificity 92.3%), and for p-tau181p, this was 23 pg/mL (sensitivity 67.9%, specificity 73.1%), above which subjects were defined as having AD. To define PIB-PET scans as positive or negative, we used data from a separate group of 20 normal controls and 20 patients with AD scanned in Berkeley and analyzed using methods identical to ADNI. An ROC approach defined this cutoff as a PIB SUVR of 1.465 for the mean cortical ROI with a sensitivity and specificity both of 90%.21 For FDG-PET, we performed an ROC analysis on all the ADNI controls and patients with AD with baseline FDG-PET scans who were not subjects in this report (85 patients with AD and 91 controls). The optimal cutoff of the composite ROI was 1.21, yielding a sensitivity of 82% and specificity of 72%. Values for each biomarker were thus considered “positive” if they fell within the range defined as AD by these cutoffs. Comparisons between methods used percent agreement as well as the κ statistic with 95% confidence intervals (CI). The κ statistic compares the agreement between the 2 techniques in relation to the agreement that would be expected by chance, an important correction because the proportion of positive results differed across modalities. Comparisons between methods also used continuous outcomes with regression models. In these models, secondary analyses included age, education, and diagnostic group as covariates to examine confounding between variables.
RESULTS
Table 1 shows the sample characteristics. CSF measurements were performed at the baseline examination in all subjects, and the majority of individuals had PIB scans 1 year later. FDG scans and clinical evaluations were performed at baseline and 12- and 24-month time points. As a result, all reported comparisons are contemporaneous except for the comparison between CSF and PIB-PET. Groups were comparable in terms of age, gender, and education, although neither CSF Aβ1-42 nor either tau measurement was different across groups (analysis of variance, p > 0.15). Many cases were PIB+ regardless of diagnostic group.
Table 1 Sample characteristics
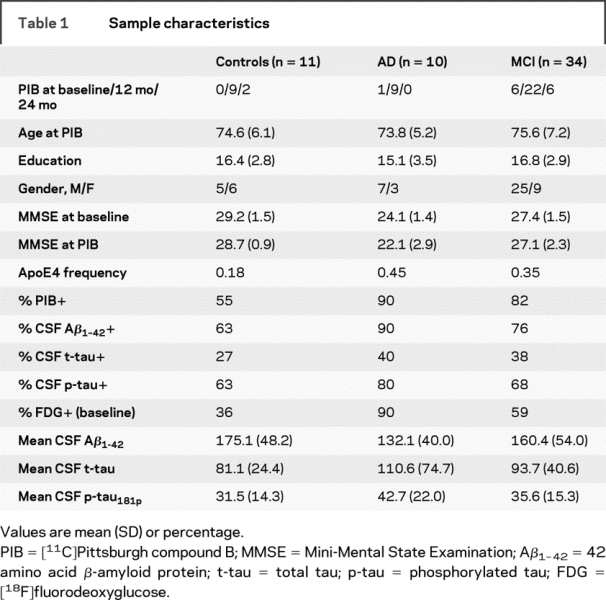
Figure 1 shows the relationships between PIB-PET, CSF, and FDG scans for all the clinical groups, and table 2 shows the numerical agreement. Of 43 cases classified as PIB+, 40 were also classified as AD by CSF Aβ1-42 measurements, 19 were classified as AD by t-tau measurement, and 28 were classified as AD by FDG. Of the 12 cases classified as PIB−, 10 were classified as negative by CSF Aβ1-42, 11 were classified as negative by CSF t-tau, and 6 were classified as negative by FDG. Thus, there was 91% agreement (κ = 0.74, CI 0.53–0.95) between PIB and CSF Aβ1-42, 55% agreement for PIB and t-tau (κ = 0.21, CI 0.05–0.37), 76% agreement for p-tau181p (κ = 0.50, CI 0.25–0.75), and 62% agreement for PIB and FDG (κ = 0.12, CI −0.13 to 0.37). Interestingly, three-fifths of the disagreements between PIB and CSF Aβ1-42 involved subjects whose values were very close to the cut points for differentiation; this was not the case for discrepancies between PIB and the other variables (figure 1). Regression analysis including all subjects indicated that the mean cortical PIB SUVR was correlated with Aβ1-42 (r = 0.73, p < 0.0001), t-tau (R = 0.42, p = 0.001), p-tau181p (R = 0.49, p = 0.0001), and the FDG composite ROI (R = 0.28, p = 0.04). In addition, Aβ1-42 and t-tau were correlated with one another (R = 0.38, p = 0.004).

Figure 1 Mean cortical [11C]PIB SUVR plotted against CSF Aβ1-42 (A) and CSF t-tau (B) and the composite FDG-PET (C) measure for all subjects
Cutoffs for PIB SUVR and each biomarker are marked on each axis and were defined in separate cohorts as described in the text. PIB = Pittsburgh compound B; SUVR = standardized uptake value ratio; Aβ 1-42 = 42 amino acid β-amyloid protein; t-tau = total tau; FDG = [18F]fluorodeoxyglucose; MCI = mild cognitive impairment; AD = Alzheimer disease.
Table 2 Number of cases positive and negative for Alzheimer disease on PIB or FDG scans that were positive and negative on other biomarkers
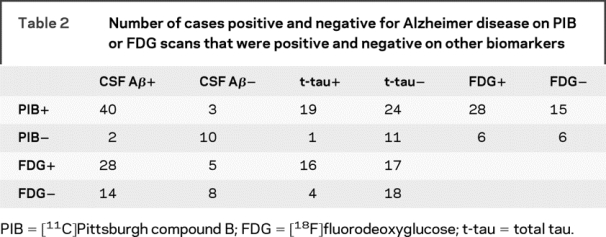
Figure 2 shows the relationships between FDG-PET and CSF measures, and the numerical agreement is again in table 2. Thirty-three cases were classified as AD by FDG-PET, of which 28 had positive CSF Aβ1-42 results and 16 had positive CSF t-tau results. Of 22 FDG scans classified as negative for AD, 8 were CSF Aβ1-42 negative, and 18 were t-tau negative. Thus, agreement was 65% (κ = 0.23, CI −0.02 to 0.48) between FDG and CSF Aβ1-42, 62% (κ = 0.28, CI 0.05–0.5) between FDG and t-tau, and 65% for p-tau181p (κ = 0.25, CI −0.01 to 0.51). In continuous analyses, the FDG composite ROI was related to CSF Aβ1-42 (R = 0.33, p = 0.01), marginally to t-tau (R = 0.24, p = 0.08), and also to p-tau181p (R = 0.34, p = 0.01).

Figure 2 Values for the composite FDG-PET ROI as defined in the text, plotted against CSF Aβ1-42 (A) and CSF t-tau (B)
Cutoff values are marked on each axis and were defined in separate cohorts as described in the text. FDG = [18F]fluorodeoxyglucose; ROI = region of interest; Aβ1-42 = 42 amino acid β-amyloid protein; t-tau = total tau; AD = Alzheimer disease; MCI = mild cognitive impairment.
Figure 3 shows the relationships between the 4 biomarkers and cognitive status as measured with the MMSE. MMSE was not related to Aβ1-42 (R = 0.01, p = 0.48) or mean cortical PIB SUVR (R = 0.20, p = 0.13), but was related to p-tau181p (R = 0.28, p = 0.04), was related marginally to t-tau (R = 0.26, p = 0.055), and was most strongly related to FDG at both baseline (R = 0.37, p = 0.005) and the time of the PIB scan (R = 0.63, p < 0.0001). These results were not substantially affected by adjusting for age and education, but adjustment for diagnostic group resulted in loss of significance for the relationships between MMSE and p-tau181p, t-tau, and baseline (but not subsequent) FDG-PET. Identical analyses using the Alzheimer’s Disease Assessment Scale Cognitive subscale and the Auditory Verbal Learning Test as dependent measures produced results that were similar.

Figure 3 Cognitive function (measured with MMSE) vs CSF Aβ1-42 (A), CSF t-tau (B), mean cortical PIB SUVR (C), and composite FDG-PET (D) in a univariate analysis
The regression shown for FDG-PET is the baseline examination compared with baseline MMSE. Significant associations are reported in the text. MMSE = Mini-Mental State Examination; Aβ1-42 = 42 amino acid β-amyloid protein; t-tau = total tau; PIB = [11C]Pittsburgh compound B; SUVR = standardized uptake value ratio; FDG = [18F]fluorodeoxyglucose; ROI = region of interest.
Because relationships between biomarkers may also be confounded by diagnostic groups, secondary analyses included age, education, and diagnostic group in the regression models. PIB-PET remained associated with Aβ1-42 (p < 0.0001), t-tau (p < 0.0007), and p-tau181p (p < 0.0005). However, the relationship between FDG-PET and both PIB-PET and t-tau was no longer significant with the inclusion of diagnosis, and the relationship between FDG-PET and p-tau181p was marginal (p = 0.06), whereas the relationship between FDG-PET and Aβ1-42 remained (p = 0.04).
DISCUSSION
These data show different patterns of relationships among the biomarkers and between the biomarkers and MMSE. The 2 measures of brain Aβ deposition—obtained with PET and CSF—were substantially related to one another regardless of whether evaluated as continuous or dichotomous variables and regardless of age, education, and diagnosis. In contrast, there was less agreement between PIB and tau and between FDG and the other biomarkers; in these situations, agreement on the classification of subjects was generally similar, with κ values generally from 0.1 to 0.3 indicating only fair agreement, with the exception of the relationship between PIB and p-tau181p, which were in moderate agreement. A different pattern of results emerged for relationships with cognition, because MMSE was most strongly related to FDG-PET, and not to the Aβ measurements. Continuous univariate analyses showed that FDG was significantly associated with PIB, tau variables, and Aβ1-42, whereas inclusion of the diagnostic group in the models negated this relationship for PIB and t-tau, suggesting that the relationship between glucose metabolism and these variables was related to diagnosis or disease stage. Taken together, the results suggest that PIB-PET and CSF Aβ measure the same process and are not confounded by diagnostic category, whereas glucose metabolism tracks a different process that is related to cognitive impairment and confounded by diagnosis when related to other biomarkers. Tau measurements seem to be intermediate, having modest associations with both Aβ and cognition. Differences in glucose metabolism between diagnostic groups may account for associations between FDG-PET and biomarkers such as tau when evaluated in groups of subjects with different diagnoses.
Findings of agreement between Aβ biomarkers across different diagnoses are important for several reasons. Many subjects, regardless of diagnosis, showed evidence of brain Aβ accumulation. In this situation, there is no gold standard for clinicians because clinical categorization is so obviously problematic. Future applications of biomarkers may well involve the detection of Aβ, tau, or clinical decline rather than a specific diagnosis, depending on the availability and efficacy of therapy.
Our results agree with previous reports showing strong associations between CSF Aβ1-42 and PIB-PET using both dichotomous and continuous correlations,12,13,22 and disagree with a report suggesting discrepancies between the 2 biomarkers.23 Studies have also reported a relationship between PIB and tau measures, though in general these are less robust than for Aβ1-42.22 The relationship between FDG-PET and PIB-PET is complex, depending to some extent on which regions are compared, because parietal cortex shows an inverse relationship between Aβ deposition and glucose metabolism, whereas other regions, notably prefrontal cortex, do not.5,24 The variables used in our analyses were summary measures intended to reflect a global index for each tracer; our results cannot address the ROI differences in the patterns of relationships but do introduce the idea that diagnosis may be a confounding factor in these associations. Finally, the relationships between FDG-PET and CSF measures that have been previously reported are variable, with some studies suggesting an association between FDG and p-tau14,25,26 but not Aβ1-4226 and other studies showing no association with p-tau but weak associations with t-tau.27 These studies are difficult to compare because they used different subject groups, different imaging methods, different immunoassays, and different tau phosphorylation sites.
This study has several limitations, most importantly the delay between CSF sampling and PIB scanning. However, the detection of strong associations despite this delay, and previous reports of stability of CSF measurements and PIB deposition over years28–30 mitigates this problem. The use of a single averaged ROI for both the FDG and PIB measures is another limitation, because regional tracer uptake has clinical significance that may provide additional information. Nevertheless, our goal was the development of a summary measure that could be used for overall assessment of glucose metabolism and PIB uptake; similar measures have been used previously.9 The ADNI cohort was selected to represent individuals who participate in clinical trials and as such may not be completely generalizable. The strengths of the report include a moderately large sample, use of separate groups to define cutoff values, and the multicenter nature of the study that demonstrates feasibility of the approach on a large scale.
Biomarkers for AD are an intense area of development, largely because of optimism about the potential for effective therapies. It is increasingly apparent that each biomarker may play a different role in diagnosis, prediction, or monitoring. These results indicate that different modalities for measuring β-amyloid produce similar results, but that measures of glucose metabolism and tau reflect a different process that is better related to cognitive impairment and diagnosis. This reflects an emerging view wherein Aβ deposition is a relatively early and pivotal event that advances slowly and triggers a cascade that includes downstream alterations in tau, synaptic and neuronal loss, reduction in glucose metabolism, and cerebral atrophy, all of which are better related to cognitive decline than is Aβ itself.21,31 Regardless of the precise mechanism, the different and complementary nature of these biomarkers suggests that their combined use will be more informative than the use of any one measurement alone.
DISCLOSURE
Dr. Jagust serves on a scientific advisory board of Genentech; has served as a consultant to Synarc, Elan Pharmaceuticals, Genentech, Ceregene, Schering-Plough, and Merck & Co.; and receives research support from the NIH [AG027859 (PI), AG027984 (PI), and AG 024904 (Coinvestigator)] and the Alzheimer’s Association [ZEN-08-87090 (PI)]. Dr. Landau, Dr. Trojanowski, and Dr. Koeppe report no disclosures. Dr. Shaw serves on the editorial board of Therapeutic Drug Monitoring; serves on the board of directors and hold stock options in Saladax Biomedical; receives research support from the NIH [AG024904 (Co-PI)]; receives royalties from publishing Applied Pharmacokinetics and Pharmacodynamics: Principles of Therapeutic Drug Monitoring (Wolters Kluwer/Lippincott Williams & Wilkins, 2005); receives revenue for a patent licensed by the University of Pennsylvania to Novartis (US patent pending); and received speaker honorarium from Pfizer. Dr. Reiman serves on scientific advisory boards of Accera, AstraZeneca, Elan Pharmaceuticals, Eli Lilly, and GlaxoSmithKline; serves as a consultant to Amnestix/Sygnis; serves as Deputy Editor of the Journal of Clinical Psychiatry; holds US Patent Number 6,374,130, issued April 16, 2002; and receives research support from Kronos Life Sciences, GlaxoSmithKline, AstraZeneca, Avid, the NIA [9 R01 AG031581-10 (PI)], and the State of Arizona. Dr. Foster serves/has served on scientific advisory boards for Myriad Pharmaceuticals, GE Healthcare, Wyeth/Élan Pharmaceuticals, the National Alliance for Caregiving, the University of Texas Southwestern Alzheimer’s Disease Research Center, the University of Alabama at Birmingham Alzheimer’s Disease Research Center, and the NIH Alzheimer’s Disease Neuroimaging Initiative; has received speaker honoraria from Myriad Pharmaceuticals, GE Healthcare, and numerous non–industry-sponsored activities; receives research support as a Site Coinvestigator from Eli Lilly & Co., Baxter Bioscience/ADCS, Élan Pharmaceuticals, Merck & Co., Inc., Myriad Genetics, and Eisai Inc./ICON Medical Research; and receives research support from the NIH [NIA U01 AG024904 (Site PI), R01 EB00768 (Coinvestigator), Pfizer/ADCS/NIH U01 AG10483 (Site Coinvestigator), NIA R01 AG022394 (PI), and NINDS T32 NS07222 (Coinvestigator)], CMS (Site PI), the University of Pennsylvania (PI), the Donald W. Reynolds Foundation (Coinvestigator), and the Ben B. and Iris M. Margolis Foundation (PI). Dr. Petersen serves as a consultant to Elan Pharmaceuticals, Wyeth Pharmaceuticals, and GE Healthcare; receives royalties from publishing Mild Cognitive Impairment (Oxford University Press, 2003); and receives research support from the NIA [AG 06786 (PI) and AG 16574 (PI)]. Dr. Weiner serves on scientific advisory boards for Bayer Schering Pharma, Eli Lilly, Nestle, CoMentis, Neurochem, Eisai, Avid, Aegis, Genentech, Allergan, Lippincott, Bristol Meyers Squibb, Forest, Pfizer, McKinsey, Mitsubishi, and Novartis. He has received non–industry-supported funding for travel; serves on the editorial board of Alzheimer’s & Dementia; received honoraria from the Rotman Research Institute and BOLT International; receives research support from Merck & Co, Avid, NIH [U01AG024904 (PI), P41 RR023953 (PI), R01 AG10897 (PI), P01AG19724 (Coinvestigator), P50AG23501 (Coinvestigator), R24 RR021992 (Coinvestigator), R01 NS031966 (Coinvestigator), and P01AG012435 (Coinvestigator)], the Department of Defense [DAMD17-01-1-0764 (PI)], and the Veterans Administration [MIRECC VISN 21 (Core PI)]; and holds stock in Synarc and Elan Pharmaceuticals. Dr. Price receives research support from the NIH [MH070729 (PI), NS060184 (PI), AG027998-01A1 (PI), and MH082463 (PI)], the Dana Foundation (PI), and the Pennsylvania Department of Health (Coinvestigator). Dr. Mathis serves on a scientific advisory board for Neuroptix; receives/has received speaker honoraria and funding for travel from Elan Pharmaceuticals, GE Healthcare, Bayer-Schering, IBA, and Takeda; serves as a consultant to GE Healthcare and Elan Pharmaceuticals; serves on the editorial board of Nuclear Medicine and Biology; holds stock options in Neuroptix; holds approximately 20 active US and international patents for amyloid imaging agents (1996–present); performs PIB imaging (35% of practice); receives license fees from GE Healthcare and Neuroptix; receives royalty payments from GE Healthcare and Neuroptix (amyloid imaging agents for brain and eye applications); and receives research support from Neuroptix (PI), the NIH [AG018402 (PI) and AG024904-S03 (Supplement PI)], the American College of Radiology Imaging Network [PA4004 (PI) and DOE DE-FG02-03ER63590 (PI)], and the Dana Foundation (PI).
Supplementary Material
Address correspondence and reprint requests to Dr. William Jagust, Helen Wills Neuroscience Institute, 132 Barker Hall, University of California, Berkeley, CA 94620 jagust@berkeley.edu
Supplemental data at www.neurology.org
*Data used in the preparation of this article were obtained in part from the Alzheimer’s Disease Neuroimaging Initiative (ADNI) database (www.loni.ucla.edu/ADNI). As such, the investigators within ADNI contributed to the design and implementation of ADNI and/or provided data but did not participate in analysis of writing of this report. ADNI investigators are listed at http://www.loni.ucla.edu/ADNI/Collaboration/ADNI_Authorship_list.pdf. Coinvestigators for this study are listed in appendix e-1 on the Neurology® Web site at www.neurology.org.
Supported by NIH grants AG024904 and AG027859.
Disclosure: Author disclosures are provided at the end of the article.
Received January 29, 2009. Accepted in final form July 20, 2009.
REFERENCES
- 1.Sunderland T, Linker G, Mirza N, et al. Decreased beta-amyloid1–42 and increased tau levels in cerebrospinal fluid of patients with Alzheimer disease. JAMA 2003;289:2094–2103. [DOI] [PubMed] [Google Scholar]
- 2.Ronald and Nancy Reagan Research Institute of the Alzheimer’s Association and the National Institute on Aging Working Group. Consensus report of the working group on: “Molecular and biochemical markers of Alzheimer’s disease.” Neurobiol Aging 1998;19:109–116. [PubMed] [Google Scholar]
- 3.Hansson O, Zetterberg H, Blennow K. Evaluation of plasma Aβ40 and Aβ42 as predictors of conversion to Alzheimer’s disease in patients with mild cognitive impairment. Neurobiol Aging Epub 2008 Oct 25. [DOI] [PubMed]
- 4.Blennow K, Vanmechelen E, Hampel H. CSF total tau, Aβ42 and phosphorylated tau protein as biomarkers for Alzheimer’s disease. Mol Neurobiol 2001;24:87–97. [DOI] [PubMed] [Google Scholar]
- 5.Klunk WE, Engler H, Nordberg A, et al. Imaging brain amyloid in Alzheimer’s disease with Pittsburgh compound-B. Ann Neurol 2004;55:306–319. [DOI] [PubMed] [Google Scholar]
- 6.Silverman DH, Small GW, Chang CY, et al. Positron emission tomography in evaluation of dementia: regional brain metabolism and long-term outcome. JAMA 2001;286:2120–2127. [DOI] [PubMed] [Google Scholar]
- 7.Jagust W, Reed B, Mungas D, Ellis W, Decarli C. What does fluorodeoxyglucose PET imaging add to a clinical diagnosis of dementia? Neurology 2007;69:871–877. [DOI] [PubMed] [Google Scholar]
- 8.Foster NL, Heidebrink JL, Clark CM, et al. FDG-PET improves accuracy in distinguishing frontotemporal dementia and Alzheimer’s disease. Brain 2007;130:2616–2635. [DOI] [PubMed] [Google Scholar]
- 9.Mintun MA, Larossa GN, Sheline YI, et al. [11C]PIB in a nondemented population: potential antecedent marker of Alzheimer disease. Neurology 2006;67:446–452. [DOI] [PubMed] [Google Scholar]
- 10.Rabinovici GD, Furst AJ, O’Neil JP, et al. 11C-PIB PET imaging in Alzheimer disease and frontotemporal lobar degeneration. Neurology 2007;68:1205–1212. [DOI] [PubMed] [Google Scholar]
- 11.Pike KE, Savage G, Villemagne VL, et al. Beta-amyloid imaging and memory in non-demented individuals: evidence for preclinical Alzheimer’s disease. Brain 2007;130:2837–2844. [DOI] [PubMed] [Google Scholar]
- 12.Fagan AM, Mintun MA, Mach RH, et al. Inverse relation between in vivo amyloid imaging load and cerebrospinal fluid Aβ42 in humans. Ann Neurol 2006;59:512–519. [DOI] [PubMed] [Google Scholar]
- 13.Fagan AM, Roe CM, Xiong C, Mintun MA, Morris JC, Holtzman DM. Cerebrospinal fluid tau/beta-amyloid(42) ratio as a prediction of cognitive decline in nondemented older adults. Arch Neurol 2007;64:343–349. [DOI] [PubMed] [Google Scholar]
- 14.Fellgiebel A, Siessmeier T, Scheurich A, et al. Association of elevated phospho-tau levels with Alzheimer-typical 18F-fluoro-2-deoxy-D-glucose positron emission tomography findings in patients with mild cognitive impairment. Biol Psychiatry 2004;56:279–283. [DOI] [PubMed] [Google Scholar]
- 15.McKhann G, Drachman D, Folstein M, Katzman R, Price D, Stadlan EM. Clinical diagnosis of Alzheimer’s disease: report of the NINCDS-ADRDA work group under the auspices of Department of Health and Human Services Task Force on Alzheimer’s Disease. Neurology 1984;34:939–944. [DOI] [PubMed] [Google Scholar]
- 16.Morris JC. The Clinical Dementia Rating (CDR): current version and scoring rules. Neurology 1993;43:2412–2414. [DOI] [PubMed] [Google Scholar]
- 17.Wechsler D. Wechsler Memory Scale–Revised. San Antonio: The Psychological Corporation; 1987. [Google Scholar]
- 18.Shaw LM, Vanderstichele H, Knapik-Czajka M, et al. Cerebrospinal fluid biomarker signature in Alzheimer’s disease neuroimaging initiative subjects. Ann Neurol 2009;65:403–413. [DOI] [PMC free article] [PubMed] [Google Scholar]
- 19.Olsson A, Vanderstichele H, Andreasen N, et al. Simultaneous measurement of beta-amyloid(1–42), total tau, and phosphorylated tau (Thr181) in cerebrospinal fluid by the xMAP technology. Clin Chem 2005;51:336–345. [DOI] [PubMed] [Google Scholar]
- 20.Lopresti BJ, Klunk WE, Mathis CA, et al. Simplified quantification of Pittsburgh compound B amyloid imaging PET studies: a comparative analysis. J Nucl Med 2005;46:1959–1972. [PubMed] [Google Scholar]
- 21.Mormino EC, Kluth JT, Madison CM, et al. Episodic memory loss is related to hippocampal-mediated beta-amyloid deposition in elderly subjects. Brain 2009;132(pt 5):1310–1323. [DOI] [PMC free article] [PubMed] [Google Scholar]
- 22.Forsberg A, Engler H, Almkvist O, et al. PET imaging of amyloid deposition in patients with mild cognitive impairment. Neurobiol Aging 2008;29:1456–1465. [DOI] [PubMed] [Google Scholar]
- 23.Koivunen J, Pirttila T, Kemppainen N, et al. PET amyloid ligand [11C]PIB uptake and cerebrospinal fluid beta-amyloid in mild cognitive impairment. Dement Geriatr Cogn Disord 2008;26:378–383. [DOI] [PubMed] [Google Scholar]
- 24.Edison P, Archer HA, Hinz R, et al. Amyloid, hypometabolism, and cognition in Alzheimer disease: an [11C]PIB and [18F]FDG PET study. Neurology 2007;68:501–508. [DOI] [PubMed] [Google Scholar]
- 25.Ceravolo R, Borghetti D, Kiferle L, et al. CSF phosphorylated Tau protein levels correlate with cerebral glucose metabolism assessed with PET in Alzheimer’s disease. Brain Res Bull 2008;76:80–84. [DOI] [PubMed] [Google Scholar]
- 26.Mosconi L, De Santi S, Brys M, et al. Hypometabolism and altered cerebrospinal fluid markers in normal apolipoprotein E E4 carriers with subjective memory complaints. Biol Psychiatry 2008;63:609–618. [DOI] [PMC free article] [PubMed] [Google Scholar]
- 27.Haense C, Buerger K, Kalbe E, et al. CSF total and phosphorylated tau protein, regional glucose metabolism and dementia severity in Alzheimer’s disease. Eur J Neurol 2008;15:1155–1162. [DOI] [PubMed] [Google Scholar]
- 28.Sunderland T, Wolozin B, Galasko D, et al. Longitudinal stability of CSF tau levels in Alzheimer patients. Biol Psychiatry 1999;46:750–755. [DOI] [PubMed] [Google Scholar]
- 29.Zetterberg H, Pedersen M, Lind K, et al. Intra-individual stability of CSF biomarkers for Alzheimer’s disease over two years. J Alzheimers Dis 2007;12:255–260. [DOI] [PubMed] [Google Scholar]
- 30.Engler H, Forsberg A, Almkvist O, et al. Two-year follow-up of amyloid deposition in patients with Alzheimer’s disease. Brain 2006;129:2856–2866. [DOI] [PubMed] [Google Scholar]
- 31.Jack CR Jr, Lowe VJ, Senjem ML, et al. 11C PiB and structural MRI provide complementary information in imaging of Alzheimer’s disease and amnestic mild cognitive impairment. Brain 2008;131:665–680. [DOI] [PMC free article] [PubMed] [Google Scholar]
Associated Data
This section collects any data citations, data availability statements, or supplementary materials included in this article.